BTC Scenario for Bounce Back 4k? Interesting ChartHello. i have something to show. let's see if this chart pattern was working and i will update this chart insya allah so make sure u follow me and like this,
Last trade was amazing we can predict that big move.
STATUS : i'm prefer long at this point .
but if u want to wait it's ok
BEST
How to Identify Trend Like an Institutional Investor on BTC!Here we are, coming back to the concept of mass.
Let's pretend you're rolling a snowball up a hill. The further you roll it, the larger the snowball will get. The heavier the snowball, the more force will be required to continue rolling it. Once the snowball reaches critical mass it will roll down to the bottom of the hill. Of course, you only bet on that occurrence when the snowball actually starts to roll down the hill when there is no longer sufficient force to sustain it. Turns out you can get these same readings in the form of "distributional mass," or the width of the bellcurve surrounding price.
Adapting periods to match these bands has excellent results! The 300 1.25 standard deviation perfectly represents the pivot of trending. As soon as that pivot was crossed, price immediately started rolling down to the bottom of the hill, (the 300 moving average.) That is still bitcoin's price target.
Interestingly enough, a new shorter term distribution has begun to expand conversely to the original downward mean reversion. We're actually seeing a short term bullish mean reversion to the 60 moving average before price can revert down to the 300 moving average.
However, it is important to know that long term mean reversion CAN trump short term mean reversion. After all, momentum will be stronger if an object has greater mass.
Want to learn more about trading with "mass" as a metric? Click below!
How to become a millionaire scalpingIf price goes inside the purple band, we'll revert to it's center.
Just hit play.
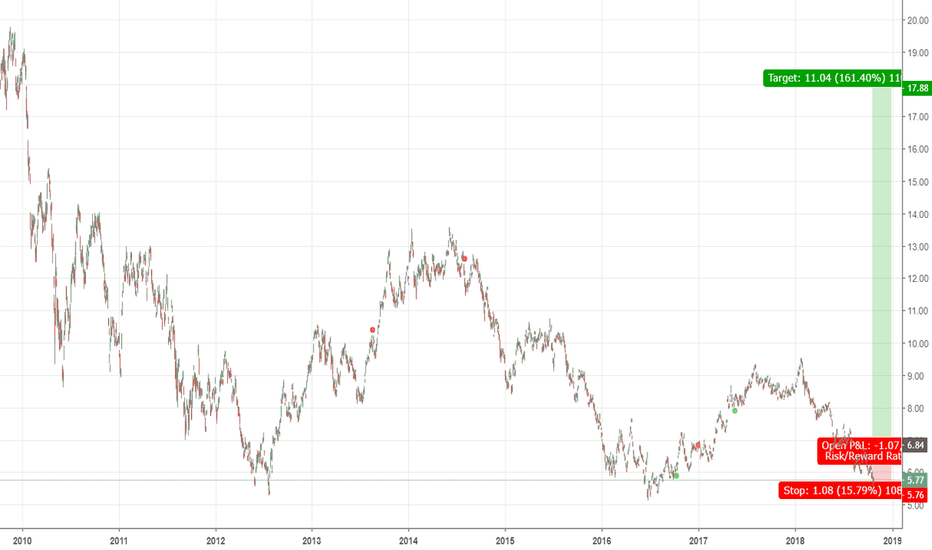
BBVA -Long Opportiunity- By Abdolreza SadreddiniBBVA - Banco Bilbao has very good potential for long term profit if bounce back and close a daily candle above $6.80.
Obviously, the stop loss would be set under knee the lowest point and TP will be over $25.00 in long time.
Setting a buy stop at $6.80 would be a smart move.
Market Report by Abdolreza Sadreddini
Training coursean easy training course for day trading
1 or 2 trade per day with fixed profit
if you want to be aperfect trader try this
BTCUSD a right trade again ! DH TRADING MARKETS
For subscribers of DH Trading BTCUSD , they was able to catch an other good opportunity !
This is NOT repainting strategy and you can check this is normal bars (avoid Heikin Ashi or Renko bars for backtests !)
If you want to test by yourself you can ask for a trial !
Contact us for more information about this strategy and get strong results
BTCUSD a right trade again ! DH TRADING MARKETS
For subscribers of DH Trading BITSTAMP BTCUSD , they was able to catch an other good opportunity !
This is NOT repainting strategy and you can check this is normal bars (avoid Heikin Ashi or Renko bars for backtests !).
If you want to test by yourself you can ask for a trial !
Contact us for more information about this strategy and get strong results !!
BTC/USD 2018-2020 Accurate Price PredictionThe Rothschilds, JP Morgan, Wells Fargo, tv celebrities and do I even need to mention Goldman Sachs already has put in a trading desk? Very bullish period ahead to cure our tender hearts from this chilly bearish season. Stock up next dip guys. #2018TheLastYearNormalPeopleCanBuyBitcoin
SCALP - ETPUSD - Possible double top - 36% short ?Yoooo shaggerz,
I'm still very bullish on ETPUSD. But as many calls it, it might need a correction. Or not...
Anyway, I've identified a potential double top pattern forming on ETPUSD.
Of course pattern is playing out, and is not finalized yet. Invalidation point is breakout above the top line.
Beware tho : NEVER SHORT ETP' someone wise said !
NOT TRADING ADVICE


