Bestsignals

MATIc 👌matic Usdt
🌹Smart capital management
✔️E1: 0.8357 1%
✔️E2: 0.8428 1.5%
✔️E3: 0.8679 3.5%
✅Tp: 0.8108 ; 0.7934 ; 0.7779 ; 0.7295
Leverage 10%
🔵up:0.87
🔵down : 0.72
🔴Amount: min
🟢Order difference: 0.05%
🟢Order sell: 0.5%
❗Open only with bot scm

Sell to GBPUSDyou can sell gbpusd if price tuch zone.so, please wait for tuch zone
sell 1.17380
Tp 1.16616
Sl 1.17887
R.R 1.5

TIME FOR A CORRECTION?Price has decided to rest while the stochastic and RSI have fallen off indicating some weakness. Not sure if price will completely change direction but it looks like the push is cooling off and we may be in for a short correction.
Hit that follow button to see more of my ideas, You may find a few solid trades!

EURAUD BEARISH FALL I posted this idea on the 18th Aug that i thought this was going to trend bearish before regaining its bullish power. As we can all see here its trended beautifully smashing right on our Take Profit level.
Euro continues to fall down without any sign of turning around. I still see some more bearish moves for some time.

What is the Best Price for Buying BTC? Does it Worth Buying?Since BTC is not an asset or any reliable currency there is nothing I can be sure of. But, with simple Elliott waves and Fibonacci numbers, we can see that 13K and 17K are the best prices for buying BTC. (BTCUSDT chart is saturated in the daily time frame as you see in the published chart)
The problem is how long you should hold your new BTC. Now, let's think with our simple logic.
As you know, interest rates are rising along with inflation in the world. So, high-risk markets including cryptocurrencies are definitely affected by these conditions. I personally think you should buy BTC in 17k with 15% of your investment money (cryptocurrency investment) and then buy 30% in 13k. If I were you I would hold my second buy until BTC reaches about 60k and sold the first buy on the highest point. (However, before selling, it is important to analyze the economy of that date whenever it wants to be)
With all of these things said, it is worth the risk but not more than 20% of your entire investment money on stocks, forex, and crypto.
If there is anything that you think you can add to my published post, please leave a comment.

Best Prices for Short Term Long Position for Gold SpotI personally think the prices given in the chart can be potential points for a retracement.
Here are the reasons:
The downtrend wave is going for its third motive wave which can continue to the 3 prices given in the chart.
Fibonacci channel and retracement showed that the 3 prices are the primary potential points for a long position.
As you see, the demand zones match Fibonacci numbers.
NOTE: It is recommended to exit your trade as soon as the price gives it pullback. Additionally, it is better to check momentum in H1 and M15 timeframes to see if the price is saturated or not.
Although technical analysis gives us perfect positions for getting a profitable long on XAUUSD, fundamentals are a bit unstable (interest rate of USA: 2.5%) and the price may go down more than we have predicted. So, it is crucial to have a reasonable risk-reward ratio (1:3 is recommended) equivalent to your trade volume, leverage, and account.
Now tell me, which price is the best from your perspective?
OANDA:XAUUSD

GoldViewFX - Market UPDATEHey Everyone,
As you can see this chart is playing out, we started early with the Bullish targets but now seeing price come into the retracement range. Hoping to see price find support in the retracement area and resume with the Bullish targets. Failure to hold at this retracement zone and we will see price test the full swing range.
As highlighted already we have identified the 4h chart range of 1743 - 1707 - these two levels are holding the current range; break and lock above or below will confirm momentum for the next few Goldturns targets.
BULLISH TARGETS
1733 DONE
1743
1752
1760
1769
BEARISH TARGETS
1723 DONE
1714 DONE
1707
SWING RANGE
1679
Our plans to buy dips, as a long term strategy is still in play, as always we will keep you all updated with any changes to our plans throughout. Please don't forget to like, comment and follow to support us, we really appreciate it!
GoldViewFX
XAUUSD TOP AUTHOR

GBPJPY---BUYYou can enter the purchase deal by confirming the candle. Be sure to set a loss limit. Do not enter more than 1.5% of the transaction. in a downward trend


XUAUST——— BuySignal gold best
The best area to buy is to enter with a confirmation candle, if the red line breaks you can think of selling
Blue = Buy
Red =SL
Green = TP
Tnks

USDCAD ——sellBlue color entry price
Red color loss limit -SL
Green color-TP--Manage and close yourself
1% of the SIZE of the total Balance..
All signals must be candle verified. Trade. No
credit without approval

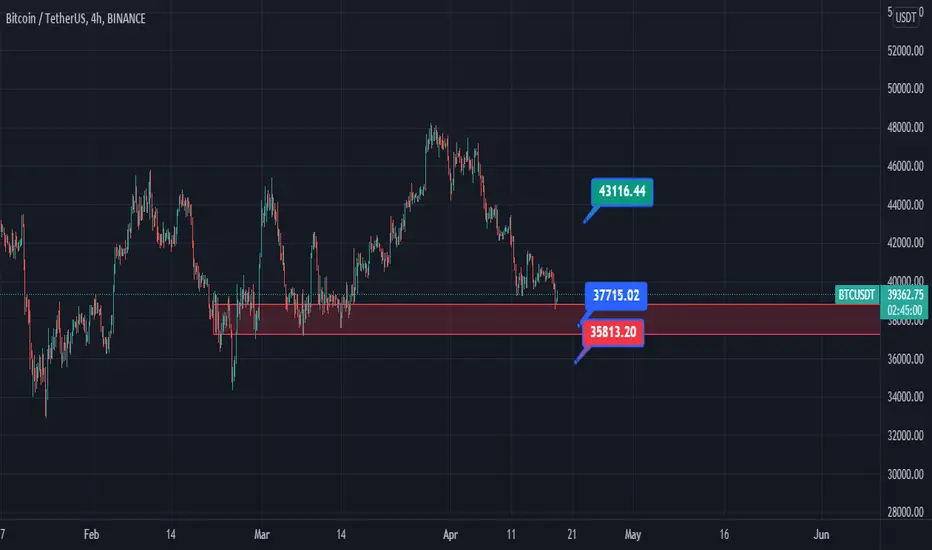
BTCUSDT----BUY Blue color entry price
Red color loss limit -SL
Green color-TP-Manage and close yourself
1% of the SIZE of the total Balance..
All signals must be candle verified. Trade. No credit without approval
GBPUSD----BUYBlue color entry price
Red color loss limit -SL
Green color-TP
1% of the SIZE of the total Balance..
All signals must be candle verified. Trade. No credit without approval

AUDUSD --------SELL Candle confirmation must appear if it does not appear is incorrect
Blue color entry price (Candle confirmation must appear if it does not appear is incorrect )
Red color :SL
Green color : TP
1% of the SIZE of the total Balance

EURAUDEURAUD setting up for a bearish opportunity. Watch lower time frame for bearish price action, there could be opportunities for further sells.

NZD/USD Long I will be taking a long position of NZD/USD on Monday, Everything checks looks great, Will be risking 1-2%


BTC/USDTHello everyone, if you like the idea, do not forget to support with a like and follow.
13x 😉
OPEN : 36481
SHORT :
T1 : 33389 %110
T2 : 32708 %134
T3 : 32268 %150
LONG :
T2 : 39659 %113
T2 : 40341 %137

DOGEUSDTFor past few days, DoGe keep trading inside the range and the volume keep moving.
I believe it's preparing for a good breakout of the range for a trend soon.
You can get some and add to your portfolio to sell for 10% ,20% and 30% profit as soon as the market balance up.
Not a financial advice
Please do your own research before trading

gold time frame 2Hfrom last analysis.
Gold touched level 50% Fibonacci and create double top pattern.
News will be published at 5:00 PM.

buy in gbpusdbuy at prz level and deep of up trend.
we can risk5% of our balance,all of markets have own risks and we should manage our risks dependsd on our balance

