Bestsignals


GBPJPY - The bulls are in control eyeing more gainsTrend Analysis: The GBPJPY currency pair on the 4 hours chart has been in an uptrend since 04 February 2020 when it registered the lowest price level of the period under study at 140.910. Since then, the currency pair has been successfully forming higher tops and higher bottoms. At time of writing, the GBPJPY is moving around 143.245 above the 20-period and 40-period simple moving average respectively. This reveals the buyers’ determination to pull the exchange rate of GBPJPY to higher levels.
Additionally, the oscillator analysis indicates positive sentiment for the GBPJPY. The 14 period RSI Oscillator (Relative Strength Index) is above the 50 level - a fact that shows that the buyers are in control of the market. The 23 period Momentum Oscillator is also above the 100 mark, which illustrates bullish movement in the currency pair.
When attaching the Fibonacci Retracement tool from the top at 142.877 and dragging it to the bottom at 142.133, three price targets may be calculated. The first target level is projected at 143.337 (161.8%), which has been successfully reached. The second target level is estimated at 144.081 (261.8%). The third target level is forecasted at 145.285 (423.6.8%).
It remains to be seen how much lower the bears will manage to push the price of the GBPJPY.

GBPAUD - is surging to higher levelsTrend Analysis: The GBPAUD currency pair on the 4 hours chart has been in an uptrend since 23 December 2019 when it registered the lowest price level of the period under study at 1.86504. Since then, the currency pair has been successfully forming higher tops and higher bottoms. At time of writing, the GBPAUD is moving around 1.94164 below the 20-period and 40-period simple moving average respectively. This reveals the buyers’ determination to pull the exchange rate of GBPAUD to higher levels.
Additionally, the oscillator analysis indicates positive sentiment for the GBPAUD. The 14 period RSI Oscillator (Relative Strength Index) is above the 50 level - a fact that shows that the buyers are in control of the market. The 23 period Momentum Oscillator is also above the 100 mark, which illustrates bullish movement in the currency pair.
When attaching the Fibonacci Retracement tool from the top at 1.93149 and dragging it to the bottom at 1.92372, three price targets may be calculated. The first target level is projected at 1.93629 (161.8%), which has been successfully reached. The second target level is estimated at 1.94406 (261.8%). The third target level is forecasted at 1.95663 (423.6.8%).
It remains to be seen how much lower the bears will manage to push the price of the GBPAUD.

EURCHF - Bears are pushing the price lowerTrend Analysis: The EURCHF currency pair on the 4 hours chart has been in a downtrend since 13 December 2019 when it registered the highest price level of the period under study at 1.10317. Since then, the currency pair has been successfully forming lower bottoms and lower tops. At time of writing, the EURCHF is moving around 1.06239 below the 20-period and 40-period simple moving average respectively. This reveals the sellers’ determination to push the exchange rate of EURCHF to lower levels.
Additionally, the oscillator analysis indicates negative sentiment for the EURCHF. The 14 period RSI Oscillator (Relative Strength Index) is below the 50 level - a fact that shows that the sellers are in control of the market. The 23 period Momentum Oscillator is also below the 100 mark, which illustrates bearish movement in the currency pair.
When attaching the Fibonacci Retracement tool from the bottom at 1.06582 and dragging it to the top at 1.06787, three price targets may be calculated. The first target level is projected at 1.06455 (161.8%), which has been successfully reached. The second target level is estimated at 1.06250 (261.8%), which has been achieved. The third target level is forecasted at 1.05919 (423.6.8%).
It remains to be seen how much lower the bears will manage to push the price of the EURCHF.

EURJPY is set to test lower pricesTrend Analysis: The EURJPY currency pair on the 4 hours chart has been in a downtrend since 07 January 2020 when it registered the highest price level of the period under study at 122.872. Since then, the currency pair has been successfully forming lower bottoms and lower tops. At time of writing, the EURJPY is moving around 119.911 below the 20-period and 40-period simple moving average respectively. This reveals the buyers’ determination to push the exchange rate of EURJPY to lower levels.
Additionally, the oscillator analysis indicates negative sentiment for the EURJPY. The 14 period RSI Oscillator (Relative Strength Index) is below the 50 level - a fact that shows that the sellers are in control of the market. The 23 period Momentum Oscillator is also below the 100 mark, which illustrates bearish movement in the currency pair.
When attaching the Fibonacci Retracement tool from the bottom at 119.972 and dragging it to the top at 120.337, three price targets may be calculated. The first target level is projected at 119.746 (161.8%), which has been successfully reached. The second target level is estimated at 119.381 (261.8%). The third target level is forecasted at 118.791 (423.6.8%).
It remains to be seen how much lower the bears will manage to push the price of the EURJPY.

GBPJPY: #POUNDITSince mid-October the GBPound has been gaining momentum against the JapenseYuan. Reaching a recent high of 147.900, the price point immediately reverted to retest the previous channel's top trend line near 141.500 (shown in orange). After a showing of strong support, the price point returned to its longstanding uptrend which started August 11th 2019 (shown in green). Currently sitting on the 50EMA (25 day average) and the bottom of the longstanding trend line, I expect this price point to continue rising and eventually retest the 147.900 mark. Trend direction's obviously changing because we're sitting above the 200EMA now. I wonder if its finally headed back toward the highs of August 2015 (194.510).

EURJPY 1H Long buy Structure Long Buy Structure
From : 119.373 - 119.450
TP1 : 119.885
TP2 : 120.200
Stop Loss : 119.130
This is not an investment recommendation or any call to buy or sell
It is just an analysis based on a study of the history of price action
Behavior , that may not be a necessarily reason for the success of
the structure or repetition. So please make your decision based on your vision .
To protect capital and manage your deals and trading successfully
the maximum loss in each transaction for the same currency or
commodity in the same direction should not exceed ( 2% ) of the capital .
Good luck >>


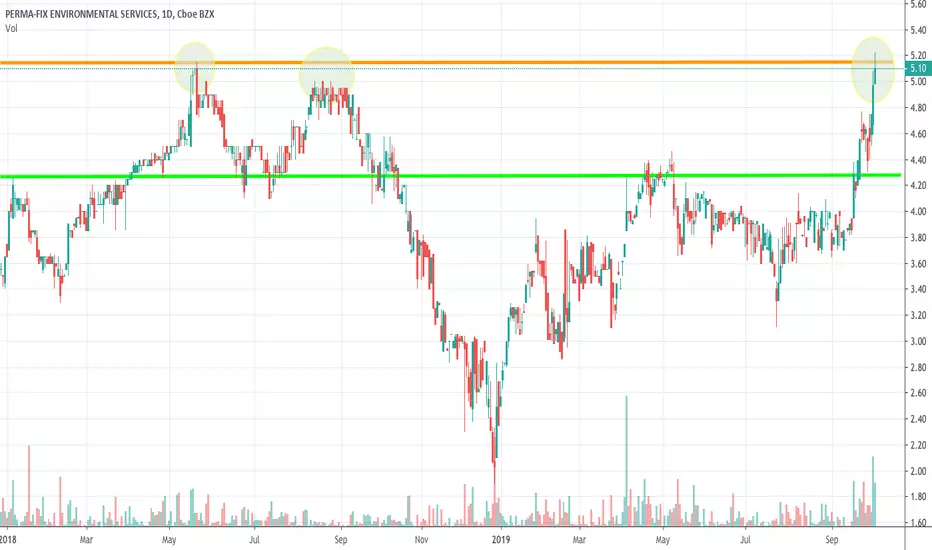
$PESI Trying But Can It Put In A True New Level Of Support?Volume has been up ticking, price is on the rise , but it looks like PESI is around an area of resistance that it has seen twice in the last 21 months. Wondering if it can firmly lift and establish new support above this level.
" Back on September 24, the company announced that it had reached an agreement to work on nuclear service projects. More importantly, those projects could help this penny stock earn as much as $15 million over the course of the next 18 months. The development resulted in a significant rally in PESI stock. Over the last two weeks, the stock has gained as much as 30% as investors piled into it. "*
About PESI
Perma-Fix Environmental Services Inc is a provider of both nuclear services and the management of nuclear and mixed waste. The company operates through three segments: Treatment segment offers nuclear, low-level radioactive, Mixed, hazardous and non-hazardous waste treatment, processing and disposal services. Service segment provides on-site waste management services to commercial and government customers, technical services and nuclear services The Medical segment is involved in the research and development of medical isotope production technology.
SOURCE: Are Penny Stocks Worth It? 3 Up Big In October
cad/jpy bearish trade setupCADJPY, bearish divergence formed for selling. price testing monthly resistance area march 2019 84.00-84.10. suspect fall reason seasonal strength expected in jpy pairs soon.

Strong Pullback then UpPossible strong pullback towards the trend line for AUDNZD. Price has broken trend line channel to the upside and now would be a good time to place a sell trade on the pullback to the trend line. Price has also been moving under both the 200 and 50 EMA which is still indicating a strong short bias. I expect the price to move back to the trend line and then go all the way up. The first target will be the first support turned resistance. FX:AUDNZD
Will be holding until next week as it is Friday tomorrow.

BTC-Usd No trade for the time beingWould not be surprised if we see a rally towards 6580. We are still waiting to pull the trigger on long term trades. Need more structure to work with!
------------------------------------------------------------------
MEGALODON PRO
Megalodon Pro is designed for longer term investors.
Megalodon Pro is really simple to use.
Megalodon Pro combines the 16 different back-tested indicators , that each have more than 66% win rate .
Megalodon Pro works with any kind of market state, and any kind of asset.
Megalodon Pro can be used to set alarms as soon as a candle closes with an green or red arrow.
Megalodon Pro has more features than any other indicator in the market, these features can also be turned off in the settings :
Looks for 12 different investing setups automatically and prints them out.
Finds and prints longer term and shorter term Fibonacci Retracemen t levels.
Prints Long Fibonacci levels or the Short Fibonacci levels.
Finds and prints a custom Fibonacci level that you might want.
Shows overlapping Fibonacci levels for longer term and shorter term.
Overlays Bollinger Bands.
--------------------------------------
theMegalodon is designed for longer term investors!
All you have to do is:
1- Apply it on any asset with 1D time frame .
2- Look for green arrow confirmation.
3- Obey to your stop losses if you prefer to have.
4- Define your target before you enter.
5-Repeat
--------------------------------------
UncleBoMadeIt
Enlighten others

The Simplest and Most Accurate Indicator in the Market By FarHey fellows,
We have got another double over night on BCY
We have been getting doubles for the last 3 days in a row now.
We have worked really hard to bring you the best indicators on Tradingview.
--------------------------------------
THEMEGALODON
theMegalodon looks for the institutional finger prints, the whales or the big boys.
theMegalodon is really simple to use.
theMegalodon combines the 8 different unique indicators, that each have almost perfect success rate.
theMegalodon works with any kind of market state, any kind of trading, and any kind of asset.
theMegalodon has more features than any other indicator in the market: Out of 9 working indicators, we have 3 momentum, 3 price and 3 volume indicators showing you the best signals.
--------------------------------------
theMegalodon is designed for us, the small fishes in the ocean, the millennials, the college students. This will basically makes us the new Megalodons(whale hunters).
All you have to do is:
1- Look for green or red arrows.
2- Look for orange or red candles.
3- Repeat
--------------------------------------
iPyra
Enlighten others


