BTCUSDTHello Traders! 👋
What are your thoughts on BITCOIN?
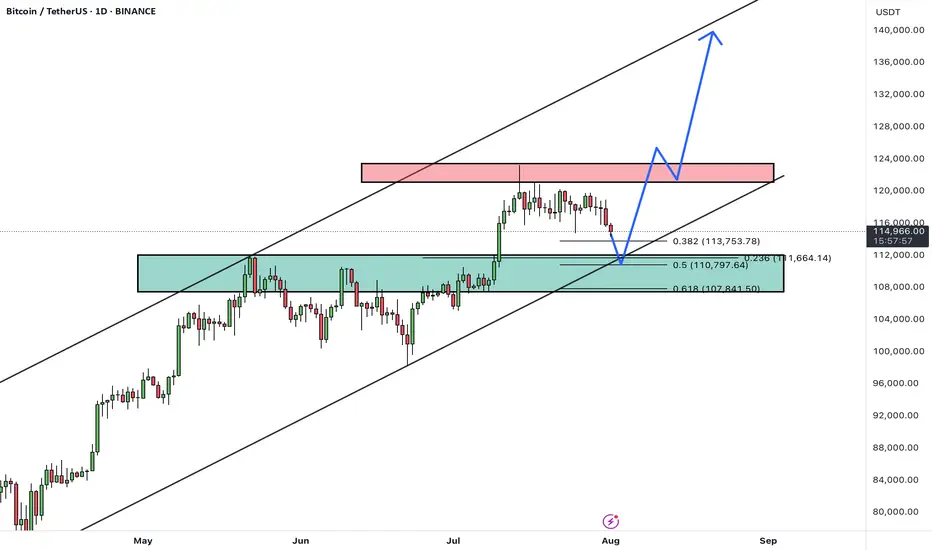
After a strong rally, BTC is currently pulling back from the 124K resistance area, heading toward a major confluence support zone between 108,000– 110,000, which aligns with:
✅ Previous breakout zone
✅ 0.5–0.618 Fibonacci retracement
✅ Lower bound of the ascending channel
This level is expected to attract buyers and act as a base for a new bullish leg.
Scenario Ahead (Main Bias):
1. Price dips into the 108–110K support
2. Bullish reversal from the zone (watch for strong reaction candles or bullish divergence)
3. Target 1: 124K (retest resistance)
4. Target 2: 135K–140K (upper channel boundary upon breakout)
BTC remains in a healthy bullish structure. Current pullback is considered constructive, and the 107–110K zone offers a high-probability long setup. Watch for bullish signals before entering.
A confirmed daily close below 107K would invalidate this bullish structure and expose BTC to deeper correction levels.
What’s your take on this setup? Do you expect a bounce from support or a deeper correction? Share your thoughts below 👇
Don’t forget to like and share your thoughts in the comments! ❤️
Beyond Technical Analysis
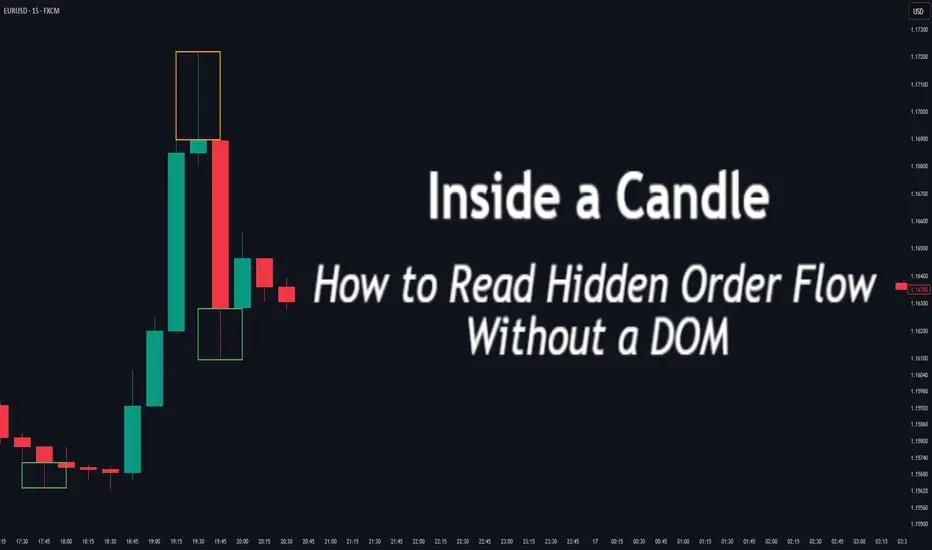
Inside a Candle: How to Read Hidden Order Flow Without a DOM
Difficulty: 🐳🐳🐳🐋🐋 (Intermediate+)
This article is for traders who want to understand the “story” behind a candle’s shape — and learn to spot aggressive buying/selling, absorption, and traps without needing footprint or order book tools.
🔵 INTRODUCTION
Most traders see candles as static shapes — green or red, big or small. But each candle is a battlefield of orders . Even without access to a DOM or volume footprint, you can still extract valuable information from just the candle's body, wick, and context .
🔵 ORIGINS: WHERE CANDLESTICKS COME FROM
Candlestick charts trace back to 18th-century Japan, where rice traders needed a way to visualize price movements over time. A legendary trader named Munehisa Homma , who traded rice futures in Osaka, is credited with developing the earliest form of candlestick analysis.
Homma discovered that price wasn’t just driven by supply and demand — but also by trader psychology . He created visual representations of market sentiment by tracking:
The opening and closing price of rice
The highest and lowest price reached during the session
This system became known as the “Sakata rules,” and it laid the foundation for many patterns still used today — such as Doji, Engulfing, and Marubozu.
Western traders only began using candlesticks widely in the 1990s, when analyst Steve Nison introduced them to the broader financial world through his book Japanese Candlestick Charting Techniques.
Today, candlesticks remain one of the most powerful and intuitive ways to visualize order flow, momentum, and market psychology — even without a Depth of Market (DOM) or depth of book.
In this article, you’ll learn how to read hidden order flow by analyzing:
Wick length and positioning
Body-to-range ratios
Candle clustering and sequences
🔵 HOW A CANDLE FORMS
Before you can read a candle, you need to understand how it comes to life . A single candle represents the full auction process during its time window.
Here’s how it builds, step by step:
Candle opens — this is the open price .
As price moves up during the session → the high] updates.
As price moves down → the low] updates.
The final traded price when the time closes → this becomes the close price .
The wick = price areas that were tested but rejected
The body = where the majority of aggressive trades occurred
If buyers push price up quickly but sellers slam it down before the close — the candle will have a long upper wick and close near the open, revealing seller absorption.
Understanding this flow helps you recognize traps, fakeouts, and reversals in real time.
🔵 CANDLE BODY: WHO'S IN CONTROL
The body of the candle reflects the result of the battle between buyers and sellers. A wide body with minimal wicks means dominance and commitment.
Big body, small wick → clear conviction
In an uptrend: buyer aggression
In a downtrend: panic or aggressive selling
Small body, long wicks → indecision, absorption, or trap
Often appears near tops/bottoms
Indicates both sides were active but neither won clearly
www.tradingview.com
🔵 WICKS: THE SHADOWS OF REJECTION
Wicks are not just “leftovers” — they show where price was rejected after being tested.
Long upper wick = seller presence or absorption at highs
Long lower wick = buyer defense or trap spring
Double wick = liquidity sweep / false breakout
Use wick direction to spot:
Failed breakouts
Smart money traps
Exhaustion candles
🔵 HIDDEN ORDER FLOW PATTERNS
1️⃣ Absorption Candle
A large wick with little movement afterward — shows that big orders absorbed market pressure.
2️⃣ Trap Candle
A candle that sweeps above/below a key high/low and closes opposite — classic smart money fakeout.
3️⃣ Imbalance Candle
Large-bodied candle that closes near the high/low with no wick on the other end — implies one-sided aggression (and often leaves an imbalance).
🔵 CLUSTERING & SEQUENCES MATTER
Never read a candle alone. The sequence of candles tells the full story:
3+ rejection wicks near resistance? Liquidity building before breakout or trap
Bearish engulfing after long upper wick = smart money selling into retail buying
Tight-range dojis + volume spike = compression before expansion
Context + volume + structure = hidden flow decoded.
🔵 PUTTING IT TOGETHER: A REAL EXAMPLE
Price breaks above previous high
Candle closes with long upper wick and smaller body
Next candle opens, dumps fast, leaving imbalance behind
Buyers trapped — move likely to continue down
This is how you read order flow from candle anatomy .
🔵 TIPS FOR MASTERY
Use a lower timeframe (1M–5M) to see microstructure
Watch how wicks behave near S/R or OBs
Confirm with volume spikes or delta-style indicators
Use replay mode to slow down the story and study cause/effect
🔵 CONCLUSION
Every candle is a message. You don’t need expensive tools to read order flow — just your eyes, context, and curiosity.
Learn to see candles not as symbols, but as evidence of behavior . Absorption, imbalance, and traps are all visible if you look closely.
USDCHFHello Traders! 👋
What are your thoughts on USDCHF?
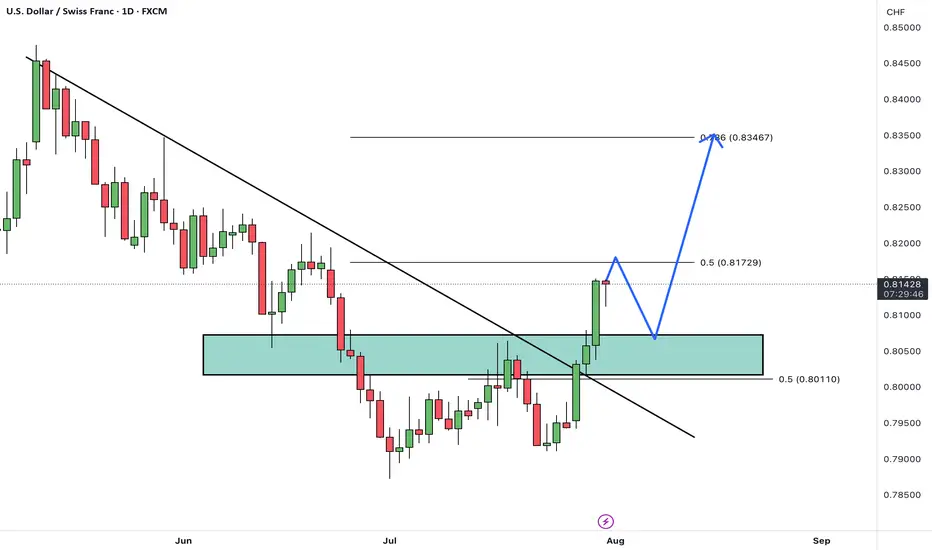
USD/CHF has broken above its descending trendline and cleared a resistance zone, signaling a potential trend reversal and growing bullish momentum.
After some minor consolidation and a pullback to the breakout zone, we expect the pair to continue its rally toward the next identified targets.
The broken resistance now acts as new support, and as long as price remains above this area, the bullish outlook remains valid.
Is USD/CHF ready to extend higher toward its next targets? Share your view below! 🤔👇
Don’t forget to like and share your thoughts in the comments! ❤️
Bitcoin stop loss hunting end, entry for Long is now!!Hi on this chart that may happen with more than 70% possibility we have one of the easy setups and strategy which i call it FAKEOUT&LIQUIDTY this happen usually near trendline support or range zone support or even resistance and after a possible fakeout usually market kick sellers or Buyers and then with high volume market reverse.
I saw High volume and Fake breakout in my mind and i think it can be one of those times so we open long and lets now wait for this 1:2(Risk:Reward) signal to play.
DISCLAIMER: ((trade based on your own decision))
<<press like👍 if you enjoy💚

S&P 500 Obeying Elliott Wave TheoryThis is an update of a previous publication. A Flat occurred for Wave 2(Green) and if Wave 3 is over, we can expect a Zigzag for Wave 4. Zigzags have 3 waves. A confirmation at its current location will trigger a sell for Wave 4(Green).
For more information on the same, go to:

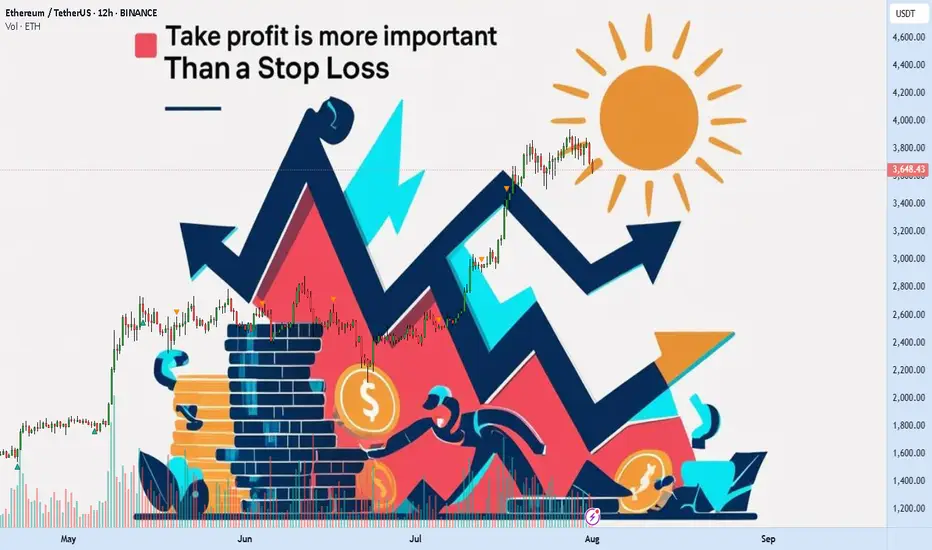
Take profit is more important than a stop lossAre you actually in profit, or just delaying your next loss?
How many times have you watched your gains vanish because you wanted more?
Maybe it's time to stop fearing losses and start planning exits.
Hello✌️
Spend 3 minutes ⏰ reading this educational material.
💸 Why Most Traders Lose Profits They Already Had
Most traders obsess over stop losses but never define where they'll take profits. Imagine entering a great trade, watching the price go up, then suddenly it pulls back and you're out with nothing. That happens because you didn’t define your win.
A well-placed take profit acts like a contract with your future self. It secures your gain before the market decides otherwise.
📉 No Take Profit? Say Hello to Unnecessary Losses
Failing to set a take profit is basically handing the market a free ticket to reverse your gains. Especially in the highly volatile crypto space, a missed exit often turns into a regretful stop out. So while everyone is talking about stop losses, you should focus on where the money is actually made.
🧮 A Clear Profit Target Creates a Clear Mind
Having a defined profit target gives your mind a place to rest. It brings structure and removes hesitation. This peace of mind is something new traders lack, which often leads them to close early or hold too long.
🧠 Greed Is the Real Enemy of Your Gains
Greed whispers "Wait, it might go higher"
But when you don't have a take profit plan, that whisper becomes your worst advisor. Pro traders map their exits before entering, while amateurs dream of riding forever.
🛡 True Capital Protection Begins with Profit Protection
If you're aiming for safe capital in crypto, it's not just about minimizing losses. It's about securing wins. Beginners often build their whole plan around stop loss. But advanced traders fear losing profits more than they fear taking a hit.
🎯 Take Profit Is Your Emergency Exit Plan
Setting a profit target is like having an escape route during a fire. Without it, you’ll panic when things turn. Crypto markets are full of pump traps. Your profit is only real when you actually take it.
🚪 Exit Strategy Matters More Than Entry
Everyone talks about entries, but it's your exit that defines whether your trade ends in green or red. Many traders nail the perfect entry but without a clear exit plan, they hand back their profits. Prioritizing your take profit is not optional. It’s essential.
🔁 Managing Gains Is Managing Emotions
Without a defined exit, every candle can shake your decision-making. But when your take profit is set in advance, emotions can’t hijack your strategy. You’re following a plan, not a feeling.
📊 TradingView Tools to Manage Take Profits Effectively
In the world of trading, the right tool means the right decision. TradingView offers powerful tools that help you manage not just your stop loss but more importantly, your take profit targets. With tools like Price Range and Long/Short Position, you can easily visualize where you entered and where you need to exit before greed pulls you deeper.
The Fibonacci Extension tool is especially valuable during bullish runs. It allows you to map out realistic and strategic profit levels like TP1, TP2, and TP3. These targets can then be paired with horizontal lines or alerts within TradingView’s chart system.
Even if you're using a free TradingView account, a simple custom Pine Script can help set alerts when your percentage targets are hit so you can scale out or lock in profits instead of emotionally reacting to price movement.
Using these tools practically empowers traders to build real-world strategies and take control of their exits, not just their entries. That’s the real edge.
📌 Final Takeaway
A clear, well-placed take profit protects both your money and your mind. Don’t let your wins dissolve into losses. With the right tools and the right mindset, you don’t just survive the market, you beat it. Start managing your profits today, not just your losses.
✨ Need a little love!
We pour love into every post your support keeps us inspired! 💛 Don’t be shy, we’d love to hear from you on comments. Big thanks , Mad Whale 🐋
📜Please make sure to do your own research before investing, and review the disclaimer provided at the end of each post.
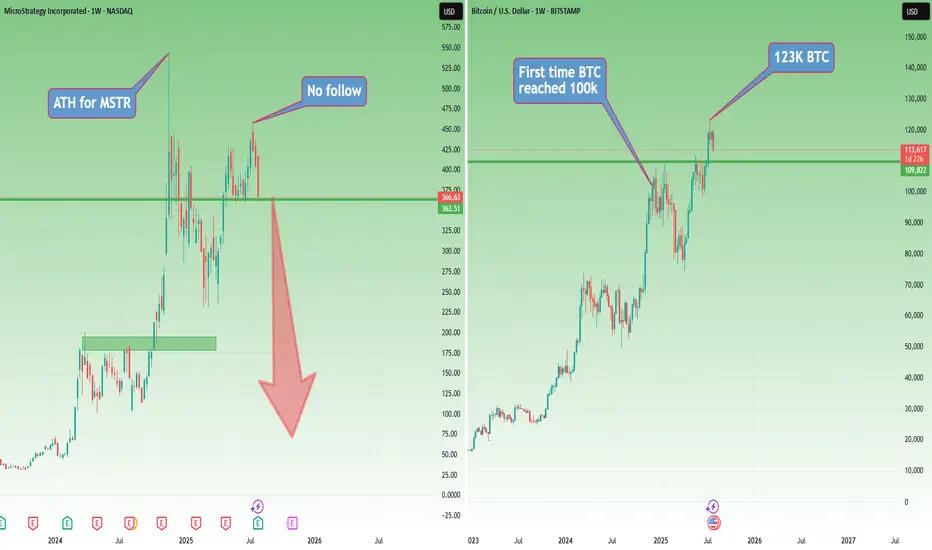
Why Pay $250K for a $115K Bitcoin? Welcome to Strategy (MSTR)This is already the third article I’ve written about Strategy (formerly MicroStrategy), and for good reason.
You don’t need to be a financial expert to ask: why buy a stock that simply mirrors Bitcoin’s price — but at a massive premium?
No matter how sophisticated the explanations may sound, or how many times you’re told that “if you don’t understand it, it must be brilliant,” the reality is much simpler — and much more absurd.
Buying Strategy today is like paying $250,000 for Bitcoin while the actual market price is $115,000.
It’s not about complexity. It’s about common sense.
I won’t dive too deep into it — no need to fight “financial sophistication” with even more sophisticated words.
The point is simple: buying Strategy is like paying me $10,000 just so I can hold your $10,000 and call it an “innovative capital deployment strategy.”
Sounds smart, right? Until you think about it for more than five seconds.
Now let’s look at the posted charts — simple and visual.
Strategy (MSTR) hit its all-time high in November 2024, right when Bitcoin first reached $100,000.
Then came a sharp correction of more than 50% for the stock.
Fast forward: even though Bitcoin went on to make new all-time highs, Strategy didn’t follow, it seems like people were finally starting to wake up.
When BTC peaked again in mid-July 2025, Strategy only managed to reach $455 — well below its November ATH.
Since then, BTC has pulled back about 10%, while Strategy dropped around 20%.
So much for the “outperformance” argument.
And here’s where things get even harder to justify:
In the past, some institutions bought MicroStrategy because they couldn’t hold Bitcoin directly. Fair enough.
But now? Spot Bitcoin ETFs are live, regulated, widely available, and charge tiny fees — without the leverage, dilution risk, or premium baked into Strategy.
So what’s the excuse now?
Where are we now?
At this moment, even though I’m not too happy about this week’s Bitcoin weakness, I remain cautiously bullish — emphasis on cautiously.
But let’s entertain a scenario.
If Bitcoin continues to correct, Strategy is sitting right on support. And if BTC breaks lower, Strategy will almost certainly follow — breaking support and heading toward the next level.
That next support? Somewhere around $240–250, depending on how deep the Bitcoin pullback goes.
But here’s the real question:
What happens if Bitcoin enters a true bear market?
Will Strategy — which just recently rebranded from MicroStrategy — be forced to rebrand again as…
NanoStrategy?
Just a Saturday thought.
GBPUSD shows signs of a potential recoveryGBPUSD shows signs of a potential recovery towards the resistance zone. This price action indicates a possible short-term reversal or consolidation phase. We are currently observing for confirmation signals such as:
These could signal a build-up for a move back toward the key resistance at 1.34400. Traders should stay alert for price behaviour near this level as it may act as a turning point or breakout trigger.
You may find more details in the chart.
Trade wisely best of luck buddies.
Ps: Support with like and comments like for better analysis.


ETHUSD Break- Test- GO!!! Nothing Changed! 3rd EditionI have been warning about this for some time. Please visit my previous two posts for more info and updates.
Magic!
Click boost, follow, and subscribe for more. Let's get to 5,000 followers ))

BTCUSD 8/1/2025Come Tap into the mind of SnipeGoat as he gives you a Full Top-Down Analysis of Bitcoins Price Action as we come into the month of August. What is Price doing? Where is Price going? Come get the answer here!
_SnipeGoat_
_TheeCandleReadingGURU_
#PriceAction #MarketStructure #TechnicalAnalysis #Bearish #Bullish #Bitcoin #Crypto #BTCUSD #Forex #NakedChartReader #ZEROindicators #PreciseLevels #ProperTiming #PerfectDirection #ScalpingTrader #IntradayTrader #DayTrader #SwingTrader #PositionalTrader #HighLevelTrader #MambaMentality #GodMode #UltraInstinct #TheeBibleStrategy

Fakeout before huge breakout in EURUSD#EURUSD Fakeout before huge candle breakout.
Just a learning experience how fakeouts are very frequent on forex and crypto market

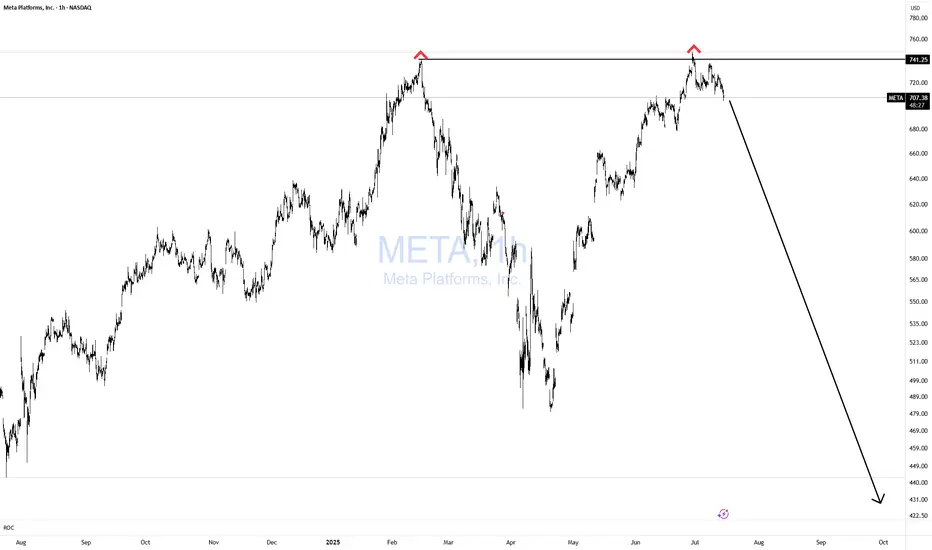
META Double Topping!Does it get any easier than this? NOPE!
If you can't spot this pattern from 1000 miles away, then you need a lot more time in the seat, training yourself in TA.
Simple with great risk reward!
Bulls GTFO!
ETH Approaching Major Resistance – Expecting Pullback Hello guys!
Ethereum has been rallying strongly within a well-respected ascending channel, pushing past key levels and now approaching a major resistance zone around $3,900–$4,000.
According to the chart structure, it looks like price could soon react from this resistance, leading to a pullback into the $3,000–$3,200 demand zone, which aligns with the midline of the channel.
This would be a healthy correction before potentially continuing the bullish trend and attempting a clean breakout toward new highs.
ETH is still bullish, but it may need to retest support before continuation.
Watch for a bounce from the $3,000–$3,200 zone for a high-probability long opportunity.

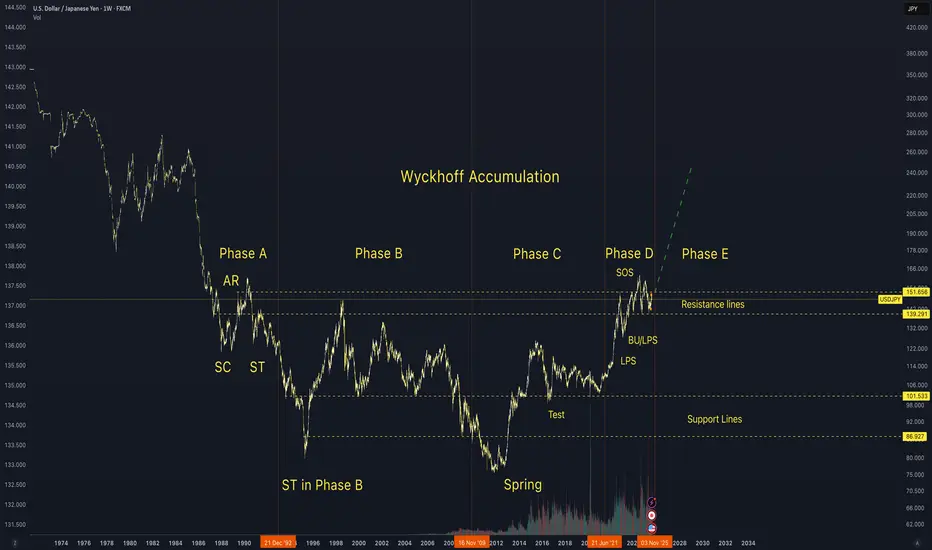
USD/JPY Wyckhoff Accumulation on weekly Chart Looks like a fairly textbook Wyckhoff accumulation on the USD/JPY Pair and looking ready to move up and to the right soon.
Third Quarter 2025 Nigerian share picks Update....Percentage Up!Here's a summary and update on the third quarter 2025 Nigeria stock picks based on the price comparison between July and August - 1month:
Q3 2025 Trading View: Nigerian Stock Picks Update
Strong Performers with Significant Gains:
BUACEMENT: Up 48%, showing strong momentum as a cement sector leader.
DANGSUGAR: Increased by nearly 37%, notable growth in the sugar sector.
ELLAHLAKES: Shares rose over 36%, a promising performer.
DANGCEM: Cement stock up about 20%, continuing solid growth.
ETRANZACT: Up 24%, showing steady improvement in the tech/payment sector.
MULTIVERSE: Grew by 24%, indicating healthy gains in diversified tech.
NB: +28.8%, good growth for the banking/finance sector.
Moderate or no Growth:
ARADEL: Small increase of about 1%, steady but minimal movement.
HMCALL: Stable with a minor 1.4% increase, remaining consistent.
TRANSPOWER: No price change, holding steady for now.
Overall Market Sentiment:
Average gain across all picks is approximately +22%, a strong positive trend overall.
Indicates a bullish sentiment on these carefully selected third-quarter stocks.
Opportunity exists to take advantage of higher momentum sectors like cement, sugar, and tech/payment companies.
Trading Takeaway:
The Q3 2025 picks demonstrate robust growth potential, especially in key sectors like construction materials and tech/payments. Conservative performers provide portfolio stability while high growth stocks offer upside. Continual monitoring for volume and market news is recommended to capitalize on gains and manage risks moving forward.

NF news, can gold selling pressure drop to 3240?⭐️GOLDEN INFORMATION:
Gold (XAU/USD) is trading lower, around $3,285 in early Asian hours on Friday, as a firmer U.S. dollar weighs on the non-yielding metal following new tariff measures announced by President Donald Trump.
The White House said late Thursday that Trump will set a 10% baseline tariff, stepping back from earlier speculation about hikes to 15% or higher, according to Bloomberg. He also signed an executive order raising the tariff on Canada from 25% to 35%, effective August 1, 2025, while extending Mexico’s current tariff rates for another 90 days to allow more time for negotiations.
⭐️Personal comments NOVA:
large frame, gold price is still moving in the downtrend line. will wait for NF result to have strong selling force again 3240
⭐️SET UP GOLD PRICE:
🔥SELL GOLD zone: 3374- 3376 SL 3381
TP1: $3365
TP2: $3350
TP3: $3333
🔥BUY GOLD zone: $3242-$3240 SL $3235
TP1: $3255
TP2: $3268
TP3: $3280
⭐️Technical analysis:
Based on technical indicators EMA 34, EMA89 and support resistance areas to set up a reasonable SELL order.
⭐️NOTE:
Note: Nova wishes traders to manage their capital well
- take the number of lots that match your capital
- Takeprofit equal to 4-6% of capital account
- Stoplose equal to 2-3% of capital account

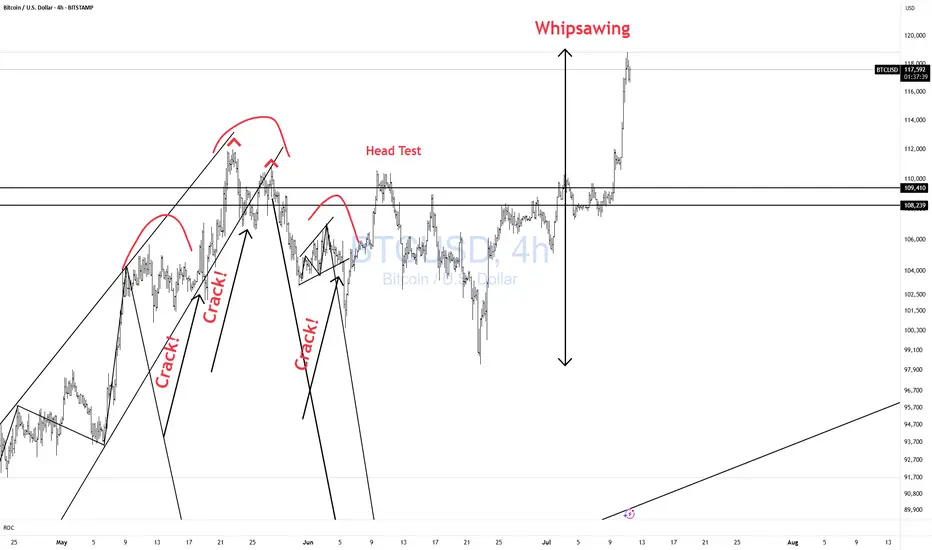
BTCUSD Whipsawing! CAUTION!Bulls CAUTION! Price is whipsawing all over the place.
Better to be out of the market wishing you were in than in wishing you were out!! Don't chase!!
EUR/USD Elliott Wave Count Signals Downside TargetsThe EUR/USD chart is displaying a completed 5-wave Elliott impulse structure, suggesting the potential start of a larger corrective move to the downside. Wave 5 appears to have finished after a classic ending diagonal pattern, with price now breaking below the wave 4 support trendline — a strong confirmation of trend exhaustion.
Currently, price is retracing upward towards the 0.5–0.618 Fibonacci retracement zone of the last impulsive leg, around 1.15912–1.16383, which may serve as the final rejection zone for bears to re-enter. This area aligns perfectly with prior support-turned-resistance and is considered the potential reversal pocket.
If price holds below the 1.17869 invalidation level, the structure supports the beginning of an ABC correction or a larger bearish impulse.
Target 1 (T1): 1.14800
Target 2 (T2): 1.13915
Stop Loss (SL): 1.17869
This scenario remains valid as long as the price does not break above 1.17869. A clean break and close above this level would invalidate the bearish setup and suggest a possible wave extension.

Simple Psychology Tips Using Volume for Better TradingMany newer traders assume that when someone says "psychology" in trading, they are referring to mindset.
It is also widely believed that trading is about the BEST entries.
Now, think of it this way. It is not about winning trades, it is actually about managing losses well to allow you to take the winners over and over again. You might think that a 3 to 1 risk-to-reward strategy is boring, you might have gone all in on your favourite crypto project. But what makes the difference between gambling and trading is actually very, very simple. So simple, in fact, many overlook it or simply ignore it.
Most seek a silver bullet - high win rates and perfectly timed entries, then they overleverage and move stops on the one "good trade" they are seeking to make.
Whilst doing this, they tend to overload the 6 monitors they have purchased to trade with a thousand indicators, which they don't really need.
The candlesticks tell a story, volume supports that story. When you learn any technique from Elliott Waves to Wyckoff, they all have a dependence on volume - even if the correlation is not apparent.
Look at this first image.
Price had moved down since the vertical line, the AD line also moved down - sell-off, in full swing. But then volume starts to shift before the AD line starts to increase.
Now, look at what happens next...
As we move forward and the new vertical line shows where volume spiked, the AD line starts to decrease as the price continues to rise.
This is enough of a story to start your analysis.
We then get a move with a lower high formed.
As this plays out, the sell-side volume rises, creating momentum for the short position.
Look a little closer and you will see, that the volume on the move up just before the drop was also decreasing. Making a divergence to price.
You might feel that the market is against you, or that the big players are single-handedly seeking your stops. But the truth is, the psychology in moves such as this one shown is where most retail traders either have greed that markets will only go up for ever or the fear that they are missing out on a market that only goes up forever.
It is that herd mentality that generates the liquidity for the professionals.
Losing 1% on a trade, is part of the process, risking 80%> on a single move will make you paper rich for about 10 minutes before the real losses set in.
This is where the psychology and the basic techniques such as risk management and understanding what candlesticks and volume bars are telling you, will make a world of difference to your results.
A/D line and volume are free on @TradingView and to be fair you don't need to overcomplicate it more than that!
Stay safe, have a great weekend all!!!
Disclaimer
This idea does not constitute as financial advice. It is for educational purposes only, our principal trader has over 25 years' experience in stocks, ETF's, and Forex. Hence each trade setup might have different hold times, entry or exit conditions, and will vary from the post/idea shared here. You can use the information from this post to make your own trading plan for the instrument discussed. Trading carries a risk; a high percentage of retail traders lose money. Please keep this in mind when entering any trade. Stay safe.
XAUUSD 4H AnalysisXauusd breaks the downward trendline and changes its direction toward important resistence levels 3369-3374. This zone is very important based on ichimoku, so we expect good reaction. after the reaction, the chart will be updated.
important support level is 3317.

EURUSD NOWWe've got EURUSD now waiting for a mitigation of the OB to take 15m high or maybe shorting until 1D low. but most probably we take long because of a weak body close that signals a weak power of sellers.

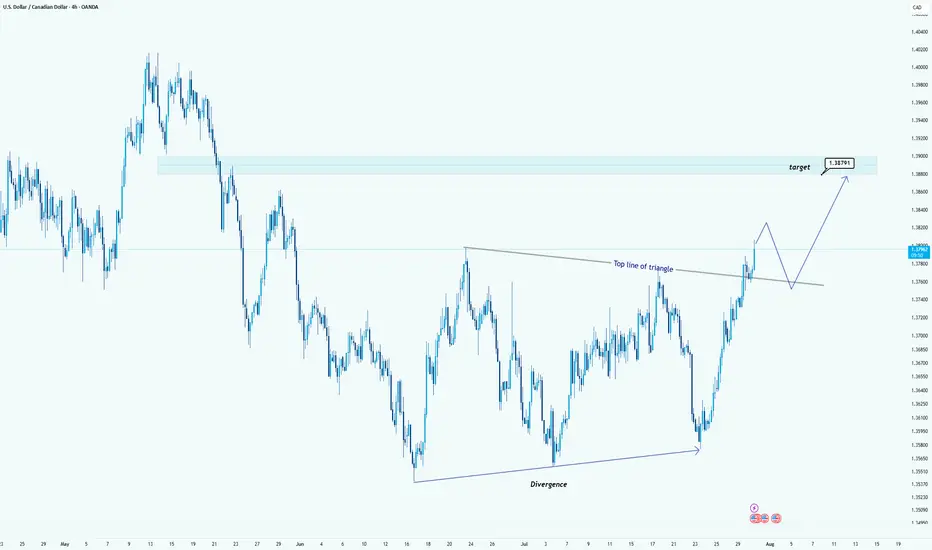
USD/CAD Breaks Triangle: Bullish Target in SightHello guys!
USD/CAD has broken out of a clear triangle formation, signaling strong bullish momentum. The breakout above the top line of the triangle, supported by earlier bullish divergence, confirms that buyers are now in control.
Triangle breakout confirmed
Strong bullish impulse post-breakout
Retest of the broken trendline expected
Target: 1.38791
A clean retest of the breakout level could provide another entry opportunity before price reaches the target zone highlighted in blue.