S&P 500 ETF & Index– Technicals Hint at a Possible Correction📉📊 S&P 500 ETF & Index at Resistance – Technicals Hint at a Possible Correction 🔍⚠️
Everything here is pure technicals— but sometimes, the market whispers loud and clear if you know how to listen. 🧠📐
The VOO ETF, which tracks the S&P 500 , has now reached the upper boundary of a long-term ascending channel, once again brushing against resistance near 590.85. This zone has consistently led to major pullbacks in the past.
On the right panel, the US500 Index mirrors this move—pushing toward all-time highs, right as broader sentiment turns euphoric. Technically, both charts are overextended and pressing into key zones.
👀 Potential Path:
🔻 Rejection from current zone ➝ Down toward 526.17, then 465.72 (green support channel)
🔁 Possible bounce after correction — trend still intact long term
And while we’re keeping it technical, it’s worth noting that the Buffett Indicator (Stocks-to-GDP) i s currently screaming “overvaluation.” This doesn't predict timing—but it adds macro context to an already overheated chart setup.
The lesson? Price respects structure. Whether or not the fundamentals are in agreement, the charts are warning that now may not be the time to chase.
History doesn’t repeat, but it often rhymes. Stay sharp, stay technical. 🎯
One Love,
The FX PROFESSOR 💙
ps. the beauty of these levels? Tight Stop loss- excellent R/R
Disclosure: I am happy to be part of the Trade Nation's Influencer program and receive a monthly fee for using their TradingView charts in my analysis. Awesome broker, where the trader really comes first! 🌟🤝📈
Beyond Technical Analysis

Opening - LYFT Aug 8th 15 Covered CallOpened for $13.40 debit.
Notes:
Sold the approx. 40 delta call against shares for an earnings play to take advantage of vol crush. Best case stock moves higher and we can close out at max profit. Should it move against us then we continue rolling the call out and down.
Mostly I trade option strategies that are essentially theta positive and short volatility. But I have never really played around with covered call strategies or letting positions getting assigned on the put side. With the preference to roll out & up/down vs. allowing a position to get assigned. So I am experimenting by just outright getting into a covered call position to experience what it is like to manage an assigned put position with short calls.
Trade Data:
Cost Basis: 13.40
Max ROC: 11.94%
Position Net Delta: Approx. .60 long delta

Gold Price Outlook: Bearish Trend DevelopingGold has broken below key top resistance, indicating potential for continued downside movement.
The US Dollar's recent rise has slowed amid renewed concerns about the US-China trade truce and profit-taking ahead of this week’s key employment data, following already strong GDP and ADP reports. While the dollar remains supported overall, uncertainty is capping its momentum, indirectly adding short-term volatility to gold.
The price action suggests a bearish breakout from key resistance zones. Momentum is building toward the downside, indicating the market could continue lower unless strong support levels hold. A potential bearish flag or breakdown structure is forming, and if confirmed, we may see a decline toward next support zones.
📍 Key Levels to Watch:
Resistance: 3310 / 3320
Support: 3269 / 3240
If gold remains below the broken resistance and fails to reclaim 3320, the bearish pressure is likely to continue. Watch upcoming employment data as it could add volatility and confirm the direction.
You may find more details in the chart.
Ps: Support with like and comments for better analysis Thanks.


EUR_CHF WILL KEEP FALLING|SHORT|
✅EUR_CHF broke the key
Structure level of 0.9295
While trading in an local downtrend
Which makes me bearish
And I think that after the retest of the
Broken level is complete
A rebound and bearish
Continuation will follow
SHORT🔥
✅Like and subscribe to never miss a new idea!✅
Disclosure: I am part of Trade Nation's Influencer program and receive a monthly fee for using their TradingView charts in my analysis.

EUR/GBP Thief Trade: Swipe Profits Before Overbought Trap!🦹♂️ EUR/GBP "THE CHUNNEL HEIST" – BULLISH LOOT IN PROGRESS! 🚨💰
(Thief Trading Strategy – Escape Before the Cops Arrive!)
🎯 DEAR MARKET PIRATES & PROFIT SNATCHERS,
Based on our 🔥Thief Trading Style Analysis🔥, we’re executing a bullish heist on EUR/GBP ("The Chunnel"). The vault is wide open—time to swipe the loot before the high-risk resistance police barricade (aka overbought trap) shuts us down!
📜 THE MASTER PLAN:
✔ Entry (📈): "The Bullish Vault is Unlocked!"
Buy Limit Orders (15-30min TF) near recent swing lows/highs.
Thief’s DCA Trick: Layer entries like a pro robber—multiple limit orders for max loot.
✔ Stop Loss (🛑): "Hide Your Stash Wisely!"
SL at nearest 4H candle wick (0.86500)—adjust based on your risk appetite & lot size.
Remember: A good thief always has an escape route!
✔ Target (🎯): 0.88500 (or escape earlier if the cops get suspicious!)
🔎 SCALPERS & SWING BANDITS – LISTEN UP!
Scalpers: Stick to LONG-ONLY heists! Use trailing SL to protect profits.
Swing Thieves: If you’re low on cash, join the slow robbery—DCA & hold!
📡 WHY THIS HEIST IS HOT:
Bullish momentum in play (but BEWARE of overbought traps!).
Fundamental Drivers: Check COT Reports, Macro Data, & Sentiment.
🚨 TRADING ALERT: NEWS = POLICE RAID RISK!
Avoid new trades during high-impact news.
Trailing SL = Your Getaway Car! Lock profits before volatility strikes.
💥 BOOST THIS HEIST – STRENGTHEN THE GANG!
👉 Smash the LIKE & BOOST button to fuel our next market robbery!
👉 Follow for more heists—profit awaits! 🚀💰
🦹♂️ Stay Sharp, Stay Ruthless… See You on the Next Heist!

DXY Just Broke Resistance – Is This the Start of a Dollar Rally?As per our analysis, DXY has successfully broken above the primary and secondary resistance line.
If the price manages to close above the marked resistance zone, we could see further upside momentum ahead.

ens sell midterm"🌟 Welcome to Golden Candle! 🌟
We're a team of 📈 passionate traders 📉 who love sharing our 🔍 technical analysis insights 🔎 with the TradingView community. 🌎
Our goal is to provide 💡 valuable perspectives 💡 on market trends and patterns, but 🚫 please note that our analyses are not intended as buy or sell recommendations. 🚫
Instead, they reflect our own 💭 personal attitudes and thoughts. 💭
Follow along and 📚 learn 📚 from our analyses! 📊💡"

USDJPY : Where the price can reach? Long Term Scene.USDJPY Could soar to:
Target 1: 152.110
Target 2: 155 - 160.326
Target 4: 164.617
Target 5: 197.462
Trade at your own risk. Market can behave differently due to various factors.

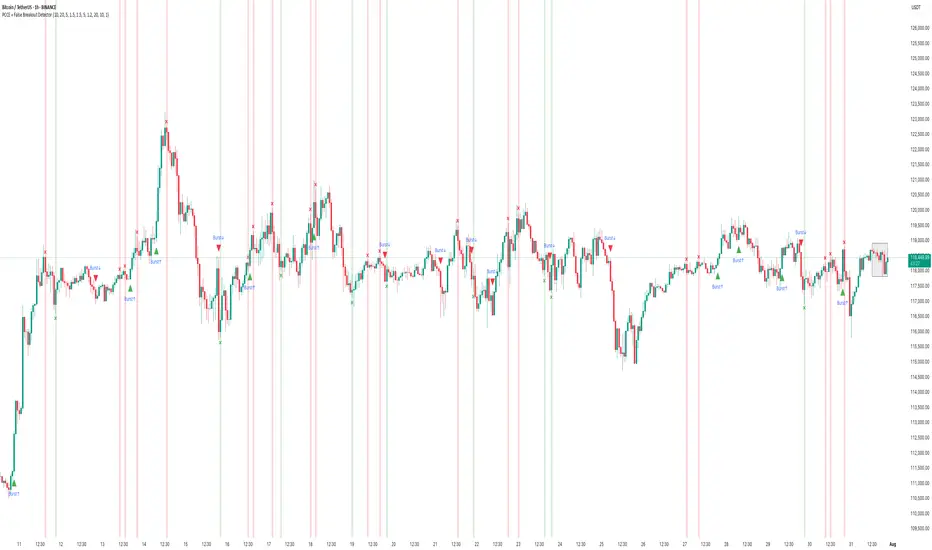
How to Use the PCCE + False Breakout DetectorHow to Use the PCCE + False Breakout Detector to Catch Trap Zones in BTC
Chart: BTC/USDT (1H)
Tool Used: PCCE + False Breakout Detector
Type: Educational – How to identify false breakouts and anticipate trend shifts.
⸻
🧠 What the Indicator Does:
The PCCE + False Breakout Detector is designed to identify breakouts from coiling ranges and filter out trap moves that often fool traders.
🔹 Burst↑ / Burst↓: Valid breakout from a price coil with volume and trend alignment
🔻 Red X: Marks a bull trap — breakout failed and price reversed lower
🟢 Green X: Marks a bear trap — breakdown failed and price reversed higher
By flagging where breakout structure fails, the indicator helps traders avoid false entries and position early for reversals.
⸻
✅ Recent Performance Highlights (BTCUSDT 1H):
📈 From July 13–31:
• Burst↑ on July 13 led to a clean uptrend (+$1,500 gain)
• Red X on July 16 called a failed breakout — price dropped hard
• Green X on July 16 caught the bear trap — price reversed immediately
• Burst↓ on July 21 triggered a sharp decline, validating breakdown
• Red X on July 30 spotted the bull trap just before price reversed down
📉 Even in sideways ranges, Red/Green Xs signaled when the move lacked conviction, allowing traders to wait instead of chasing noise.
⸻
🔍 Current Interpretation:
• BTC is trading inside a choppy structure after a recent Burst↑ and Red X combo.
• The X mark zone (gray box) warns of instability — bulls attempted a breakout but failed.
• If price continues to stay below the Red X high → likely retracement ahead.
• If we see a Green X + rally soon → potential reversal setup in progress.
⸻
📚 How-To Use the Indicator:
1. Burst Signals (Breakouts)
🔸 Use these to enter when coil compression breaks with volume
🔸 Works best when aligned with EMA trend and breakout body
2. Red / Green X (False Breakout Detector)
❌ Red X: Price spiked above resistance but lacked follow-through → trap
✅ Green X: Price dipped below support but got bought → trap
3. Confirm with Price Context
🔄 Look for reaction candles after X marks
📏 Set tighter stops — traps often reverse fast
🔔 Combine with your S/R zones or order block theory
⸻
🧠 Final Thoughts:
The PCCE + False Breakout Detector isn’t just about spotting momentum — it’s about reading intent vs. failure in price action.
BTC’s current structure shows signs of indecision. Trust the Xs to tell you whether the move has legs — or is just another trap.
🎯 Learn to trade the trap, not fall into it.
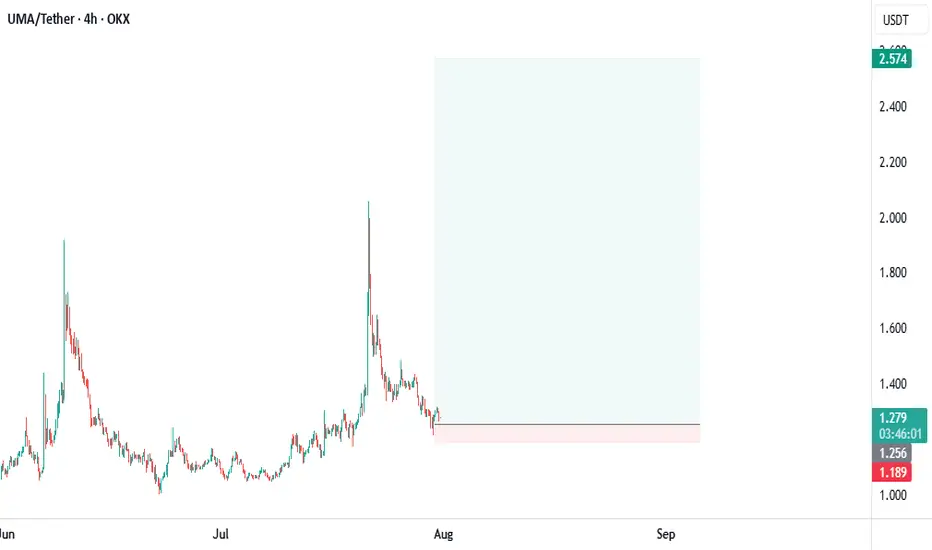
#UMA is 102% ready for the pump#UMA is 102% ready for the pump..
Hold Tight And Enjoy Ride.
!! Om Nmah Shiavye !!
$ Namaste $
OKLO (NYSE: $OKLO) – 15M Liquidity Hunt & Expansion Path📈 OKLO (NYSE: NYSE:OKLO ) – 15M Liquidity Hunt & Expansion Path
Chart by WaverVanir International LLC | VolanX Protocol
We're observing clean SMC structure post-CHOCH (Change of Character) with strong demand defense off equilibrium. Price just reclaimed the ORB high (77.81) and is consolidating under a weak high near $80.42, inside a premium rejection block.
🧠 Institutional Narrative
CHoCH → BOS confirms bullish intent post-manipulation.
Volume spike on reclaim of fair value gap shows potential absorption and re-accumulation.
Fib confluence at 0.618 (78.20) with bullish rejection and internal liquidity grab.
🎯 Targets
Minor: 80.42 (weak high), expect sweep.
Primary: 82.70 (Fib 1.382 extension) aligns with prior premium inefficiency.
Aggressive: 84.99–86.24 (1.786–2.0 extension zone).
🛡️ Invalidation
Break below ORB low 75.52 would invalidate current bullish structure short term.
🧭 VolanX Signal
This aligns with a Liquidity Expansion Playbook inside the institutional price delivery model. Watching for continuation if $80.42 sweep holds with strength.
Disclaimer: For educational purposes only. Not financial advice. #VolanX #SMC #Trading #OKLO #Stocks #LiquidityHunt #MarketStructure #InstitutionalTrading

HOOD WEEKLY OPTIONS TRADE (7/31/25)
### ⚡️HOOD WEEKLY OPTIONS TRADE (7/31/25)
📈 **Setup Summary**
→ Weekly RSI: ✅ Rising
→ Daily RSI: ❌ Falling (⚠️ Short-term pullback risk)
→ Call/Put Ratio: 🔥 **1.89** (Bullish flow)
→ Volume: 📉 Weak — fading conviction
→ Gamma Risk: 🔥 High (1DTE)
---
💥 **TRADE IDEA**
🟢 Direction: **CALL**
🎯 Strike: **\$110.00**
💰 Entry: **\$0.82**
🚀 Target: **\$1.62** (+100%)
🛑 Stop: **\$0.41**
📆 Expiry: **Aug 1 (1DTE)**
🎯 Entry: Market Open
📊 Confidence: **65%**
---
🧠 **Quick Insight:**
Mixed signals = *Scalper’s Playground*
✅ Weekly trend favors upside
⚠️ Weak volume & daily RSI divergence = TRADE LIGHT
---
📌 Posted: 2025-07-31 @ 11:53 AM ET
\#HOOD #OptionsTrading #WeeklyPlay #GammaScalp #TradingViewViral #HighRiskHighReward

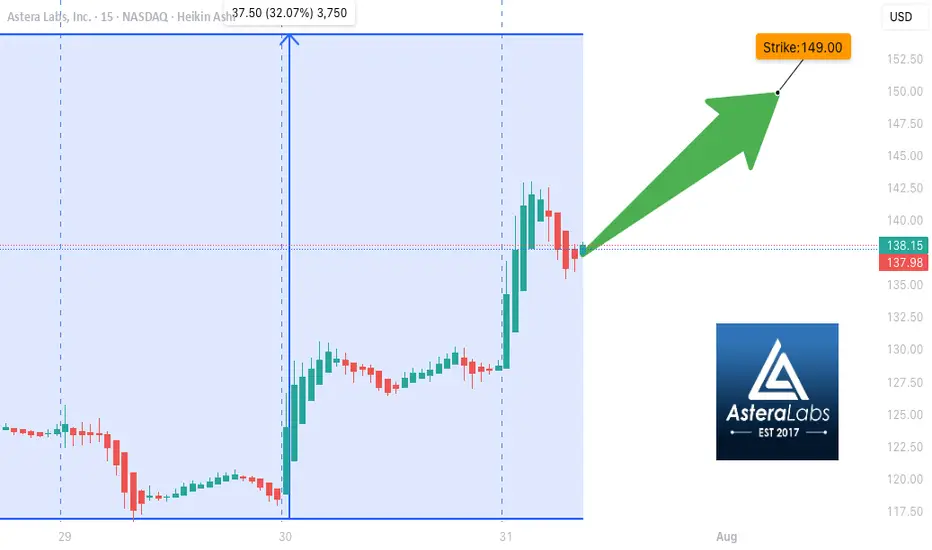
ALAB WEEKLY TRADE IDEA (2025-07-31)
### 🚨 ALAB WEEKLY TRADE IDEA (2025-07-31)
🧠 **Smart Money Snapshot**
→ RSI: **76+** = Strong Momentum
→ Call/Put Ratio: **2.19** = Bullish Bias
→ Volume: 📉 **0.6x last week** = Momentum may fade
→ Gamma Risk: ⚠️ High = Expect **fireworks**
---
📈 **TRADE SETUP**
💥 Ticker: **\ NASDAQ:ALAB **
🟢 Strategy: **Buy Call**
🎯 Strike: **\$149.00**
💰 Entry: **\$0.65**
🎯 Target: **\$0.97** (50%+)
🛑 Stop: **\$0.39**
📆 Expiry: **Aug 1 (1DTE)**
📊 Confidence: **75%**
---
⚠️ **Risk Note:**
1DTE = 💣 High gamma = **big reward / big risk**
🧯 Size small. Exit fast. Ride momentum.
---
📌 Trade posted: **2025-07-31 @ 10:58 AM ET**
\#ALAB #OptionsTrading #WeeklyPlay #GammaSqueeze #MomentumTrade #TradingViewViral
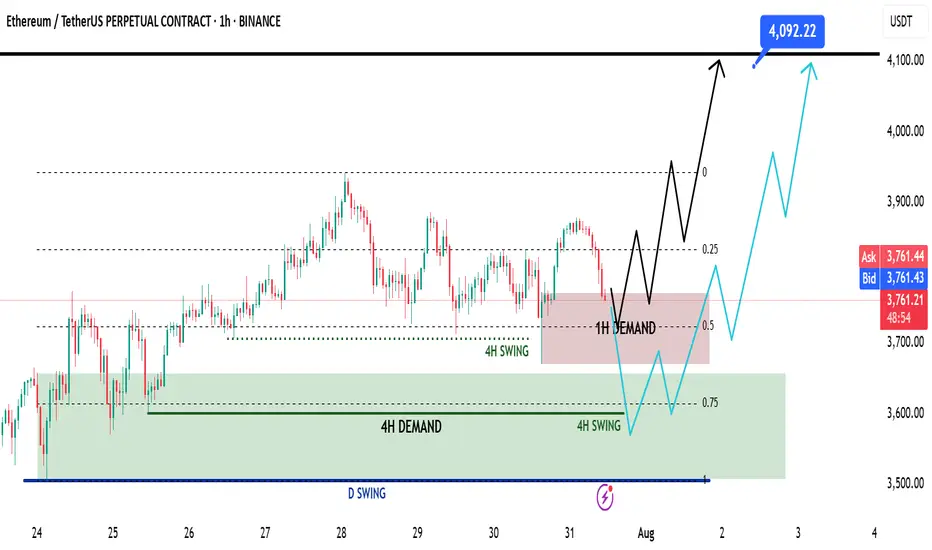
Ethereum Mid Week Update - Swing Long Idea📈 Market Context:
ETH remains in a healthy bullish structure. Despite the recent retracement, price action is still supported by strong demand zones on higher timeframes. No change in the overall sentiment from earlier this week.
🧾 Weekly Recap:
• Price rejected from the Fibonacci 0.5 EQ level — a discounted zone in my model.
• While doing so, it also ran 4H swing liquidity.
• After taking liquidity, ETH formed a 1H demand zone — a sign to look for lower timeframe confirmations for long setups.
📌 Technical Outlook:
→ Price has already tapped into the 1H demand zone.
→ From here, we have two possible scenarios:
Black scenario (ideal):
• Wait for 15M bullish break of structure (BOS).
• Enter after confirmation for long setups from 1H demand.
Blue scenario (deeper retrace):
• If no bounce from 1H demand, expect price to dip toward 0.75 Fib level (max discount).
• Watch for another liquidity run & 1H–4H demand formation.
🎯 Setup Trigger:
✅ 15M bullish BOS inside 1H or 4H demand zones
→ This would be the entry confirmation trigger for longs.
📋 Trade Management:
• Stoploss: Below the swing low of the 15M BOS
• Target: 4090$
💬 Like, follow, and drop a comment if this outlook helped — and stay tuned for more setups each week!
EURJPY SWEET BLUESEurjpy has hit all take profits with very little drawdown and huge profits very quickly nice pattern, simply followed

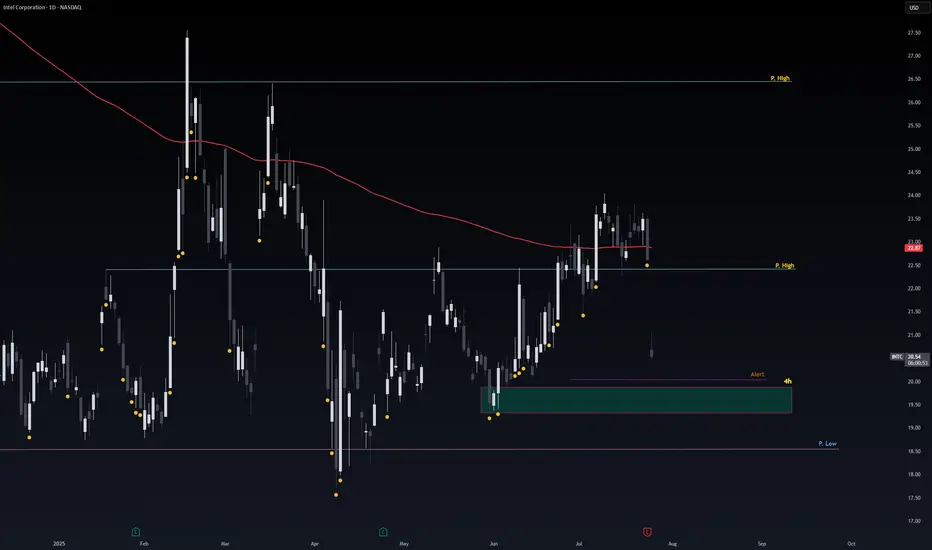
Safe Entry IntelThe 4h Green Zone is Safe & Strong Support for Intel.
If not respected the Pink Line is Second Strong support level.
Note: 1- Potentional of Strong Buying Zone:
We have two scenarios must happen at The Mentioned Zone:
Scenarios One: strong buying volume with reversal Candle.
Scenarios Two: Fake Break-Out of The Buying Zone.
Both indicate buyers stepping in strongly. NEVER Join in unless one showed up.
2- How to Buy Stock (safe way):
On 1H TF when Marubozu/Doji Candle show up which indicate strong buyers stepping-in.
Buy on 0.5 Fibo Level of the Marubozu/Doji Candle, because price will always and always re-test the
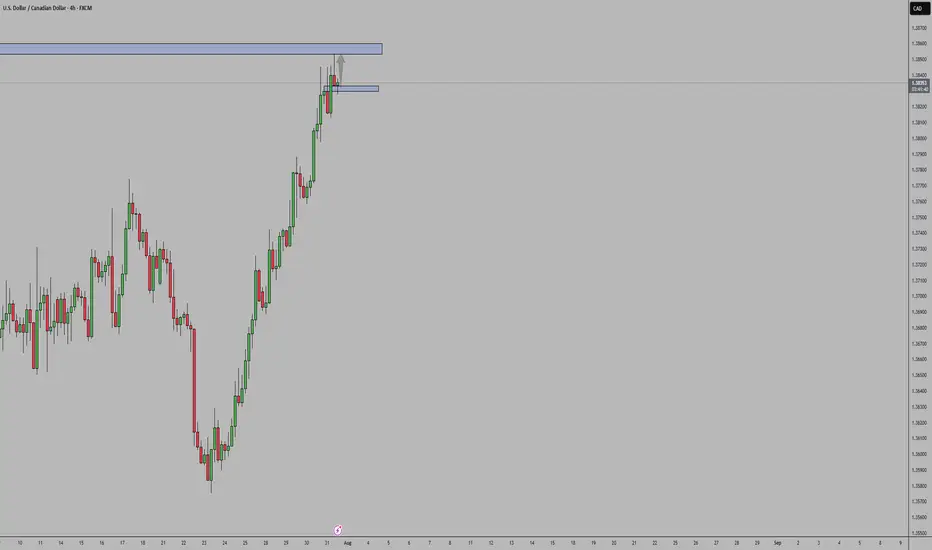
USDCADSupport Zone: Price has retested a strong support area
Price Action: The retest held — buyers defended it, showing rejection wicks / bullish candles.
Bias: Bullish while support holds → look for continuation to next resistance.
Invalidation: Bias weakens if support breaks and closes below the zone.
So as long as price stays above the retested support, USD/CAD remains bullish.
MORE DOWNSIDE AHEAD Looking at the GBPUSD pair, we can see that the trend has reversed to the downside.
The pair broke a rising trendline to the downside in the past and also formed a head and shoulder pattern.
Also in the past,price broke a resistance which is indicated with blue rectangle and a support which is indicated with a red rectangle to the downside.
I'm seeing price retracing to retest the previously broken structure or support which is indicated with a red rectangle and turning it to resistance, and thereby continuing the downtrend

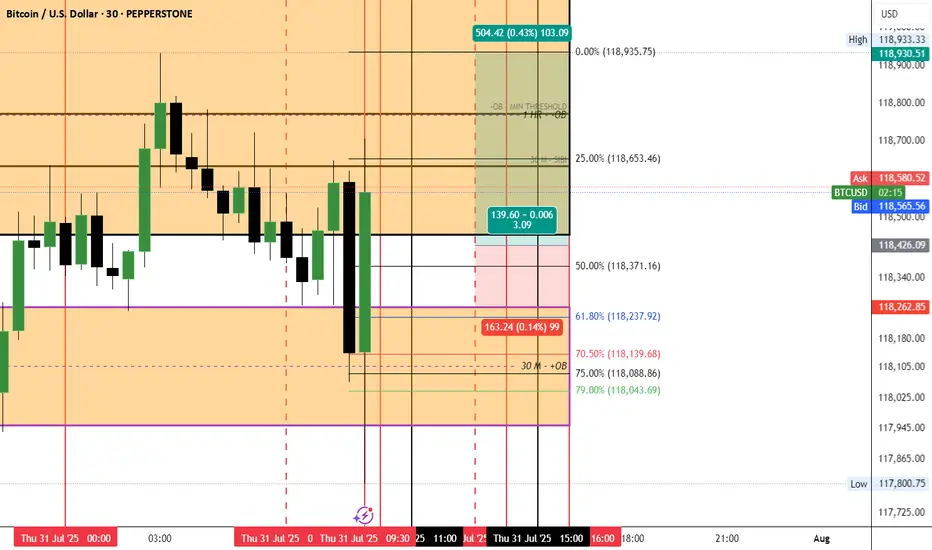
BTC LONG IDEA
My short term analysis of a long BTC Setup
ENTRY @ PRICE = 118,422
SL @ PRICE = 118262
TP @ PRICE = 118930
BTC AI Prediction Dashboard - 6h Price Path (31.07.25)
Prediction made using Crypticorn AI Prediction Dashboard
Link in bio
BTCUSDT Forecast:
Crypticorn AI Prediction Dashboard Projects 6h Price Path (Forward-Only)
Forecast timestamp: ~14:00 UTC
Timeframe: 15m
Prediction horizon: 6 hours
Model output:
Central estimate (blue line): -118,124
Represents the AI’s best estimate of BTC’s near-term price direction.
80% confidence band (light blue): 117,836 – 118,977
The light blue zone marks the 80% confidence range — the most likely area for price to close
40% confidence band (dark blue): 117,650 – 119,908
The dark blue zone shows the narrower 40% confidence range, where price is expected to stay with higher concentration
Volume on signal bar: 177.26
This chart shows a short-term Bitcoin price forecast using AI-generated confidence zones.
Candlesticks reflect actual BTC/USDT price action in 15-minute intervals.
This helps visualize expected volatility and potential price zones in the short term.

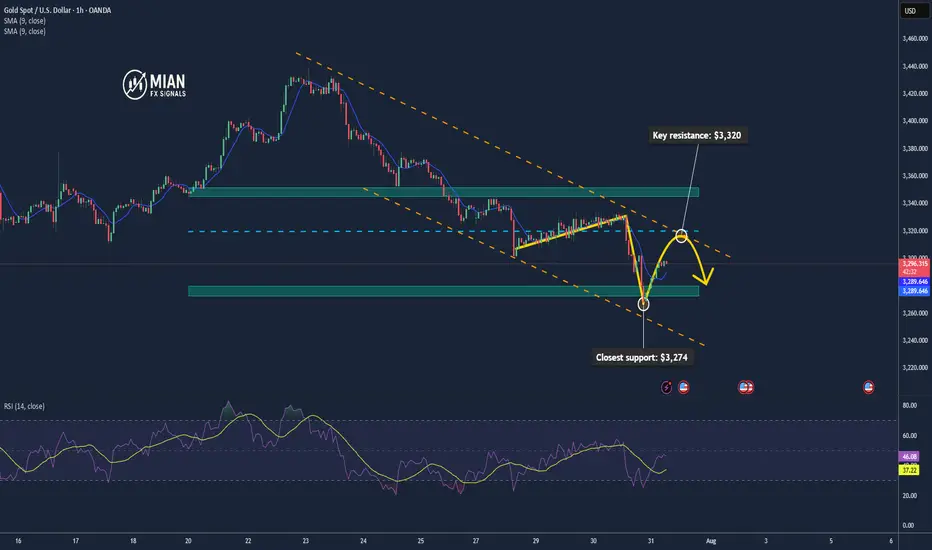
Gold May Rise Technically after Testing the $3,300 Zone📊 Market Overview:
Spot gold is trading around $3,295–$3,301/oz, influenced by slightly lower U.S. Treasury yields and a softer dollar tone. Analyst consensus from Reuters projects gold likely to stay above $3,220/oz through 2025 and possibly hit $3,400 in 2026 amid continued safe-haven demand
📉 Technical Analysis:
• Key resistance: $3,320 / $3,345
• Closest support: $3,274 – $3,280
• EMA09: Price is currently below the 9 period EMA on H1, indicating a short-term bearish bias.
• Candlestick / volume / momentum: There was a minor bounce from the support zone around $3,274, but volume remains low. RSI isn't oversold, suggesting room for technical pullback.
📌 Outlook:
Gold may experience a technical rebound if it holds above $3,280. A breakout above $3,320 would likely require clear catalyst—such as weak U.S. data or a dovish Fed tone.
💡 Suggested Trading Strategy:
SELL XAU/USD: $3,320 – $3,323
🎯 TP: 40/80/200 pips
❌ SL: $3,326
BUY XAU/USD: $3,279 – $3,282
🎯 TP: 40/80/200 pips
❌ SL: $3376
BUY AFTER THE PULLBACK Analyzing the daily time frame of silver, we can see that silver is in a bullish uptrend.
The price of silver is respecting a rising trend line which is acting as support in the past, only for some few times in the past did it exhibit a fake breakout which is indicated with an arrow.
I see the price of silver from its current price actions selling to our required point of interest and looking for buy liquidity to buy at our confluence which is both previous resistance which was broken to the upside which I indicated with a blue rectangle and a rising trend line.
Please look for buys at the previous broken resistance which is indicated with a blue rectangle in confluence with a rising trendline.
.............,...........................................
Please kindly share your thoughts on silver
