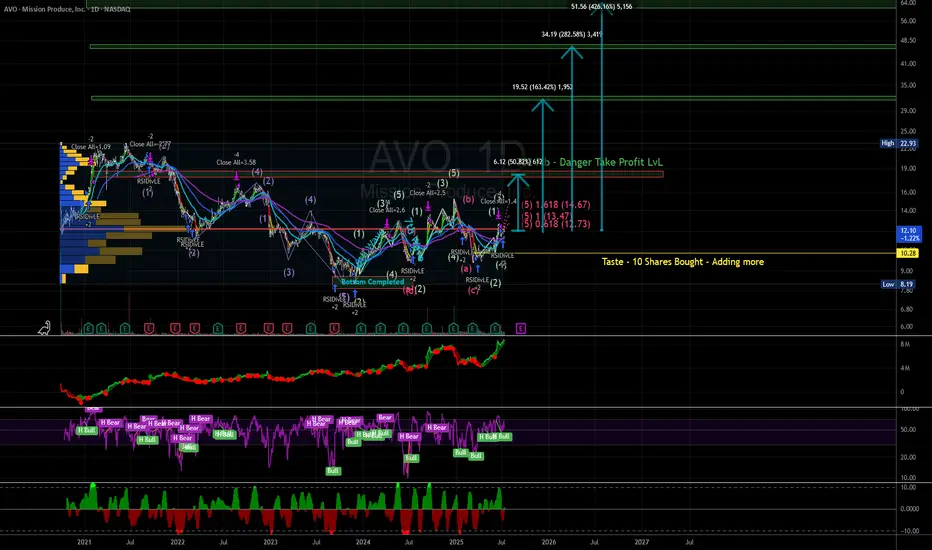
Not too bullish, but one to watch for break outThis trade is still in the consolidation phase, but has a potential break out with volume. Wanting to see price get above $13, before adding more to this position.
For the time being, watch and look for volume and consolidation.
Beyond Technical Analysis
BUYTrend Line Break
Previous Day Volume
Rejection Point
Untapped Order Point
Asian Session
High Structure Swing
RGTI Heading to $17+ Good evening trading family
So currently due to price action it appears we are on our way to 17 dollar target however we expect a little bit of a correction at the 15 range.
However worst scenario if we go below 11 dollars be prepared for a sinker down to 8.
Trade Smarter Live Better
Kris/ Mindbloome Exchange

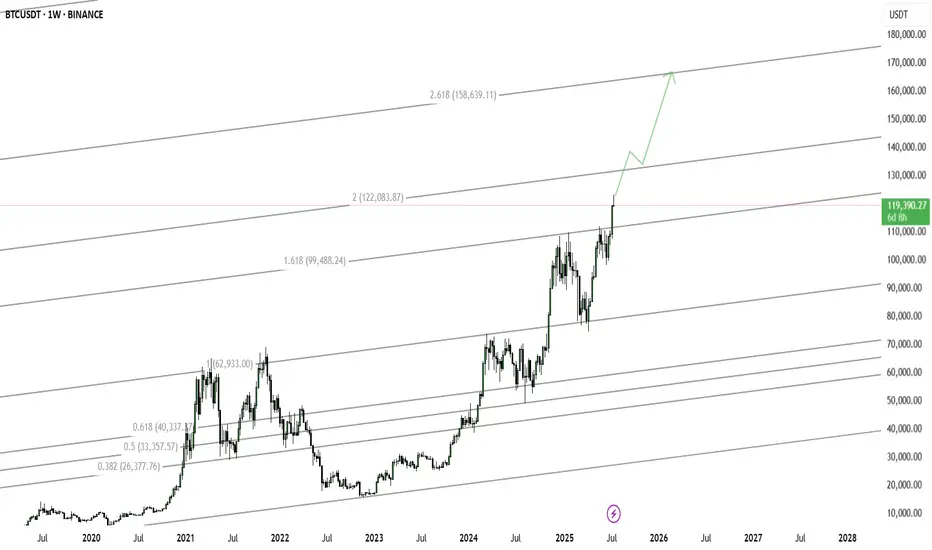
Bitcoin Cycle PredictionThis "Bitcoin Cycle Prediction" chart utilizes a long-term logarithmic view of BTC/USD price action on a weekly timeframe (1W) via Kraken exchange data, highlighting the cyclical nature of Bitcoin's market behavior across past, present, and projected future cycles.
Key features include:
Parabolic Growth Curves: Three completed macro cycles and a fourth projected cycle are visualized with rounded cup-like formations, indicating historical accumulation phases followed by exponential bull runs.
Fibonacci Retracement & Extension Levels: Each major bull run is annotated with Fibonacci retracement and extension zones, helping identify historical resistance and support levels, as well as potential future price targets. Extensions like 1.618, 2.618, and 3.0 are used to forecast upper bounds.
RSI (Relative Strength Index) : Positioned at the bottom, the RSI gives insight into historical overbought and oversold conditions, aligning well with the cycle peaks and troughs.
MACD (Moving Average Convergence Divergence): MACD crossovers and histogram movements reinforce the timing of bullish and bearish phases within each cycle.
Cycle Timing Marker: The vertical green line marks a projected inflection point around January 2026, suggesting the anticipated peak of the next bull cycle based on previous timing patterns.
Price Targets: Based on previous Fibonacci multiples, projected price targets for the upcoming cycle could reach extensions between $195,000 and $665,000+, if historical behavior repeats.
This chart is a speculative but historically informed visualization designed for educational and analytical purposes, offering long-term investors and cycle theorists a structured look at Bitcoin's repeating macro trends.

CITYSTAR | AUDUSD ; SELL ANALYSE AUDUSD New Forecast👨💻👨💻
This is my personal trade and not in anyway a mandatory setup.
Note:
Follow proper risk management rules. Never risk more then 2% of your total capital. Money management is the key of success in this business...... Set your own SL & TP.
Please support this idea with a Like and COMMENT if you find it useful click "follow" on our profile if you will like these type of trading ideas delivered straight to your email in the future.
Thanks for your continued support!! lemme know your thoughts in the comment sec..

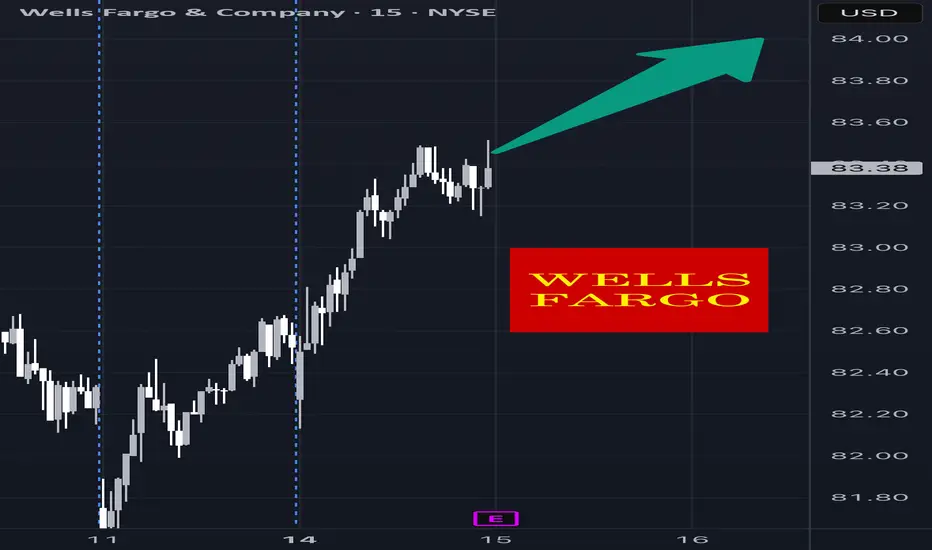
WFC Earnings Setup – 07/14/2025 $86C | Exp. July 18 | Betting on
📈 WFC Earnings Setup – 07/14/2025
$86C | Exp. July 18 | Betting on a Bank Bounce
⸻
🔥 EARNINGS HEAT CHECK
💼 WFC reports BMO (07/15)
📊 Historical move avg: ~3–5%
📍 Current price: $82.53
📈 Above 20D/50D MAs → trend intact
⚠️ RSI = 78.07 = overbought 🚨
💥 Expected move: $2.89
⸻
🧠 SENTIMENT SNAPSHOT
🔄 Call OI stacked at $86
🔻 Put OI focused at $81
⚖️ Balanced flow → slight bullish tilt
🧾 IV is elevated, so IV crush is coming
⸻
🏦 SECTOR SUPPORT
• Financials showing strength 📈
• No major institutional bias
• VIX @ 16.40 → macro calm = earnings-friendly
⸻
🎯 Trade Plan – IV Exploitation Setup
{
"ticker": "WFC",
"type": "CALL",
"strike": 86,
"exp": "2025-07-18",
"entry": 0.81,
"target": 1.62,
"stop": 0.40,
"size": 1,
"confidence": "70%",
"entry_timing": "pre-earnings close"
}
🔹 Call Entry: $0.81
🎯 Profit Target: $1.62 (+100%)
🛑 Stop: $0.40 (-50%)
📅 Expiry: 07/18/25
📆 Earnings Date: 07/14 (BMO)
📈 Expected Move: ~$2.89
🧠 Confidence: 70%
⸻
⚠️ Key Risks
• IV crush = quick decay if WFC doesn’t move
• Guidance could swing the stock either direction fast
• Overbought = short-term pullback risk even on good earnings
✅ Why $86C?
• Just outside expected move
• High OI = liquidity
• Reasonable premium = good risk/reward
⸻
📣 Model Consensus:
“Moderately Bullish” — strong setup but keep it tight around earnings!
Tag your favorite bank stock trader 🏦👇
Who’s playing WFC earnings this quarter?
#WFC #EarningsPlay #OptionsTrading #CallOption #BankingStocks #IVCrush #RiskReward #AITrading #
Daily Analysis- XAUUSD (Tuesday, 15th July 2024)Bias: Bearish
USD News(Red Folder):
-CPI m/m
Notes:
- Price closed strong bearish
- Looking for price to retest daily structure
- Potential SELL if there's
confirmation on lower timeframe
- Pivot point: 3380
Disclaimer:
This analysis is from a personal point of view, always conduct on your own research before making any trading decisions as the analysis do not guarantee complete accuracy.

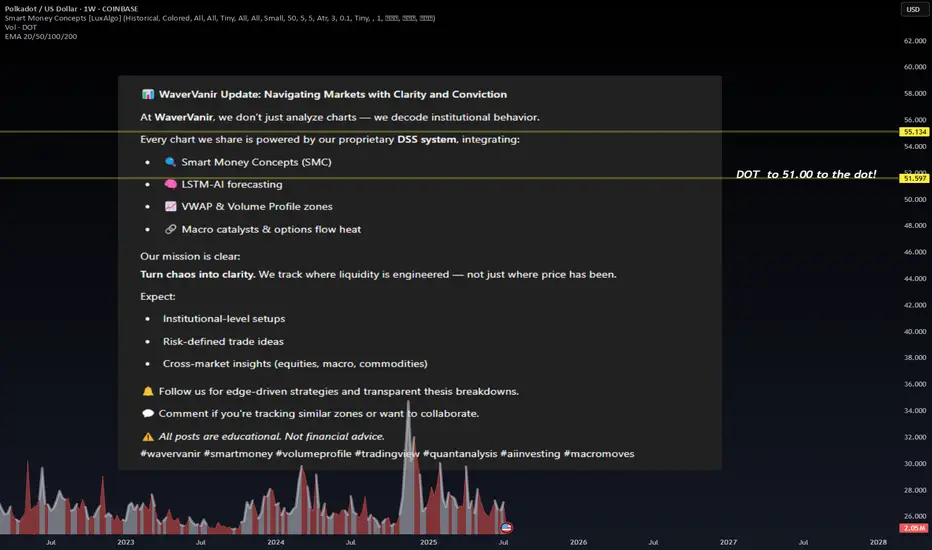
WaverVanir Update: Navigating Markets with Clarity and Convictio📊 WaverVanir Update: Navigating Markets with Clarity and Conviction
At WaverVanir, we don’t just analyze charts — we decode institutional behavior.
Every chart we share is powered by our proprietary DSS system, integrating:
🔍 Smart Money Concepts (SMC)
🧠 LSTM-AI forecasting
📈 VWAP & Volume Profile zones
🔗 Macro catalysts & options flow heat
Our mission is clear:
Turn chaos into clarity. We track where liquidity is engineered — not just where price has been.
Expect:
Institutional-level setups
Risk-defined trade ideas
Cross-market insights (equities, macro, commodities)
🔔 Follow us for edge-driven strategies and transparent thesis breakdowns.
💬 Comment if you're tracking similar zones or want to collaborate.
⚠️ All posts are educational. Not financial advice.
#wavervanir #smartmoney #volumeprofile #tradingview #quantanalysis #aiinvesting #macromoves
BEAR WITH ME... First of all, I'm getting into the field of other players and trying to call their type of shots.
I don't intend to come across as ignorant when it comes to this market, since I only trade gold and I have seen FOREX traders try to predict gold and get it completely wrong.
I have NO ARGUMENTS WHATSOEVER with which I could back this PREDICTION up; NOT PROJECTION...
As a matter of fact, Technically speaking , the " PROJECTION " would actually be BULLISH , because price is entering a "discovery" phase, In which there is no previous high to "top" a potential impulse with.
When price is making ATH, YOU CAN'T CALL THE TOP UNTIL THE TOP IS FORMED.
That being said, I only want to have this on my profile for personal use and see if my "prediction" comes a reality between December 2025 and February 2026.
--
7 year gold bull run after ETF $GLD launches in 2004This begs the question, how many multi year bull run will bitcoin go for considering NASDAQ:IBIT is the most successful ETF of all time and that bitcoin is scarce.


BTC — Long from Support Box (#4h) | BULLISH1. Buy: Limit order 115.5k–116.6k
2. Alert: If close < 113k, scenario invalid
3. Target: 125k


US OILUS OIL is reaching towards important zone which can give us a good move to the upside after it sweeps OLD LOW

EUR/USD 4H POSSIBLE TRIGGERChart is setup and ready to take the trade at the top of the hour. Looks to me like the EUR/USD is heading down.

Skeptic | GBP/USD Update: Triggers Fired Up!Hey everyone, it’s Skeptic! ;) yesterday, the support at 1.35672 saw a fake breakout and snapped back into the 4-hour box we’ve been tracking. But bearish momentum is still strong, so here’s the play:
✔️ If you opened a short already , With the fake breakout signaling potential momentum shift, consider taking profits or closing if price consolidates above 1.36089. Why? The fakeout increases the chance of a momentum change.
✨ For new short positions , the 1.35672 break remains a valid trigger. If it breaks again, it could kickstart a major bearish leg, targeting lower supports at 1.35000 and 1.34227 —both strong reaction zones.
📊 The HWC is uptrend, so shorts need extra caution—reduce risk or take profits early.
📉 For longs , wait for a break and consolidation above 1.36406 . This level saw a strong rejection, signaling it’s a key resistance the market respects. A break here, liquidating short positions (which means buying), could spark a solid uptrend leg with great R/R potential.
🔔 Confirmation : Use RSI entering oversold for shorts or overbought for longs. The HWC uptrend means shorts carry higher risk, so tighten your risk management—stick to 1%–2% risk per trade.
🔼 Key Takeaway: Short at 1.35672 if it breaks again, long at 1.36406 with confirmation. Stay sharp for momentum shifts and keep stops tight. I’ll update if the market structure flips!
💬 Let’s Talk!
Which GBP/USD trigger are you locked on? Hit the comments, and let’s crush it together! 😊 If this update lit your fire, smash that boost—it fuels my mission! :)))

Trading Game of the Day 14-JULY-2025Trading plan
1-bias
2-narrative
3-context
4-entry
5-risk management
iFVG and FVG is the cornerstone of my trade today
iFVG is a failed FVG
BB is failed OB

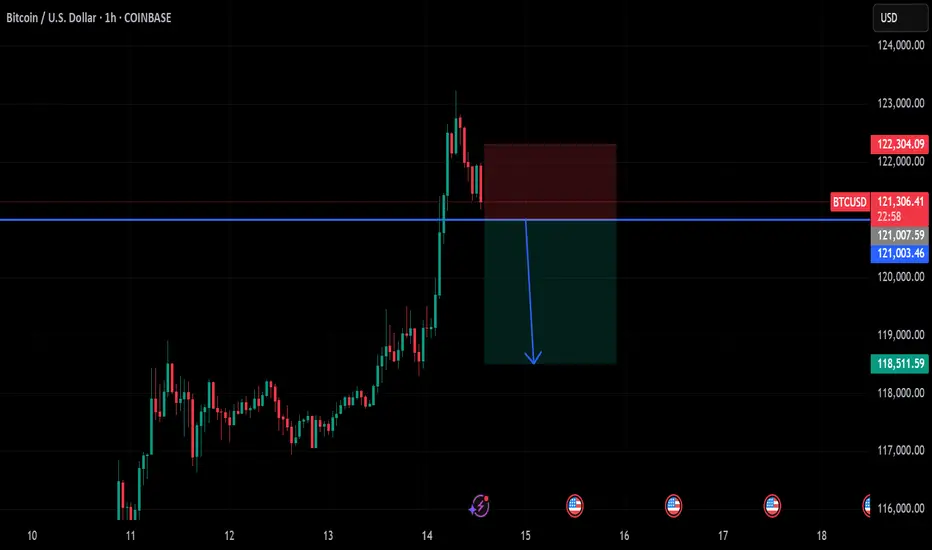
btc on sell below 121k#BTCUSD price now on reverse, expected entry below 121k on H1 closure.
Target 118500, Stop loss 122300. First short TP at 120500 for possible reverse on buy.
Bullish can take place if the H1 doesn't close below the sell entry, any breakout above 123k again will reach 125k.
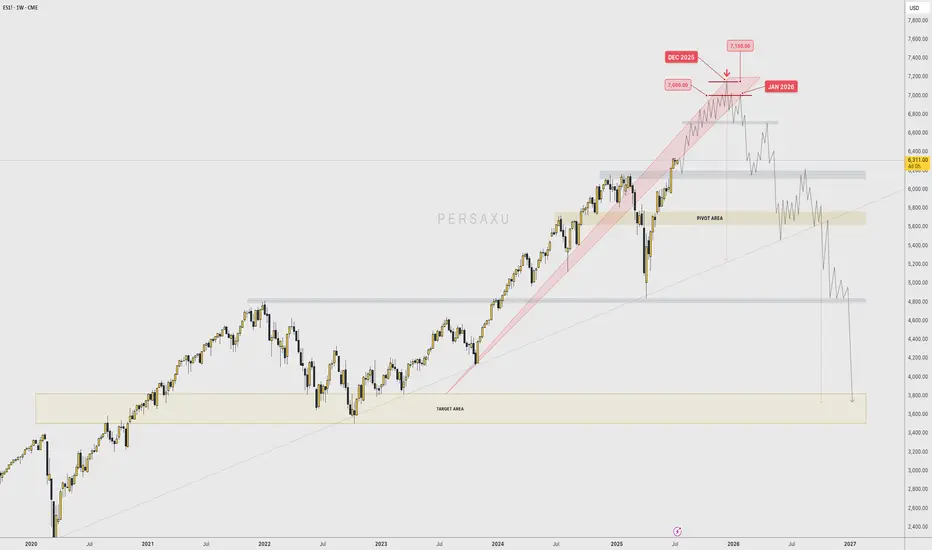
Live Setup for ES NY am session (14 July, 2025)MY bias: I expect price to make move lower at NY am session and target 6,259 price level.

XAU/USD Weekly Update — July 14, 2025⌛Timeframe:
.
📆 Date: July 14, 2025
.
🎯 Weekly Bias: Mildly Bullish — elevated risk, cautious momentum
🔎 Market Overview:
🛡️ Safe‑haven demand surging:
Renewed 30% tariffs on EU, Mexico, Canada have pushed investors into gold, lifting prices to a 3-week high.
📉 Weak USD & inflation hedge:
A softer U.S. dollar, under pressure from dovish Fed speculation, continues to support gold. A predicted September rate cut further boosts gold’s appeal.
🏦 Central bank accumulation:
Q1 2025 saw record demand from central banks (≈244 tonnes), with many reallocating reserves toward gold for geopolitical and de-dollarization reasons.
📈 YTD performance standout:
Gold is up ~27% this year, leading other assets. Bullish technical indicators like tightening Bollinger Bands and sustained MACD support continuation.
🌀 Market Sentiment:
🔽 Exchange reserves continue dropping:
Indicative of increased HODLing and lower upcoming sell pressure.
🧠 Sentiment firmly bullish:
Analysts highlight risk‑off bias; gold remains favored amid trade tensions.
🤝 ETF inflows & institutional buying:
Strong flows through gold ETFs and central bank buying reflect ongoing structural support.
🔧 Technical Analysis:
📊 Weekly Movement: +1.9% weekly gain, now at $3,367.
✅ Key Levels:
🔻 Resistance: $3,374 → $3,400
🔺 Support: $3,350 → $3,331
🟢 Signals: Mild bearish RSI divergence hints at short-term pause
🟢 Weekly Bias: Mildly Bullish — momentum favored, but caution amid technical divergence.
.
.
.
⚠️ Risk Reminder: For educational purposes only — not financial advice. Utilize prudent risk management.
👍 If this update helps, hit like, comment your view, and follow for timely XAUUSD alerts!

XAUUSD Bullish Signal | Technical + Custom AlgoSmart Trend Signal | Technical Analysis + Custom Algorithm
This signal is the result of a combination of classic technical trend analysis and a proprietary software I personally developed.

XAUUSD Golds Back To 3374Hello Traders! Quick read on Gold.. We are back down to the low of the day and looking for an upwards move for the rest of today and tomorrow.
A nice batch of demand that has not been tested yet and looking for the buyers to load back their positions.
Long Position
TP: 3374
1-2 Day Trade
