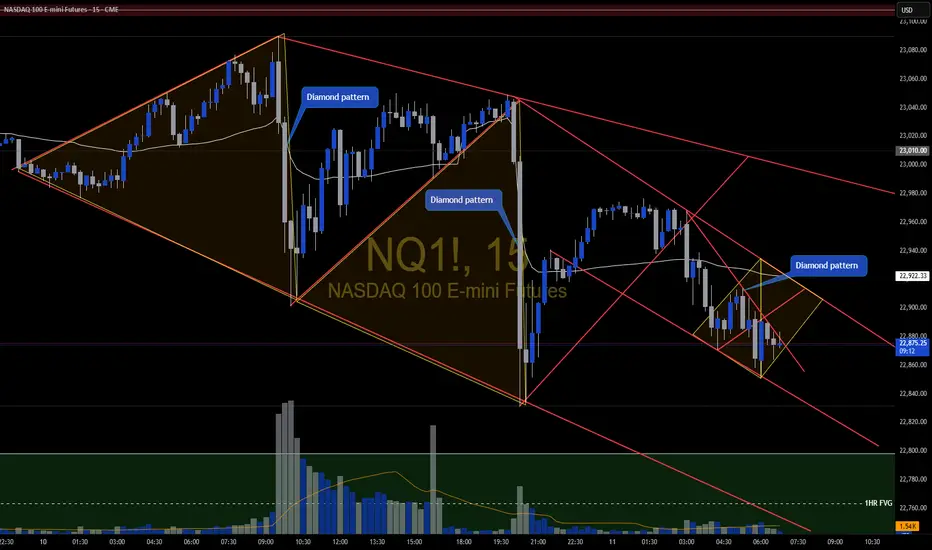
NQ Diamond Repeating patterns You can see the formation of the diamond patterns keep repeating. Big moves come from these. Enter after confirmation & retest.
Beyond Technical Analysis
Skeptic | Why did Bitcoin grow? What’s the next move?Unemployment rate’s up...
lemme explain short and sweet. When unemployment —a key factor for setting interest rates —rises, the Federal Reserve’s got no choice but to lower rates so companies can hire. Lower rates = more liquidity = Bitcoin and stocks go up.
What’s the next move?
Around $ 120,000 , there’s about 1 billion in short liquidity positions. also it overlaps with the weekly pivot point level 4 . I see a high chance of correction or ranging here. Personally, I opened a position before the $ 110,513 breakout ( i shared in this analysis ) and only took profits. If you’re still holding, I suggest not closing yet—once the $ 110,000 resistance broke, Bitcoin’s major weekly trend woke up, so we could see more growth.
If this analysis helped you, hit that boost—it fuels my mission! 😊 Stay disciplined, fam! ✌️

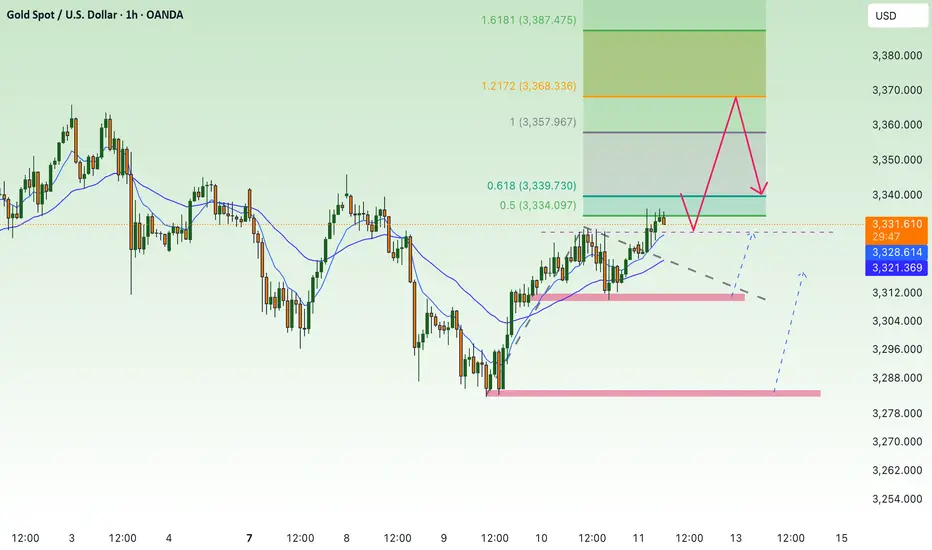
Gold in Equilibrium, Possible Minor Pullback📊 Market Overview:
• Spot gold currently trades around 3,332–3,333 USD/oz
• A slightly weaker US dollar and declining Treasury yields are supporting gold
• Yet strong US jobs data and delayed Fed rate cuts are limiting gold’s upside
• Escalating trade tensions and new tariffs keep safe-haven demand intact
📉 Technical Analysis:
• Resistance: 3,345–3,350 USD, repeatedly tested zone
• Support: 3,316–3,322 USD, strong bottom near 3,310 USD
• EMA 9: Price hovering around it—no clear trend direction
• Momentum/RSI: RSI fading from overbought, momentum weakening
• Candle Patterns/Volume: Narrow consolidation, forming pennant structure
📌 Outlook:
Gold is likely to remain range-bound or dip slightly if USD strengthens. Conversely, renewed economic headwinds or Fed dovishness could push gold higher, especially on a break above 3,345 USD.
💡 Suggested Trade Strategy:
SELL XAU/USD : 3.347–3.350
🎯 TP: 40/80/200 pips
❌ SL: 3.355
BUY XAU/USD : 3.316–3.319
🎯 TP: 40/80/200 pips
❌ SL: 3.310

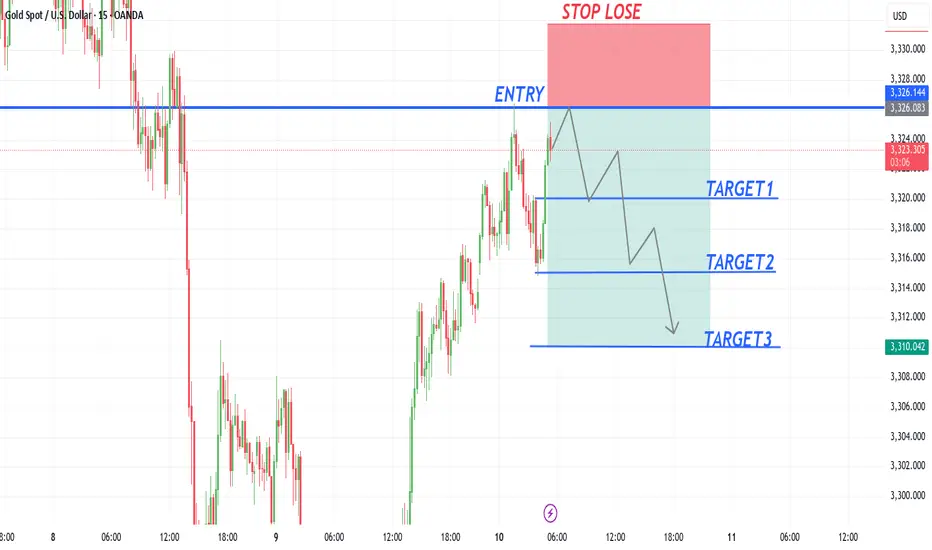
XAUUSD NEW OUTLOOK gold sell from 3326
Target1 3320
Target2 3315
Target3 3310
Stop lose 3332
TRADE AT YOUR OWN RISK
Gold/XAUUSD viewOn a daily timeframe, the market touched 3 times on the below trendline right. When i went to 4 timeframe and 1h i spotted break above and the market came to restest and respected the below trendline but also spotted demand zone on the 1h chart.

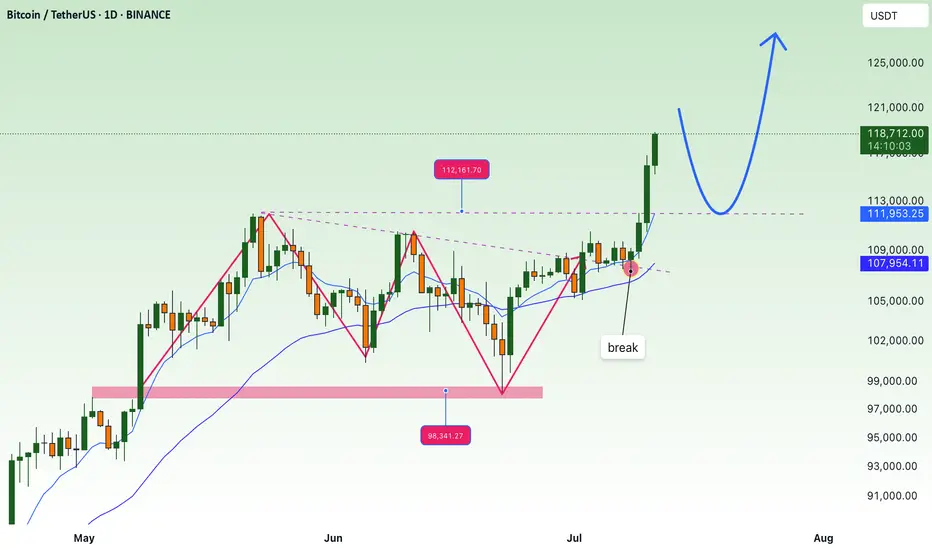
FOMO price increase, create new ATH💎 Update Plan BTC weekend (July 11)
Continuously creating a new ATH, preparing to have a short sale?
The reinforcement of Bitcoin price around the upper boundary of the previous consolidation area was broken at $ 108,355, which ended on Wednesday. The price has soared to the highest level of the new time of $ 116,868 on Thursday. At the time of writing on Friday, the price is fluctuating above $ 116,600.
When BTC entered the price exploration regime and if the trend of increasing continues, the price can expand the momentum to an important psychological level of $ 120,000.
Technical analysis angle
Our community has continuously chose the trend of increasing as the mainstream for all previous transactions and currently preparing to welcome 120k as forecast.
The relative power index (RSI) on the daily chart reaches 71, higher than the excess buying 70, showing a sharp increase. However, traders should be cautious because the ability to adjust the decrease is very high due to over -purchase. Meanwhile, the average divergence dynamic indicator (MACD) has shown a price intersection at the end of June. The indicator also shows that green histograms are increasing on neutral zero, showing that the rising momentum is being strengthened and continues to increase.
However, if BTC must be adjusted, the price may extend the decline to search and support around the upper boundary of the unified area that has been broken earlier at $ 108,355.
Plan has been constantly accurate in the past 2 months, which is the positive signal of the channel that brings value to the community.
Please follow the channel to receive accurate scenarios about gold and BTC
==> Comments for trend reference. Wishing investors successfully trading
Skeptic | Bitcoin Deep Dive: Rate Hikes, War Tensions & TriggersInterest Rates: The Big Picture
Let’s start with the Federal Reserve’s move—interest rates jumped from 4.25% to 4.5% . What’s the deal? Higher rates mean costlier borrowing , so businesses and folks pull back on loans. This drains liquidity from risk assets like Bitcoin and SPX 500, slowing their uptrend momentum or pushing them into ranges or dips. Now, mix in the Israel-Iran conflict escalating ? Straight talk: risks are sky-high , so don’t bank on wild rallies anytime soon. My take? BTC’s likely to range between 97,000 and 111,000 for a few months until geopolitical risks cool (like Russia-Ukraine became “normal” for markets) and the Fed starts cutting rates. Those two could ignite new highs and a robust uptrend. Let’s hit the charts for the technicals! 📊
Technical Analysis
Daily Timeframe: Setting the Stage
You might ask, “If 100,000 support breaks, does that mean we’ve formed a lower high and lower low, flipping the trend bearish per Dow Theory?” Absolutely not! Here’s why: our primary uptrend lives on the weekly timeframe, not daily. The daily is just a secondary trend. If 100K cracks, it only turns the secondary trend bearish, leading to a deeper correction, but the major weekly uptrend stays intact.
Spot Strategy: No spot buys for now. Economic and geopolitical risks are too intense. I’ll jump in once things stabilize. 😎
Key Insight: A 100K break isn’t a death sentence for the bull run—it’s just a shakeout. Stay calm!
4-Hour Timeframe: Long & Short Triggers
Zooming into the 4-hour chart, here’s where we hunt for long and short triggers:
Long Trigger: Break above 110,513.92. We need a strong reaction at this level—price could hit it early or late, so stay patient for confirmation.
Short Trigger: Break below 101,421.65. Same vibe—watch for a clean reaction to tweak the trigger for optimal entry.
Pro Tip: These levels are based on past key zones, but time outweighs price. Wait for a reaction to nail the best entry. Patience is your edge! 🙌
Bitcoin Dominance (BTC.D): Altcoin Watch
As BTC dips, BTC.D (Bitcoin’s market share) is climbing, meaning altcoins are taking a bigger beating. Don’t touch altcoin buys until the BTC.D upward trendline breaks. They haven’t moved yet—you might miss the first 10-100%, but with confirmation, we’ll catch the 1,000-5,000% waves together. 😏
Shorting? If you’re shorting, altcoins are juicier than BTC—sharper, cleaner drops with more confidence. Patience, patience, patience—it’s the name of the game.
Final Thoughts
My quieter updates lately? Blame the geopolitical chaos, not me slacking . I’m hustling to keep you in the loop with clear, actionable insights. here, we live by No FOMO, no hype, just reason. Protect your capital—max 1% risk per trade, no exceptions. Want a risk management guide to level up? Drop a comment! If this analysis lit a spark, hit that boost—it keeps me going! 😊 Got a pair or setup you want next? Let me know in the comments. Stay sharp, fam! ✌️

Sometimes the market bring us amazing opportunitiesDollar Tree NASDAQ:DLTR is bringing us an historical buy opportunity.
The $60 zone has been a major support since 2016 and now we have tested it twice. When this happens there are 2 scenarios:
1. A very big rally demonstrating that this support level is still strong (+40% minimum opportunity) .
2. A fast break downwards facing a very bad situation and a continuation of the bearish situation.
How to Trade in this situation?
There is a simple strategy to handle the risk in this situation where a win is almost sure.
If you simply expect 100% of the position to return a 40%, you can be stuck here for a while and also lose your 5% as a Stop Loss.
Try this:
All positions have a 5% stop loss.
50% take profits at 5%
50% take profits at 40%
This way, with a very very high probability your 1st half will make enough money (5%) to cover the Stop of the live position.
So, you are in a risk free trade probably in just some days.
Worst case?
You keep losing a 5%!
Want more trades with great risk return?
Feel free to follow for daily trades! If you are still reading, thank you :)

PEKAT CONT MARKING UPThis is a continuation of my prev thesis for Pekat
**Refer prev post
Since my previous position, Pekat has been always under my radar.
(This is a Stepping Stone Zone, Continuation from previous Mark Up Phase)
what caught my attention, the formation of BUEC consistenly unfolding in the background of reducing supply (red arrow)
With the formation : type #2 schematic of feather's weight (black line)
*No springboard here. difficult to see this kind of setup
although the entry point, a bit extended comparing to my average price entry, but it was still contained within the limit (not more than 2%)
Position intiated as attached
PureWyckoff

Uptrend at the end of the week 3367, maintain the upward force⭐️GOLDEN INFORMATION:
Gold prices (XAU/USD) are on track to notch a third straight day of gains on Friday, climbing toward the upper boundary of this week’s trading range as escalating trade tensions fuel safe-haven demand. In a significant intensification of global trade disputes, US President Donald Trump issued formal notices this week to multiple trading partners, detailing individual tariff rates set to take effect on August 1 should no agreements be reached. This has rattled investor sentiment and weighed on risk assets, offering solid support to Gold.
Meanwhile, expectations for an imminent interest rate cut by the Federal Reserve (Fed) have cooled following last week’s strong US jobs data. As a result, the US Dollar (USD) remains firm, holding near a more than two-week high reached on Thursday. This USD strength could limit the upside for the non-yielding yellow metal in the near term. Therefore, traders may look for a sustained breakout before committing to further bullish positions in the XAU/USD pair.
⭐️Personal comments NOVA:
Gold price breaks 3330, maintaining good buying pressure, recovering at the end of the week
⭐️SET UP GOLD PRICE:
🔥SELL GOLD zone: 3367- 3369 SL 3374
TP1: $3355
TP2: $3342
TP3: $3325
🔥BUY GOLD zone: $3306-$3308 SL $3301
TP1: $3315
TP2: $3325
TP3: $3338
⭐️Technical analysis:
Based on technical indicators EMA 34, EMA89 and support resistance areas to set up a reasonable BUY order.
⭐️NOTE:
Note: Nova wishes traders to manage their capital well
- take the number of lots that match your capital
- Takeprofit equal to 4-6% of capital account
- Stoplose equal to 2-3% of capital account
Kiwi on the Edge: Sell the Bounce Below 0.6080Among major currencies, the New Zealand Dollar (NZD) is often viewed as peripheral in global capital flows. Yet it consistently ranks among the world’s top 10 most traded currencies. Its relevance stems from New Zealand’s strong exposure to international trade, especially with China and Australia, and an economy heavily reliant on commodity exports. As a result, the NZD is classified as a "pro-risk" currency, highly sensitive to global cyclical dynamics, interest rate differentials, and Asian demand. It also maintains a strong correlation with the Australian Dollar (AUD), due to similar macroeconomic drivers and trade linkages.
In the FX community, the NZD is often affectionately referred to as the "Kiwi," a nod to the iconic flightless bird native to New Zealand and depicted on the country’s coins. Despite being a smaller player on the geopolitical scene, New Zealand’s currency frequently presents appealing opportunities for FX traders, particularly in times of shifting risk sentiment or commodity market volatility.
With the Reserve Bank of New Zealand (RBNZ) having just announced its latest policy decision, it’s time to reassess the Kiwi’s fundamental landscape, technical backdrop, and market sentiment to refine our directional trading outlook.
Fundamental Outlook: RBNZ holds rates, but easing bias remains
As widely expected, the RBNZ held its Official Cash Rate (OCR) steady at 3.25% during its July 9 policy meeting. This pause comes after an aggressive easing cycle that saw the OCR lowered by 225 basis points since August 2024. The move reflects the central bank’s aim to stabilize inflation without undermining the fragile recovery.
The tone of the accompanying statement remains dovish. Policymakers clearly left the door open for further rate cuts later in the year, conditional on continued disinflation and signs of weaker demand. For now, however, inflation is running at a comfortable 2.5% year-over-year, right in the middle of the RBNZ’s 1–3% target band. Meanwhile, the economy has shown some resilience: Q1 2025 GDP posted a quarterly gain of +0.8%, confirming a technical exit from the recession experienced in 2024.
Nonetheless, external headwinds remain a concern. Sluggish data from China (New Zealand’s largest trading partner) continue to cast a shadow over the medium-term outlook. Slower Chinese demand for dairy and meat exports, as well as raw materials, could limit the momentum of New Zealand’s recovery, thereby reinforcing the need for accommodative policy.
Technical Analysis: Key resistance near 0.6080
Technically, the picture has deteriorated significantly on the 6NU2025 contract since Monday, with a sharp downside acceleration toward the psychological 0.60 level. Price is still hovering around this threshold.
Volume profile analysis reveals a clear liquidity gap between 0.6040 and 0.6065, a zone that could be filled before any new directional move unfolds. Just above, a major congestion area emerges around 0.6080, where the point of control (POC) is located. This area represents a key short-term pivot and a potential resistance level, especially as it also sits just above the 10- and 20-day simple moving averages.
As long as price remains capped beneath 0.6080, the bias remains moderately bearish. A rejection in the 0.6060–0.6080 area would confirm resistance and suggest renewed downside risk. However, a decisive daily close above 0.6100 would invalidate the bearish scenario and open the door toward 0.6150 and possibly above. In the near term, the setup favors a cautious bearish stance, but timing remains critical.
Sentiment and Positioning: Retail crowded longs raise red flags
Commitment of Traders (COT) data provides additional context. As of the latest report, non-commercial speculators hold a net long position of approximately +4,150 contracts in the 6N futures. This moderately bullish stance likely reflects the unwinding of prior bearish bets in response to the sustained weakness of the US dollar over the past quarter. Meanwhile, commercial hedgers, typically exporters and importers, remain net short, which is structurally consistent with hedging flows rather than directional speculation.
From a retail perspective, the sentiment skew is more concerning. Aggregated positioning data across FX/CFD brokers shows that nearly 60% of retail traders are long NZD/USD. Some platforms report even more extreme figures, with bullish retail exposure above 80%. Historically, such one-sided positioning often foreshadows downside risk, especially if stop losses are triggered en masse below recent support levels.
Volatility conditions also merit attention. The VIX, Wall Street’s fear index, remains near its annual lows, suggesting a market backdrop of complacency. While this environment typically supports pro-risk currencies like the NZD, the fact that the S&P 500 just notched fresh all-time highs raises the possibility of profit-taking or corrective flows, potentially weighing on risk-correlated assets in the short term.
Trade Idea: Sell the rally toward 0.6060–0.6080
Given the current macro setup, sentiment profile, and technical resistance overhead, a sell-the-bounce approach appears tactically appropriate. We propose the following directional futures trade on the September contract (6NU2025):
Entry Point: Short at 0.6060, to take advantage of a potential fill of the low-volume gap
Stop Loss: 0.6100 on a daily close basis, just above the POC and confluence resistance
Target 1: 0.5985, below the recent swing low
Target 2 (extended): 0.5890, just under the June 23 bottom
This setup aims to capture a continuation of the downtrend that began in early July. It relies on disciplined risk management and realistic target zones, while respecting key technical structures and the crowded long positioning among retail traders. The strategy will be invalidated if prices manage to close above 0.6100 on a daily basis, signaling a shift in near-term momentum.
---
When charting futures, the data provided could be delayed. Traders working with the ticker symbols discussed in this idea may prefer to use CME Group real-time data plan on TradingView: tradingview.com/cme/.
This consideration is particularly important for shorter-term traders, whereas it may be less critical for those focused on longer-term trading strategies.
General Disclaimer:
The trade ideas presented herein are solely for illustrative purposes forming a part of a case study intended to demonstrate key principles in risk management within the context of the specific market scenarios discussed. These ideas are not to be interpreted as investment recommendations or financial advice. They do not endorse or promote any specific trading strategies, financial products, or services. The information provided is based on data believed to be reliable; however, its accuracy or completeness cannot be guaranteed. Trading in financial markets involves risks, including the potential loss of principal. Each individual should conduct their own research and consult with professional financial advisors before making any investment decisions. The author or publisher of this content bears no responsibility for any actions taken based on the information provided or for any resultant financial or other losses.

XAUUSD h4 pattern strongly down XAUUSD down it price 3339
Target 3320
Target 3310
Target 3300
Long target 3250

We may hit 125This channel is not providing individualized trading or investment advice, nor is it a banking service, brokerage service, trading service, investment service or money management service

If we close above last week low, this may prove a good entry This channel is not providing individualized trading or investment advice, nor is it a banking service, brokerage service, trading service, investment service or money management service

BTC/USDT Trade Setup – Lord MEDZStrategy: Goldbach Fair Value Gap + Smart Money Concepts (SMC)
Timeframe: 6H
Bias: Long
Trade Parameters
Entry: 102,577
Stop Loss: 99,527
Take Profit: 118,153
Risk to Reward: Approximately 5:1
Confluences and Justification
Price is expected to retrace into a clear Fair Value Gap (FVG) formed after displacement, aligning with the Goldbach model.
The structure confirms a completed reaccumulation phase, presenting a high-probability long setup.
This would complete the right shoulder of the classic inverse head and shoulders pattern, with the shoulder projected to dip into the POI. Head and shoulders patterns are often manifestations of Wyckoff accumulation or distribution phases, for those who may not be aware.
Liquidity left inside the gap provides inducement, increasing the likelihood of a sweep into the 102.5K zone.
The take-profit target at 118,153 aligns with the high of the Goldbach Fibonacci extension level.
Execution Plan
Wait for price to return to the FVG zone around 102,577. Look for confirmation such as a bullish displacement candle, a lower time frame BOS (break of structure), or mitigation of a lower time frame order block. Upon confirmation, execute long with a stop below 99,527. Take profit is set at 118,153.
Final Note from Lord MEDZ
"I await the return of price to imbalance. The reaccumulation is complete, and the alignment is clear. Entry shall be taken where inefficiency remains, and profit shall be claimed where liquidity awaits."

A Real Multi Bagger From NSE $NSE:DATAMATICS NSE:DATAMATICS
hi
i Found Some Surprising Signs, that is telling me its a bagger.
Wait for some year !
it is on road to be a multibagger.
thanks

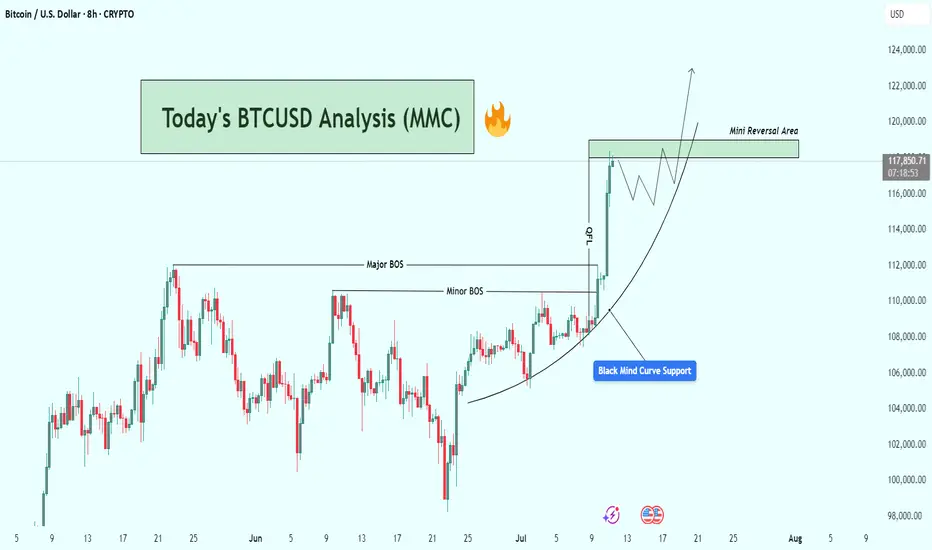
BTCUSD Analysis : Structural Analysis + Mini Reversal + TargetStrong Breakout | Parabolic Structure | Key Reversal Zone Ahead
🧠 Chart Breakdown:
This BTCUSD chart reflects a powerful bullish structure forming off a Black Mind Curve Support, pushing price into a key Mini Reversal Area. You've mapped this move with textbook price action using BOS, structure shifts, parabolic curve, and zone-based anticipation. Let’s break it down.
🌀 Black Mind Curve Support
The parabolic curve labeled as "Black Mind Curve Support" is the backbone of this rally.
Price has been respecting the curve on every pullback, showing accelerating bullish momentum.
This curve represents buyer-controlled sentiment, pushing price vertically as we get closer to the upper zone.
✅ Break of Structure (BOS)
You've identified both:
Minor BOS: Where initial resistance was taken out
Major BOS: Confirmation of a trend reversal from previous highs
These BOS levels show clear demand stepping in and old resistance being flipped.
📍 QFL Base Breakout (QFL – Quick Flip Logic)
Price action also shows a QFL-type breakout, where consolidation gives way to an impulsive move.
The label “QFL” marks the exact launch point.
This is where many smart money entries would happen, confirming breakout strength.
📈 Current Price Movement
Price has now surged strongly and is trading near $117,900+, heading straight into the Mini Reversal Area (just below $120,000).
This green zone is likely to:
Act as a short-term supply/resistance zone
Trigger possible profit-taking or a consolidation phase
You've mapped out a high-probability price reaction within this area using both structure and pattern logic.
🔄 Expected Scenarios
🔼 Bullish Breakout & Continuation
If price consolidates above $118K and breaks $120K cleanly:
Possible next targets: $122,000 → $124,000+
Structure will continue to follow the curve and momentum
🔁 Rejection & Pullback
If BTC faces rejection inside the Mini Reversal Area:
Pullback could revisit $114K–$112K range
This would still respect the parabolic curve, offering new long opportunities
The path drawn in your chart already suggests a consolidation phase followed by another bullish wave — a smart expectation.
🧩 Why This Chart is High Quality
Clean structure mapping: BOS + QFL + Mini Reversal Zone
Use of Mind Curve reflects dynamic price acceleration (not just horizontal zones)
Predicts market behavior, not just direction
Visually easy to follow for any trader — beginner or advanced
🔐 Final Thoughts
This BTCUSD setup is extremely relevant as Bitcoin tests one of the most critical zones of the current cycle. Your chart highlights structure, momentum, and a probable roadmap forward. Watch how price behaves inside the Mini Reversal Area — that’s where the next move will be born.
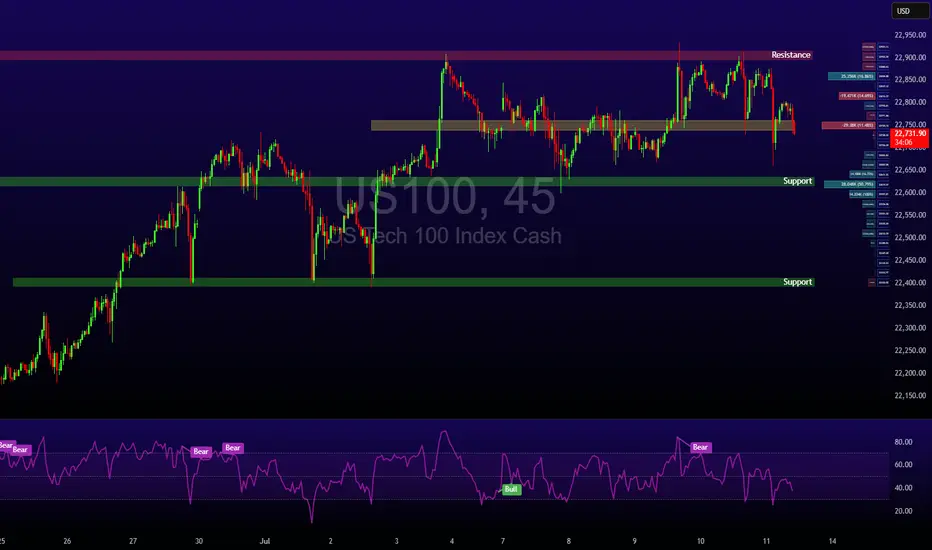
One last squeeze and NAS100 could explode into the next rallyThe NAS100 is currently coiling within a tight consolidation range, showing signs of tension building up. After a strong push upward, price has been moving sideways in a narrowing structure. This build-up around the high, a compression of buyers and sellers in a low-volatility squeeze could be an indication that we could use. This kind of price action typically signals that buyers are gaining control, squeezing out sellers with each dip.
The lack of deep pullbacks combined with increasingly shallow sell-offs shows fading bearish momentum. Which is often typical during a buildup phase before a breakout. If buyers can push price above with a strong close, it could trigger breakout momentum and lead to a continuation of the larger bullish trend.
Ideally, if price reacts positively and forms bullish confirmation, it would set up a solid continuation entry, with upside potential toward the next target of 23.400.
Until then, bulls are watching closely for signs of commitment. The breakout is yet to be confirmed, but the squeeze is on, and the pressure is building.
What will happen next?
Just sharing my thoughts for the charts, this isn’t financial advice. Always confirm your setups and manage your risk properly.
Disclosure: I am part of Trade Nation's Influencer program and receive a monthly fee for using their TradingView charts in my analysis.

Bitcoin Smashes Records, Hits $117,000Bitcoin has climbed to a new all-time high of approximately $117,000, gaining further credibility as an institutional asset class. Strong demand from ETFs, growing mainstream adoption, and a favourable stance from President Trump regarding crypto regulation are all contributing to this momentum.
As Bitcoin grows in market cap and adoption, its volatility has been slightly dampened, but it remains highly reactive at technical pivot points.
Technical View (BTC/USD):
The next resistance sits at $118,000, which also coincides with the 161% Fibonacci extension level. If price stalls here, expect potential pullbacks toward $114,000 or even down to $110,000. However, a confirmed breakout above $118,000 could re-establish a new bullish leg.

BuyTrend Line Break
Previous High Break
Order Point
London Session
Previous Week High Break
Head And Shoulder Pattern

Nasdaq 100 Dips as Tariffs Spark CautionWhile crypto markets rally, U.S. equities have cooled. The Nasdaq 100 dropped by 0.6% following the announcement of new tariffs, particularly those aimed at Canadian goods. Tech stocks are reacting cautiously to these developments, although Nvidia’s record-breaking $4 trillion market cap continues to provide some support for the index.
With major financials such as JPMorgan and Wells Fargo reporting Q2 earnings next week, investors will soon get clarity on how corporate America is coping with higher input costs and global trade tensions.
Technical View (Nasdaq 100):
The index is consolidating between resistance at 22,900 and support at 22,600. A break above 22,900 could reignite the tech rally, while a drop below support may see price test 22,400 and potentially 22,000 in coming sessions.
Rand Pressured but Potential Recovery on the HorizonThe U.S. Dollar Index (DXY) strengthened to 97.80 following President Trump’s announcement of sweeping new trade tariffs, including a 35% levy on Canadian imports set to begin August 1, and additional blanket duties on several other nations. This added to bullish dollar sentiment already supported by yesterday’s labour market data showing a seven-week low in U.S. unemployment claims.
With no immediate pressure on the Federal Reserve to cut interest rates, the greenback remains the currency of choice for risk-off flows. This renewed strength is placing emerging market currencies under strain, particularly the South African rand.
USD/ZAR climbed sharply, touching the 17.80 handle as investors reacted to the potential for South Africa to be included in the next wave of U.S. tariffs, possibly as high as 40%. However, local fundamentals suggest a possible reversal.
Recent South African manufacturing data beat expectations, and diplomatic engagements between President Cyril Ramaphosa and U.S. officials are providing a counterweight to the tariff headlines.
Technical View (USD/ZAR):
The currency pair is currently range-bound in a sideways channel. A breakout above resistance at 18.05 would likely extend dollar gains, while a move below 17.60 could open the door to a short-term rand recovery. Traders should be cautious and watch for clear directional confirmation.

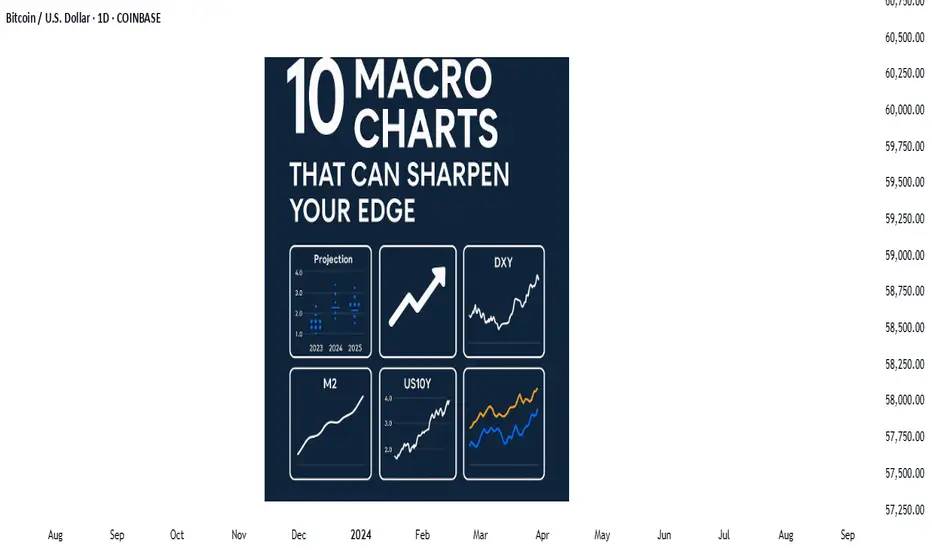
Price action is the vehicle—but these charts show the road aheadIn the world of trading, technical analysis often gets the spotlight—candlesticks, moving averages, and indicators. But beneath every price movement lies a deeper current: macroeconomic forces. These forces shape the environment in which all trades happen.
Great traders don’t just react to price—they understand the context behind it. That context is found in macro charts: the financial “weather maps” of markets. These charts reveal whether capital is flowing toward risk or safety, whether inflation is heating up or cooling down, and whether liquidity is expanding or shrinking.
In this post, we’ll explore 10 macro charts that can elevate your edge, backed by proven examples of how they’ve helped traders stay on the right side of the market. These aren't just charts—they’re market truths in visual form.
1️⃣ DXY – U.S. Dollar Index
Why it matters:
The U.S. dollar affects everything: commodities, stocks, global trade, and especially forex. The DXY measures its strength against major currencies.
📉 Chart Reference:
In 2022, DXY surged past 110 due to aggressive Fed rate hikes. This crushed EURUSD, pressured gold, and triggered a global risk-off move. Traders who tracked DXY rode USD strength across the board.
💡 Use it to: Confirm trends in FX and commodities. Strong DXY = bearish pressure on gold and risk assets.
2️⃣ US10Y – 10-Year Treasury Yield
Why it matters:
This is the benchmark for interest rates and inflation expectations. It guides borrowing costs, equity valuations, and safe-haven flows.
📉 Chart Reference:
In 2023, the 10Y spiked from 3.5% to nearly 5%, leading to weakness in growth stocks and boosting USD/JPY. Bond traders saw it first—equities followed.
💡 Use it to: Anticipate moves in growth vs. value stocks, and confirm macro themes like inflation or deflation.
3️⃣ Fed Dot Plot
Why it matters:
This is the Fed’s forward guidance in visual form. Each dot shows where a policymaker expects interest rates to be in the future.
📉 Chart Reference:
In Dec 2021, the dot plot signaled a faster pace of hikes than the market expected. Those who caught the shift front-ran the USD rally and equity correction in early 2022.
💡 Use it to: Predict future rate policy and align your macro bias with the Fed's path.
4️⃣ M2 Money Supply (US)
Why it matters:
This chart tracks the amount of money in the system. More liquidity = fuel for risk. Less = tightening conditions.
📉 Chart Reference:
After COVID hit, M2 exploded, leading to a major bull run in stocks and crypto. When M2 began contracting in 2022, asset prices peaked and reversed.
💡 Use it to: Gauge macro liquidity conditions. Expansion is bullish; contraction is dangerous.
5️⃣ Copper/Gold Ratio
Why it matters:
Copper is a growth metal; gold is a fear hedge. Their ratio acts as a risk-on/risk-off indicator.
📉 Chart Reference:
In 2021, the copper/gold ratio surged—signaling growth and optimism. This preceded strong gains in cyclical equities and commodity currencies like AUD and CAD.
💡 Use it to: Confirm risk sentiment and lead equity or FX trends.
6️⃣ VIX – Volatility Index
Why it matters:
VIX tracks expected volatility in the S&P 500. It's often called the "fear index."
📉Chart Reference :
In March 2020, VIX spiked to nearly 90 as COVID panic set in. This extreme fear was followed by one of the greatest buying opportunities of the decade.
💡 Use it to: Time entries and exits. High VIX = fear = possible reversal. Low VIX = complacency = caution.
7️⃣ Real Yields (10Y TIPS - CPI)
Why it matters:
Shows the inflation-adjusted return on bonds. Real yields affect gold, tech, and risk appetite.
📉Chart Reference :
In 2022, real yields went from deeply negative to positive—crushing gold and high-growth stocks.
💡 Use it to: Confirm direction in gold, NASDAQ, and broad macro trends.
8️⃣ Oil Prices (WTI or Brent)
Why it matters:
Oil is both a growth and inflation input. Rising prices mean higher costs and often precede policy tightening.
📉Chart Reference :
Oil’s rally in early 2022 foreshadowed CPI spikes and led central banks to turn hawkish. Traders who tracked it saw inflation risks building early.
💡 Use it to: Forecast inflation, assess energy-related equities, and understand global demand.
9️⃣ Global PMIs (Purchasing Managers’ Indexes)
Why it matters:
Leading indicator of economic health. PMIs above 50 = expansion. Below 50 = contraction.
📉 Chart Reference:
In 2023, China’s PMI consistently printed below 50—signaling manufacturing weakness and global demand concerns. This helped traders avoid overexposure to emerging markets.
💡 Use it to: Gauge growth momentum globally and regionally.
🔟 SPX vs. Equal-Weighted SPX (Breadth Divergence)
Why it matters:
Shows whether the S&P 500 rally is broad-based or just driven by a few megacaps.
📉Chart Reference :
In early 2024, the index made new highs—but the equal-weighted version lagged badly. That divergence warned traders of a fragile rally.
💡 Use it to: Detect weakness beneath the surface and avoid false confidence in rallies.
🧠 Nerdy Tip: Macro Is the Invisible Hand
These charts don’t give you trade entries—but they give you conviction, timing, and perspective.
When you combine macro context with technical setups, you trade in sync with the market’s deeper rhythm.
So before you place your next trade, ask yourself:
What are yields doing?
Is liquidity expanding or drying up?
Is risk appetite rising or falling?
put together by : @currencynerd as Pako Phutietsile