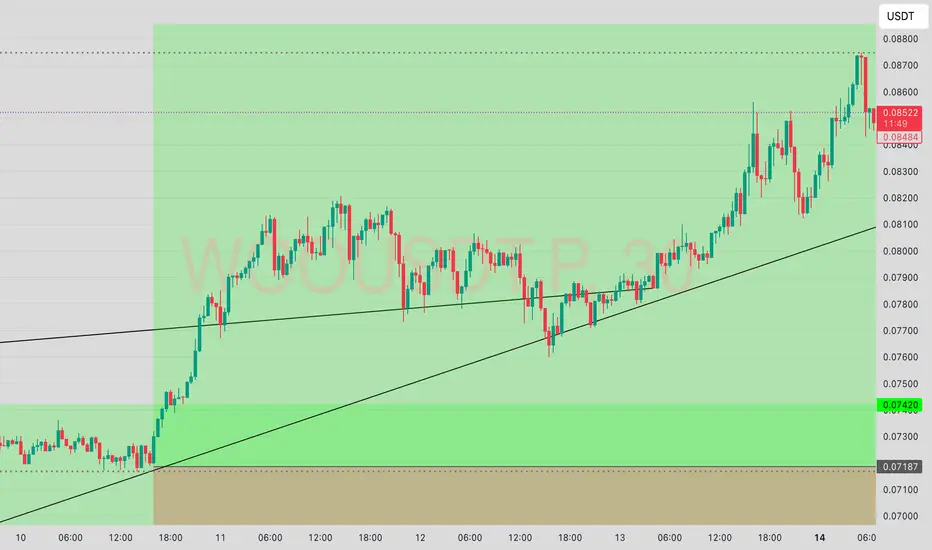
$WOOAnother painful trade here with BYBIT:WOOUSDT.P .
I set a limit entry @0.07187 while the trade came down nearing my entry but reversed @0.07198.
Looking at the chart now, it's nearing TP and I’m surprised I wasn’t in the ride.
So checking back and seeing this pains me. I’m SAD 😢
Beyond Technical Analysis
BTC Next Move within 11-15 DaysBTC will hit $62,528.74 Within 11-15 Days
The historical trend suggests that once Bitcoin (BTC) surpasses the $50,000 threshold, it typically enters a bullish phase, experiencing significant gains. This observation is based on past market behavior, where crossing this key price point has often led to increased investor confidence and subsequent price surges.

My overview of Gold past and future price movementsBasic Concept(Institutional)
Market seeks either of this two things:
1. Liquidity
2. Fair value

XAUUSD Analysis Of next waveSo the Analysis of gold is that if 3343-3345 holds we can travel to 3392-3388 as mentioned there the wave completion target is there

Gold Surges Late Session – Targeting $3,345+📊 Market Overview:
• Gold has just broken higher to $3,339, extending its bullish move after clearing the $3,335 resistance zone.
• Market sentiment remains supportive as the USD weakens and U.S. bond yields stabilize, while the Fed still shows no signs of cutting rates soon.
📉 Technical Analysis:
• Next resistance: $3,345 – $3,350
• Nearest support: $3,335 – $3,336
• EMA 09: Price remains above EMA 09 → confirms short-term uptrend
• Momentum: RSI stays bullish, and price continues to follow breakout momentum from the recent consolidation zone
📌 Outlook:
Gold is holding its bullish structure — if it stays above $3,335, a move toward $3,345–$3,350 is likely during the Asian session.
💡 Suggested Trading Strategy
🔺 BUY XAU/USD at: 3,336 – 3,338
🎯 TP: 3,350
❌ SL: 3,330

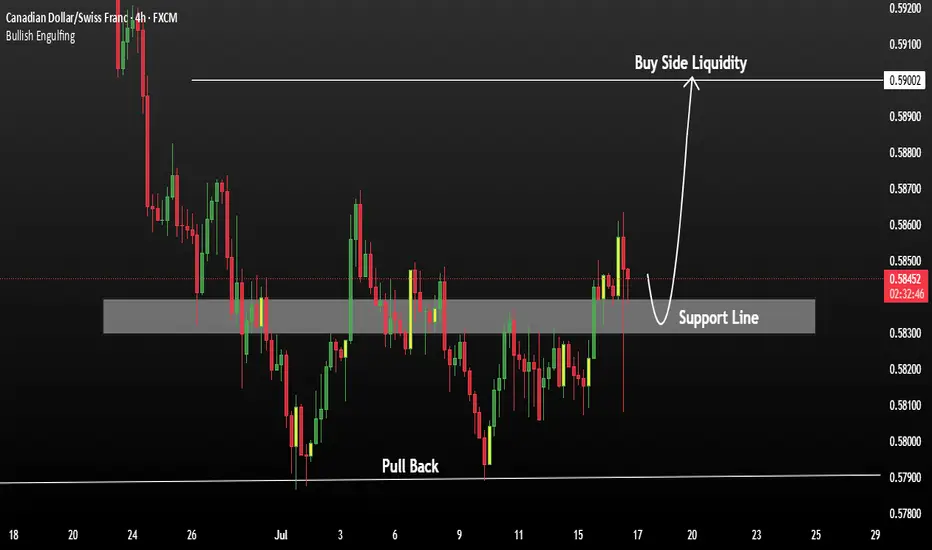
CADCHF Buying Opportunity after Strong Support CADCHF is currently respecting a strong support zone, indicating a potential bullish reversal pattern in development. The structure suggests that most of the downward pressure may be exhausted, and buyers could begin to take control.
Price action shows signs of completing a doubt/uncertainty pattern, reinforcing the base formed at support. A strong resistance level lies near 0.59002. If the 4H candle closes above this level, it may confirm a breakout and open the door for further bullish momentum.
You May find more details in the chart.
Trade wisely best of Luck Buddies.
PS: Support with like and comments for better analysis.
XRPUSD - Why I see that Ripple even higherMedianlines, aka "Forks" have a simple but effective ruleset inherent. These rules describe the movement in certain situations. And of course, the most probable path of wher price is trading to.
Here we a rule in play that projects more movement to the upside, even if BTCUSD has had a strong pullback to the south.
Let's see:
If price is closing above a Centerline, then chances are high that it will retest it. If it holds and starts to continue it's path (to the upside), then the next target is the U-MHL, or the Upper Medianline Parallel, was Dr. Allan Andrews named it back many decades ago.
So, there we have it.
Chances are high that Ripple will reach new highs, with a final target at the U-MLH.

BuyRejection Level
Daily Volume
Market Structure Shift
London Session
Trend Line Break
Untapped Order Point

ETH Short OpportunityETH Short Opportunity 🟥 | Watch 3428 Closely
Ethereum is approaching a key resistance at $3428 — this zone could offer a great short setup if confirmed.
First target on the downside: $3340 📉
High R/R potential if price rejects this level.
Stay sharp and manage your risk!
🔔 Follow me for more real-time trade ideas and technical insights.

SellRejection Level
Daily Volume
Market Structure Shift
London Session
Trend Line Break
Untapped Order Point

1D XRP/USDT Projection, non-operable areaCurrently in the selling zone, I am selling 50% of my XRP capital, possible buyback zones down $3.

SellRejection Level
Daily Volume
Market Structure Shift
London Session
Trend Line Break
Untapped Order Point
COIN (Update) -- Potential Max Price TargetHello Traders!
Coin seems to potentially have a little bit more steam left. If it does make one more push... where will price go?
At $429.54 we have the All Time High for COIN.. interesting enough that price was hit on the first day of trading for COIN which adds to the significance of this price level. There is also a trendline connected from pivot to pivot. These two factors converge and create a significant level of resistance.
Most likely I will be entering a short position at this level.
Thanks everyone and best of luck on your trading journey!

SellRejection Level
Daily Volume
Market Structure Shift
London US Session
Trend Line Break
Untapped Order Point
SellRejection Level
Daily Volume
Market Structure Shift
London Session
Trend Line Break
Untapped Order Point
EURusd short position 18/07/2025English : According to our analysis, we anticipate a bearish scenario.
Morocan Darija : kanchofo d'apres l'analyse dyalna antsanaw hboot
ATENTION : I only share my ideas, not signals

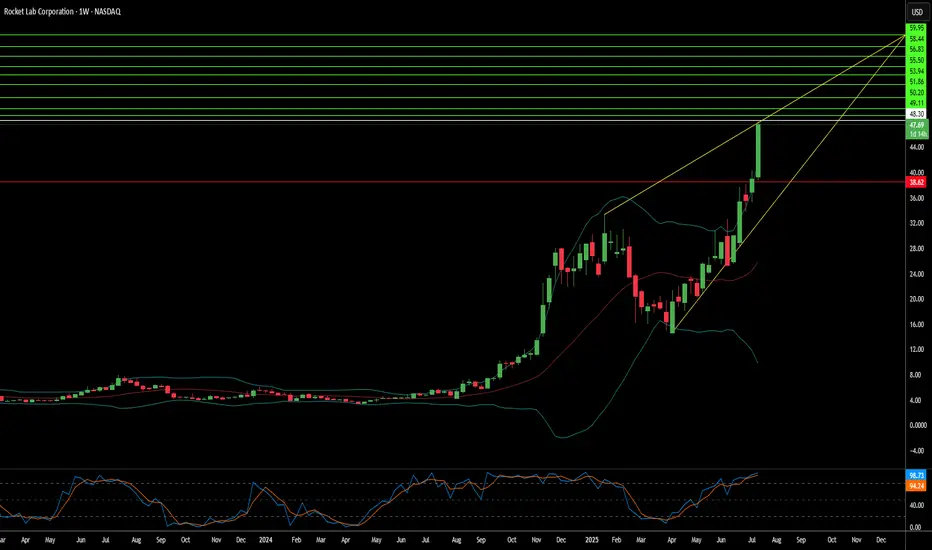
Is Rocket Lab the Future of Space Commerce?Rocket Lab (RKLB) is rapidly ascending as a pivotal force in the burgeoning commercial space industry. The company's vertically integrated model, spanning launch services, spacecraft manufacturing, and component production, distinguishes it as a comprehensive solutions provider. With key operations and launch sites in both the U.S. and New Zealand, Rocket Lab leverages a strategic geographic presence, particularly its strong U.S. footprint. This dual-nation capability is crucial for securing sensitive U.S. government and national security contracts, aligning perfectly with the U.S. imperative for resilient, domestic space supply chains in an era of heightened geopolitical competition. This positions Rocket Lab as a trusted partner for Western allies, mitigating supply chain risks for critical missions and bolstering its competitive edge.
The company's growth is inextricably linked to significant global shifts. The space economy is projected to surge from $630 billion in 2023 to $1.8 trillion by 2035, driven by decreasing launch costs and increasing demand for satellite data. Space is now a critical domain for national security, compelling governments to rely on commercial entities for responsive and reliable access to orbit. Rocket Lab's Electron rocket, with over 40 launches and a 91% success rate, is ideally suited for the burgeoning small satellite market, vital for Earth observation and global communications. Its ongoing development of Neutron, a reusable medium-lift rocket, promises to further reduce costs and increase launch cadence, targeting the expansive market for mega-constellations and human spaceflight.
Rocket Lab's strategic acquisitions, such as SolAero and Sinclair Interplanetary, enhance its in-house manufacturing capabilities, allowing greater control over the entire space value chain. This vertical integration not only streamlines operations and reduces lead times but also establishes a significant barrier to entry for competitors. While facing stiff competition from industry giants like SpaceX and emerging players, Rocket Lab's diversified approach into higher-margin space systems and its proven reliability position it strongly. Its strategic partnerships further validate its technological prowess and operational excellence, ensuring a robust position in an increasingly competitive landscape. As the company explores new frontiers like on-orbit servicing and in-space manufacturing, Rocket Lab continues to demonstrate the strategic foresight necessary to thrive in the dynamic new space race.
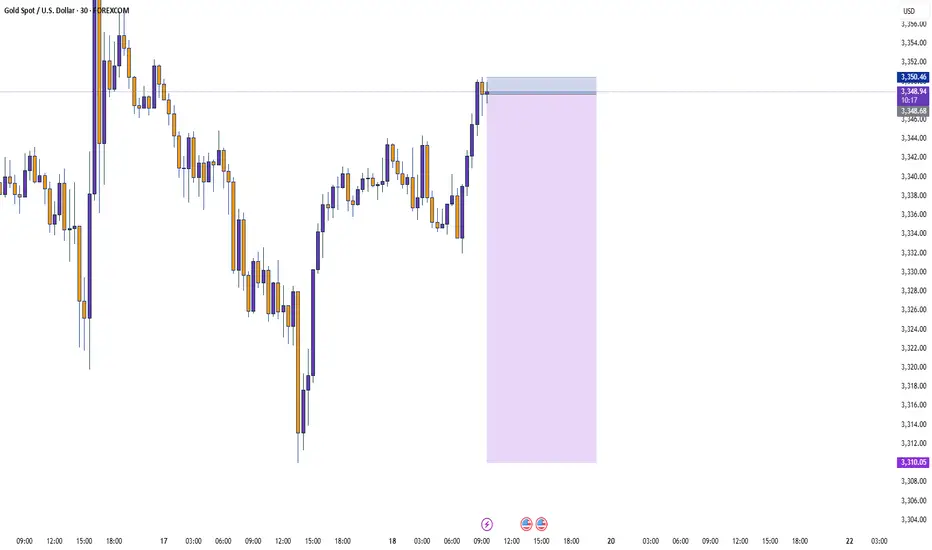
GOLD Price Continue to GrowXAUUSD has formed a bullish pattern after successfully testing and holding the strong support zone at 3310, which marked a key demand level. The recent bounce from this level confirms strong buyer interest despite temporary USD strength.
Demand for gold has sharply increased, often seen as a hedge during uncertain economic periods—even with a temporarily stronger dollar. The current price action reflects a bullish continuation pattern, suggesting potential for further upside. targeting will be 3360 3378 / 3400
You may find more details in the chart Ps Support with like and comments for better analysis.
I am Part of Trade Nations Influencer program and receive a monthly fee for using their Trading view charts charts in my analysis.


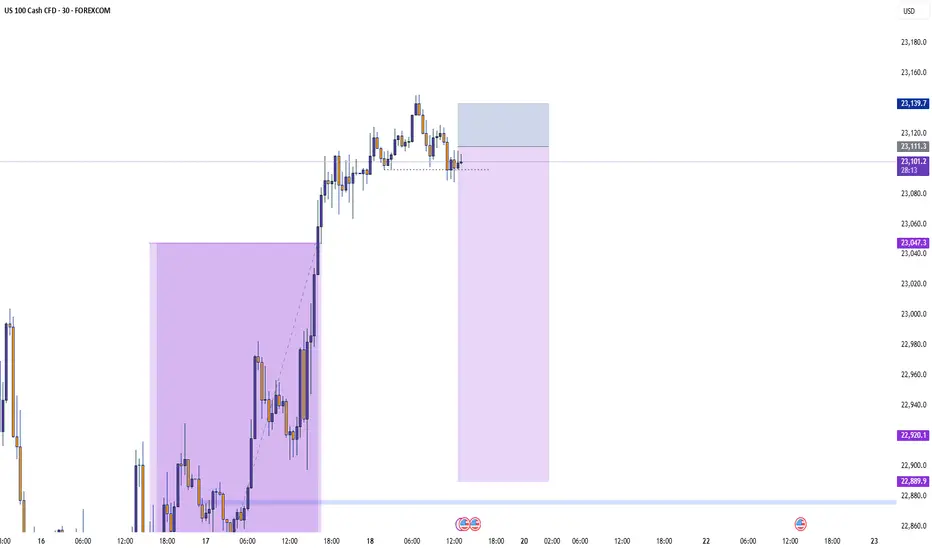
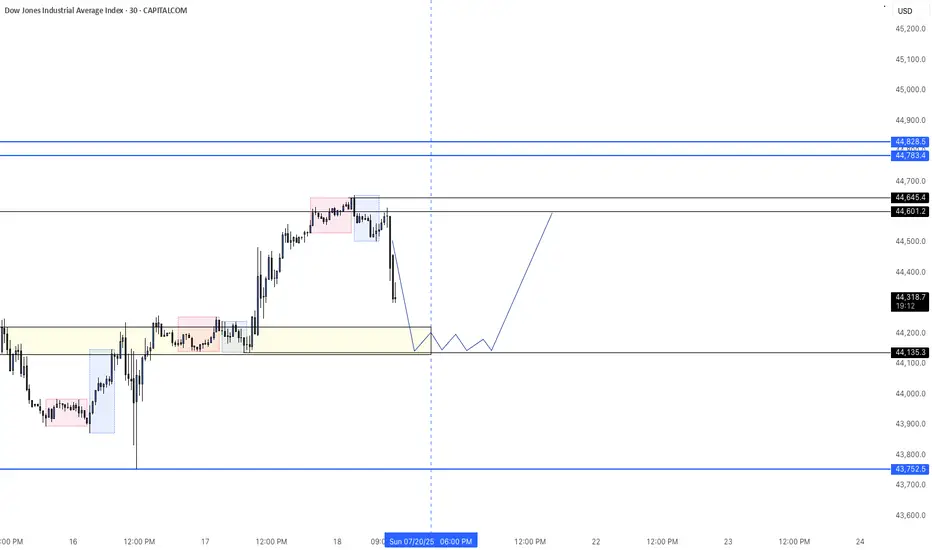
US30 - LONGBearish Friday after price hit a key level high. Price will continue to the downside the remainder of today. Expecting a jump back to today's highs come Monday morning.
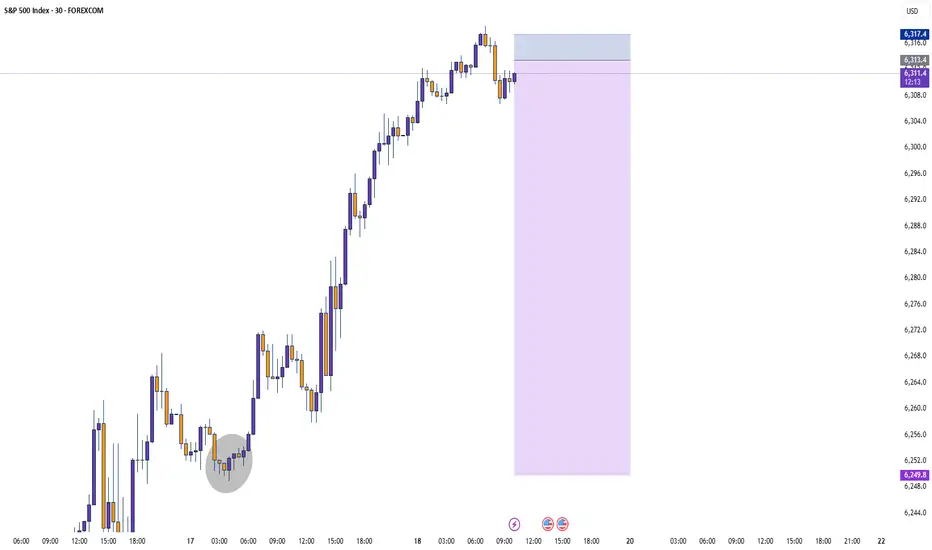
SPX: Long-Term Strength and Opportunity
SPX: Long-Term Strength and Opportunity
The S&P 500 (SPX) on this monthly timeframe clearly illustrates a powerful long-term uptrend, where each significant pullback has consistently presented a valuable buying opportunity. Most recently, the market effectively retested and bounced off the established long-term trendline, even amidst geopolitical concerns such as the April low experienced when tariffs were announced, underscoring the underlying bullish resilience. This sustained trajectory suggests continued upward momentum, reaffirming the 'buy the dip' strategy within this robust market environment.
Disclaimer:
The information provided in this chart is for educational and informational purposes only and should not be considered as investment advice. Trading and investing involve substantial risk and are not suitable for every investor. You should carefully consider your financial situation and consult with a financial advisor before making any investment decisions. The creator of this chart does not guarantee any specific outcome or profit and is not responsible for any losses incurred as a result of using this information. Past performance is not indicative of future results. Use this information at your own risk. This chart has been created for my own improvement in Trading and Investment Analysis. Please do your own analysis before any investments.

BTCUSD - Exhausted? Second time rejected, now down.BTCUSD got rejected at the Centerline the second time. This is super bearish. If it's closing below yesterdays low, that's a clear short signal to me.
Taking 50% gains off the table is never bad. Because then you still have 50% if it's going up further. Otherwise, you got 50% booked.
Don't let gree eat your brain §8-)

BTC AI Prediction Dashboard - 6h Price Path (17.07.25)
Prediction made using Crypticorn AI Prediction Dashboard
Link in bio
BTCUSDT Forecast:
Crypticorn AI Prediction Dashboard Projects 6h Price Path (Forward-Only)
Forecast timestamp: ~10:30 UTC
Timeframe: 15m
Prediction horizon: 6 hours
Model output:
Central estimate (blue line): -119,394
Represents the AI’s best estimate of BTC’s near-term price direction.
80% confidence band (light blue): 118,475 – 119,566
The light blue zone marks the 80% confidence range — the most likely area for price to close
40% confidence band (dark blue): 117,621 – 120,336
The dark blue zone shows the narrower 40% confidence range, where price is expected to stay with higher concentration
Volume on signal bar: 121.96
This chart shows a short-term Bitcoin price forecast using AI-generated confidence zones.
Candlesticks reflect actual BTC/USDT price action in 15-minute intervals.
This helps visualize expected volatility and potential price zones in the short term.
