ETH Update – Eyes on the $3,820 Zone📈 ETH Update – Eyes on the $3,820 Zone
Ethereum is showing bullish momentum, and there’s a strong chance it could rally toward the orange resistance line around $3,820.
If price breaks above this level, the next target will be the blue trendline, marking the next key resistance.
🚀 Stay ready — momentum is building.
🔔 Follow for more clean setups and real-time analysis!
Beyond Technical Analysis

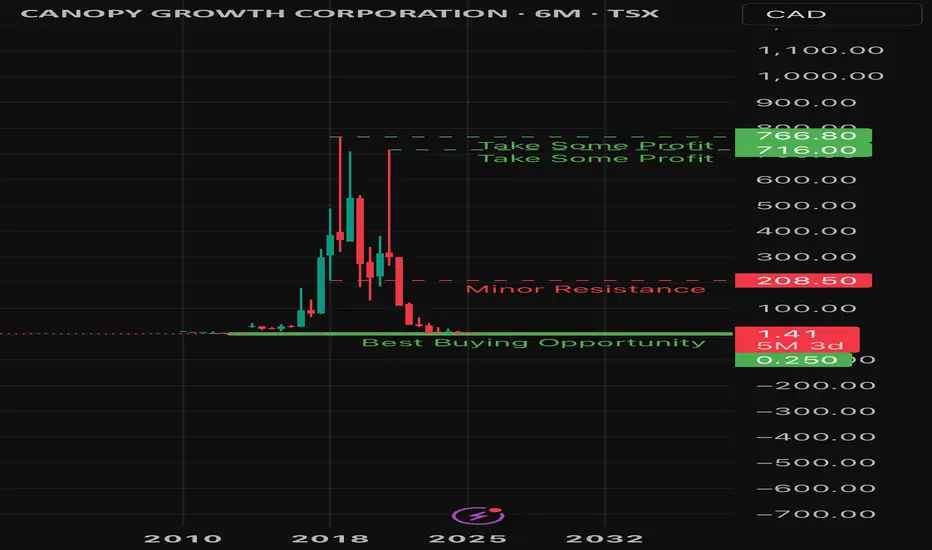
$WEEDIf I am to plant seeds, it would be WEED! WEED! WEED! And some more WEED! I’d sell the house, to lay some plots, to buy some seeds to plant some WEED!
$0.25 at best but anywhere at these lows seems safe.
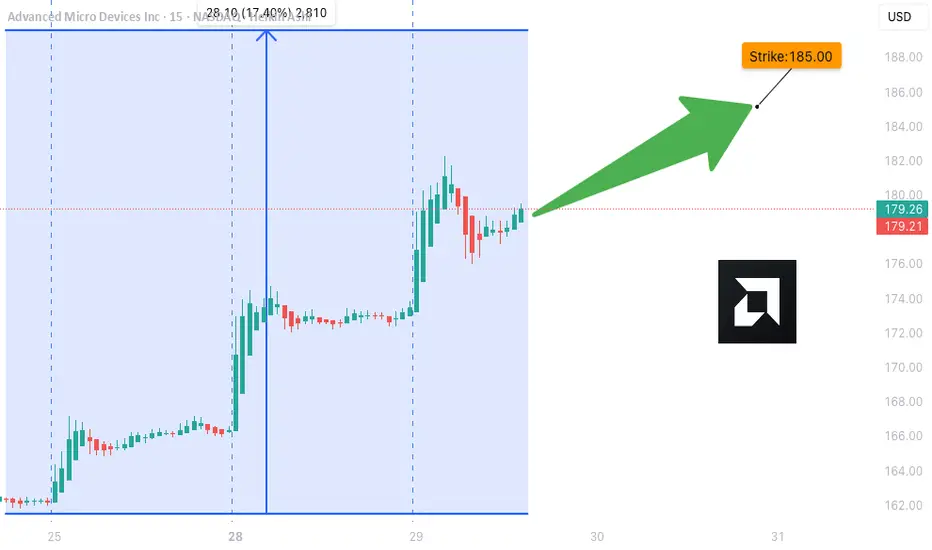
AMD Weekly Trade Alert (2025-07-29)
**🔥 AMD Weekly Trade Alert (2025-07-29) 🔥**
💹 *Momentum Confirmed. Calls Loaded. Let’s Ride.*
📈 **Key Bullish Signals**
✔️ Daily RSI: **83.2** (Rising)
✔️ Weekly RSI: **79.9** (Rising)
✔️ Call/Put Ratio: **2.03** 🧨
✔️ Volatility: Low (VIX = 15.2)
⚠️ Volume Weak (0.9x) – But not a dealbreaker.
---
**🎯 TRADE SETUP**
🔹 **Ticker**: \ NASDAQ:AMD
🔹 **Strategy**: Weekly Naked Call
🔹 **Strike**: \$185C
🔹 **Entry**: \$0.66
🔹 **Profit Target**: \$1.32 (100%)
🔹 **Stop Loss**: \$0.33
🔹 **Expiry**: 2025-08-01
🔹 **Size**: 3 Contracts
🔹 **Confidence**: 75%
---
**🧠 WHY THIS WORKS**
🔋 Momentum → STRONG
💰 Institutions are loading up calls
🧘 VIX = calm
⚡ Short gamma risk = fast payoff or cut
---
📢 **Watchlist it. Trade it. Exit fast.**
💬 Comment “🔥AMD” if you’re in.
🔁 Repost if you see \$190 coming.
\#AMD #OptionsTrading #CallOptions #TradingView #WeeklySetup #MomentumPlay #BullishSignal #MarketMomentum
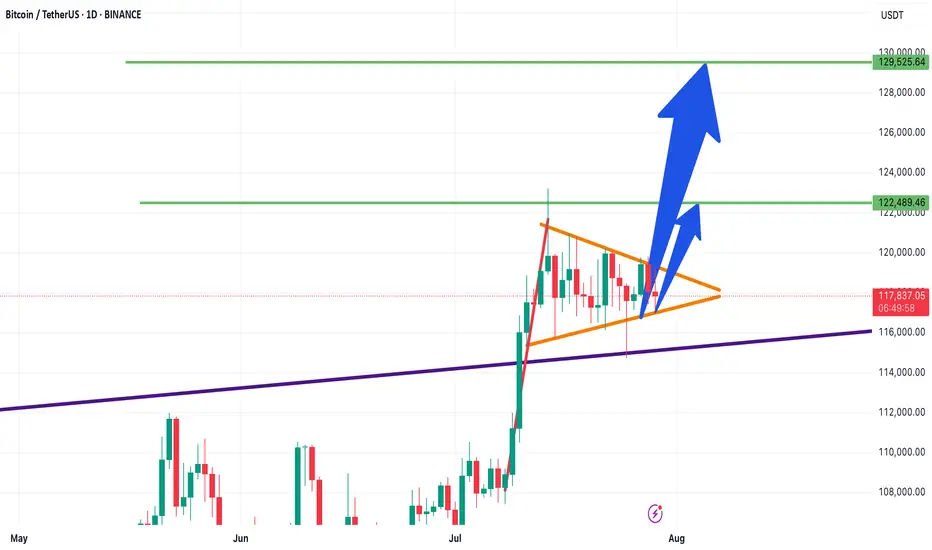
Bitcoin Technical Analysis – Bullish Flag- Symmetrical Triangle📊 Bitcoin Technical Analysis – Bullish Flag or Symmetrical Triangle?
📅 Analysis Date: July 29, 2025
As shown in the chart, Bitcoin appears to be forming a bullish flag or symmetrical triangle pattern—often seen after strong upward moves.
🔹 Bullish Scenario:
If the price breaks above the triangle, the first target is around $122,480, followed by a potential second target near $129,500, based on the length of the flagpole.
🔹 Bearish Scenario:
If the triangle breaks to the downside, the first support to watch is $115,230.
🧭 These key levels act as critical zones of supply and demand, so be sure to keep them on your chart!
🔥 Follow me for real-time setups, clear signals, and expert technical analysis!
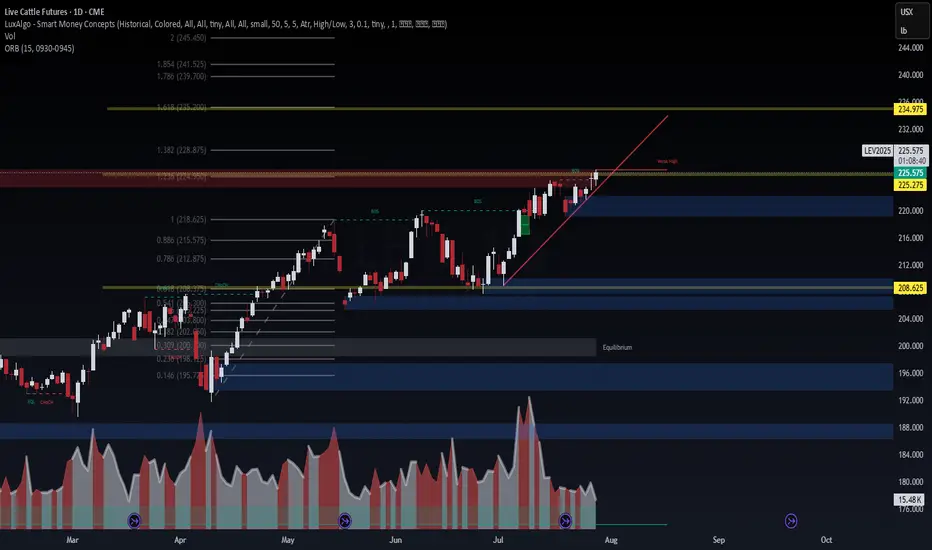
Live Cattle Futures (LEV2025) – Approaching Breakout Zone🐄 Live Cattle Futures (LEV2025) – Approaching Breakout Zone
WaverVanir DSS models show LEV2025 pushing into a key resistance band near 225.65–228.87 — the "weak high" zone where institutional sellers previously stepped in. Price remains in a clear bullish structure with clean BOS and rising demand.
🔍 Chart Structure Highlights:
📈 Trendline support holding since early June
🟨 Price sitting just below 1.382 Fib (228.87) – strong resistance
🟩 If broken, next fib extensions align at:
TP1: 234.97
TP2: 239.70
TP3: 245.45
🟦 Key downside structure support = 208.62 (CHoCH zone)
🧠 Options Flow (Aug–Dec 2025)
🟢 Call Buying: 224C, 225C, 226C, 242C – strong bullish pressure
🔴 Put Selling: 224P, 222P, 210P – income strategies defending downside
💡 Flow favors continuation higher, but many traders capping profits → suggests grind higher, not a parabolic run yet
📈 Strategy Insight
VolanX DSS bias: Bullish with caution
Break above 228.87 confirms squeeze toward 234–240 range
Failure to break = short-term fade back to 218–212 support band
🎯 Watch Levels
Breakout Confirm: Close above 229.00
Invalidation: Daily close below 218.62
Next Target Zone: 234.97 – 239.70 (1.618–1.786 extension)
#LEV2025 #LiveCattle #SMC #VolanXProtocol #CommodityFutures #OptionsFlow #FibStrategy #WaverVanir #DSS #Agriculture #MacroTrading #CMEFutures
Perfect Wicoff pattern..XRP is showing this structure with clear volume confirmation, strong support/resistance reactions, and a spring phase — it would be considered a “perfect” Wyckoff accumulation pattern.

Why Are Markets Rising Despite the Tariffs?Because of the
1) Set timeline on finalizing the tariff rates and
2) The ongoing negotiations,
They aimed at striking a balanced deal between the U.S. and its trading partners.
The Liberation Day tariffs were announced on 2nd April, and markets initially crashed in response. However, just seven days later, on 9th April, the U.S. postponed the higher tariff increases for most countries by 90 days. Since then, markets have rebounded and even broken above their all-time highs set in December last year.
Now that the dust is settling with the expiration of timeline and ongoing negotiations, the big question is:
Where will the markets head next?
Mirco Nasdaq Futures and Options
Ticker: MNQ
Minimum fluctuation:
0.25 index points = $0.50
Disclaimer:
• What presented here is not a recommendation, please consult your licensed broker.
• Our mission is to create lateral thinking skills for every investor and trader, knowing when to take a calculated risk with market uncertainty and a bolder risk when opportunity arises.
CME Real-time Market Data help identify trading set-ups in real-time and express my market views. If you have futures in your trading portfolio, you can check out on CME Group data plans available that suit your trading needs www.tradingview.com

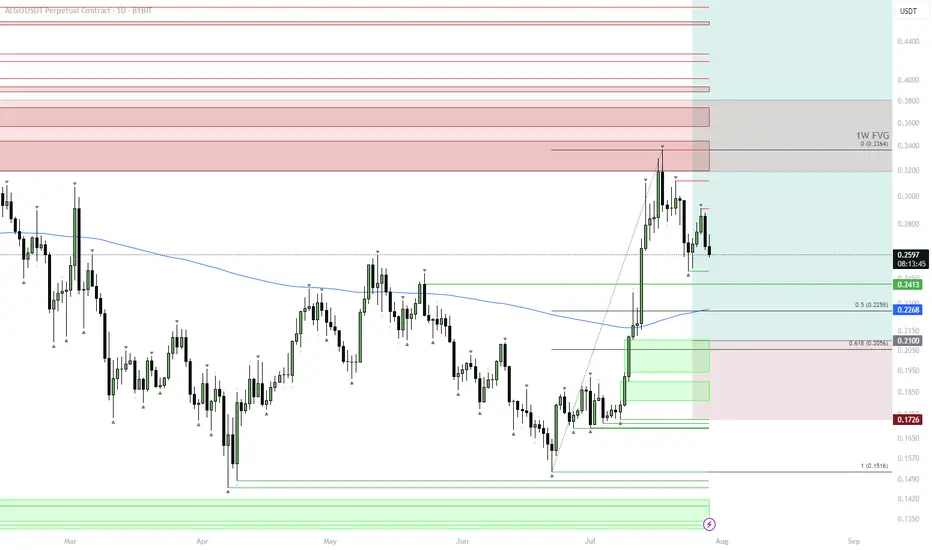
ALGO | #1D — Building the Spot Position LowerALGO has completed its first local move and is now retracing toward key support levels. The price remains under the 200DMA and is heading into the first cluster of demand zones.
Step-by-Step Price Scenario:
Initial Support: Watch the 0.2413–0.2268 zone — this is the first area to scale in spot buys.
Main Accumulation: If price drops deeper, the main spot buy window is $0.22–0.20 (0.5–0.618 retracement of the recent rally and the main demand block).
Invalidation: Breakdown below $0.1726 would invalidate the spot strategy and suggest deeper downside.
Bullish Confirmation: A strong reaction from either of these support levels, followed by reclaiming the 200DMA, would set up the next move toward $0.33–$0.35.
Why this plan:
Buying spot on pullbacks into HTF demand with clear invalidation below keeps risk defined, and the current market structure allows for compounding if the trend resumes.
DE40 Breakout Robbery – Bullish Setup Revealed!💣 DE40 / GER40 INDEX BREAKOUT RAID 🚨
🌟 Hi! Hola! Ola! Bonjour! Hallo! Marhaba! 🌟
Dear Market Robbers, Money Makers, and Chart Bandits 🕶️💰💣,
We’re rollin' out our latest Thief Trader Heist Plan based on laser-sharp technical + fundamental recon 🧠💼 on the Germany DE40 / GER40 Index. It’s time to gear up and break the resistance vault 🏦💥
🎯 THE MASTER HEIST SETUP: LONG ONLY 🎯
📈 Entry Setup:
"The heist is on! Wait for breakout & retest near 24600 🔓.
Once confirmed, GO BULLISH and snatch that market loot!"
✅ Use Buy Stop above resistance
✅ (OR) Buy Limit from pullback zones using 15m–30m swing lows/highs
🎯 DCA / Layered limit entries for optimal robbery!
🔔 Set Alerts: Don't sleep on this! Mark your alarms to catch the breakout.
🛑 STOP LOSS: PLAY IT SMART, NOT EMOTIONAL
🗣️ "Don’t drop your SL before the breakout—wait for the confirmation candle. Place it smart based on your entry lot size & risk."
📍Thief SL Plan: Below the recent 4H wick swing low – around 21700
🔒 Protect the loot once you're in the trade!
🏁 TARGET: TIME TO ESCAPE THE SCENE
🎯 Primary Profit Vault: 25500
🛫 Escape earlier if signs of resistance emerge. A clean get-away is the goal!
🔪 SCALPERS MODE: ONLY LONG SIDE
💰 Got the funds? Feel free to enter early.
💼 Otherwise, team up with swing traders. Use Trailing SL to guard your treasure.
🔎 FUNDAMENTALS BACKING THIS HEIST
📊 GER40 shows bullish momentum backed by:
Global macro optimism
Strong Eurozone data
Risk-on flows into European indices
Technical chart breakout formations
📰 Get full market breakdowns (COT, Macro, Intermarket, Sentiment, etc.) – Check your trusted sources and confirm your targets.
🚨 TRADING ALERT: STAY ALERT DURING NEWS
⚠️ Big news = high volatility! Follow the robbery code:
Avoid new trades during major news drops
Trail SLs on running positions
Stay glued to live updates!
❤️ SUPPORT THE THIEF CREW
If this plan helped you, hit that BOOST 🚀
Let’s keep raiding the charts, stacking profits like pros 🏆
Join the Thief Crew, where we rob the market... not dreams.
🎭 Until the next plan… stay sneaky, stay profitable. 🐱👤💸💥

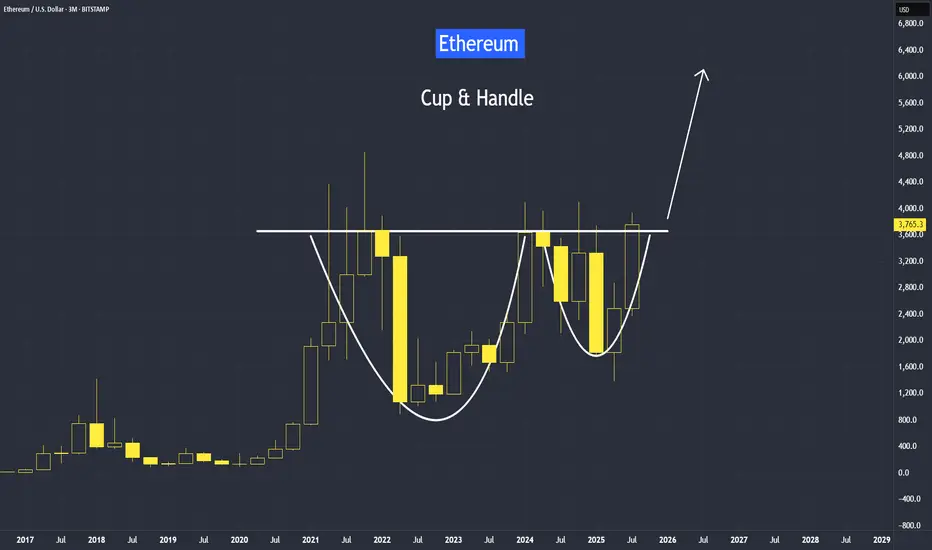
Cup and Handle Setup in Ethereum Since April trough, Ethereum has risen by 179%, delivering a higher rate of return than Bitcoin at 66%.
But most of our attention is on Bitcoin, breaking above the 120,000 level.
Why is Ethereum quietly gaining ground —and what does the future hold for Ethereum?
It's video version on its trading strategies:
Mirco Bitcoin Futures and Options
Ticker: MET
Minimum fluctuation:
$0.50 per ether = $0.05 per contract
Disclaimer:
• What presented here is not a recommendation, please consult your licensed broker.
• Our mission is to create lateral thinking skills for every investor and trader, knowing when to take a calculated risk with market uncertainty and a bolder risk when opportunity arises.
CME Real-time Market Data help identify trading set-ups in real-time and express my market views. If you have futures in your trading portfolio, you can check out on CME Group data plans available that suit your trading needs www.tradingview.com

EURNZD Update: This short trigger could spark a waterfall dropYo traders, Skeptic from Skeptic Lab! 🩵 EURNZD just broke its daily upward trendline, setting up a sharp drop. Weekly shows a fading uptrend. Daily’s got a strong bearish candle, full body, no buyer fight. 4H trendline broke and... more on this video:)
👀Beware of fakeouts this week—volatility’s high! Trade smart, keep risk tight, and don’t FOMO. Share your thoughts in the comments, boost if it helps <3

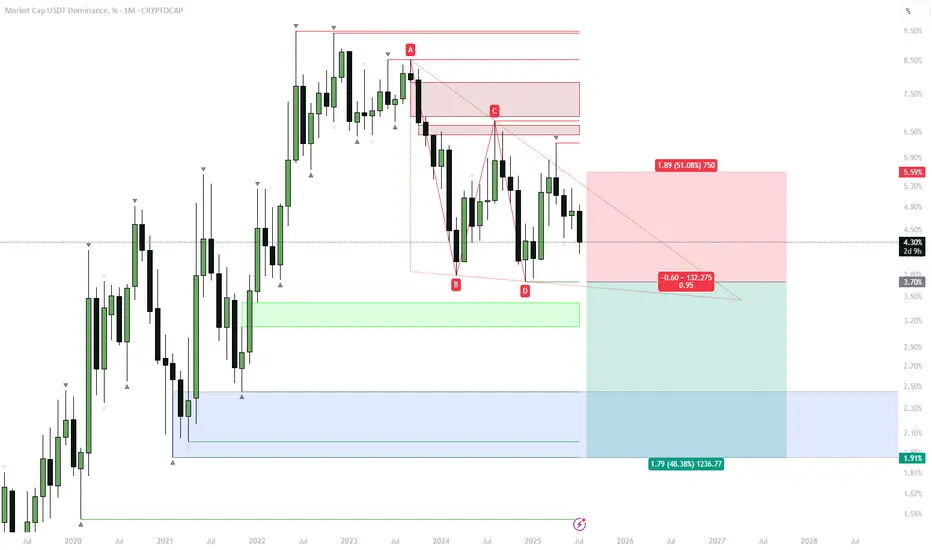
USDT.D | Macro Breakdown on the Horizon?From a monthly perspective, CRYPTOCAP:USDT.D is showing a textbook bearish descending triangle at the top — right after a decade-long uptrend. Price has repeatedly failed to break above resistance, forming a series of lower highs and consistent support.
Scenario:
If the support gives way and this pattern confirms, we could see a multi-year unwind, with the next major target down at 1.9–2.0%.
The first zone to watch for a reaction is around 3.7–3.8%, but the main macro demand sits much lower.
Why this matters:
A breakdown in USDT dominance typically coincides with a massive rotation into risk-on assets and altcoins — the end of a cycle in stablecoins often sparks the next big phase of the crypto bull market.
Plan:
Watch for confirmation of the breakdown on a monthly close below 3.7%.
Until then, this is just a setup — not a trigger.
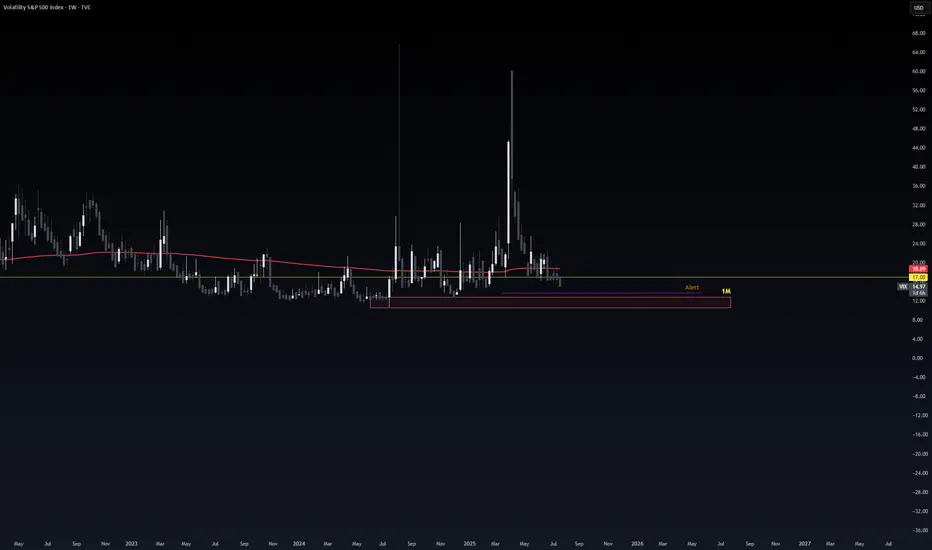
VIX Alarting !when VIX Reach Red Zone.
It consider as Extreeemeee Greeeed !!.
100% market will take U-Turn direction which will be Red in Up coming days !
although im day trading im good and never keep money in market after close.
PUMP | #4h #long — Watching for Breakout Confirmation Early signals for a reversal, but not rushing in.
Some clear bullish divergence on the 4h RSI — first positive sign after an extended downtrend. Price can pop from here, but my plan is to wait for a break and hold above the 4h Order Block + MSS zone (red box) before taking any long entry.
Confirmation is key — I only want to get involved if we reclaim this area with momentum.
Scenario:
If we get a strong breakout and close above the red OB + MSS zone, that’s the first entry trigger for a potential trend reversal.
Until then — standing aside, letting the setup prove itself.
Reasoning:
Bullish RSI divergence often marks the beginning of a reversal, but without a structural breakout, the move can easily fail.
Patience pays off in these high-risk, low-liquidity coins.

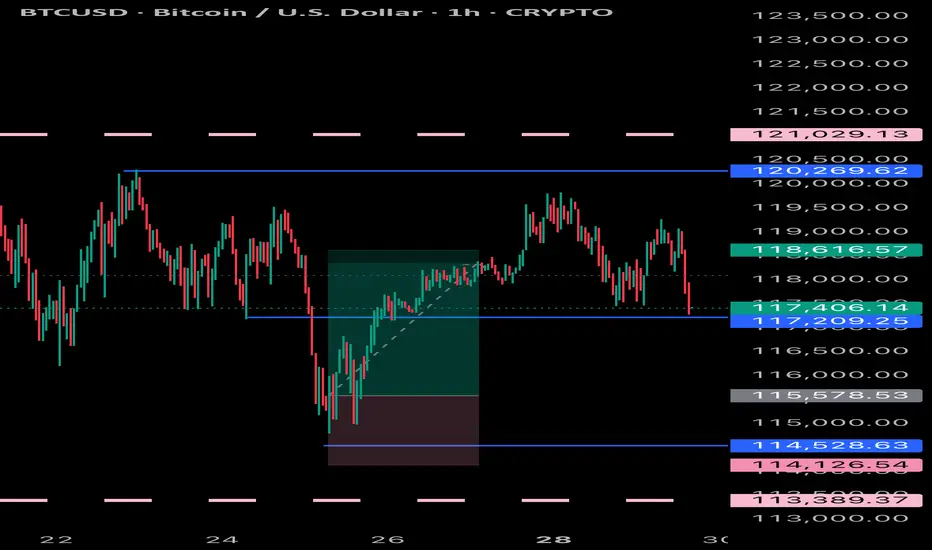
Bitcoin Weekly Recap & Gameplan | 27.07.2025📈 Market Context:
Bitcoin maintained its bullish momentum, driven by continued institutional demand and a supportive U.S. policy backdrop.
Last week’s gameplan played out well — solid profits were captured (see linked chart below).
🧾 Weekly Recap:
• Price made a bullish retracement into the Weekly FVG (purple line) exactly as projected in last week's post.
• From here, I expect continuation toward new all-time highs.
📌 Technical Outlook:
→ First, I expect a short retracement and a 4H swing liquidity grab at 117,828$.
→ Then, a strong continuation move toward ATH targets.
🎯 Setup Trigger:
Watch for:
✅ 4H liquidity sweep
✅ 15M–30M bullish break of structure (BOS)
This is the confirmation zone for potential long setups.
📋 Trade Management:
• Stoploss: Below confirmation swing low
• Targets:
– 120,938$
– 123,400$
💬 Like, follow, and drop a comment if this outlook helped — and stay tuned for more setups each week!

Bitcoin Decision Time Closing - Pump to $150K, or $100K Retest?Here we see a clear trendline that bitcoin must hold. A breakdown could lead to a retest of the 100-110K levels. If we can hold this trendline until August 15th, the odds of a bullish continuation will increase.

long position sighted on EURUSDEUR/USD – Price Approaching Key Demand Zone | 4H SMC Analysis
Pair: EUR/USD
Timeframe: 4H (4Hour)
Bias: Bullish Reversal Watch at Demand
Strategy: Smart Money Concepts (SMC)
Status: Monitoring price action at demand for possible long setup.
Market Structure Overview
The EUR/USD pair recently showed a bearish shift in structure after failing to hold the bullish trend that began mid-June.
* Initial bullish structure is visible with a clear Break of Structure (BOS) to the upside.
* The rally created a Fair Value Gap (FVG) and left behind a well-defined Demand Zone.
* After the BOS, price retraced and respected the demand before making new highs.
* Eventually, price failed to make a new high and started forming lower highs and lower lows, shifting momentum bearish.
Current Price Action
* Price has aggressively dropped from the previous supply area (highlighted in red) and is now approaching a key demand zone around 1.1485–1.1447.
* This zone coincides with:
* A previous FVG fill area.
* The base of the last strong impulsive move up.
* Consolidation and accumulation structure before the bullish breakout.
Key Zones
* Demand Zone: 1.1485 – 1.1447
* This zone represents an institutional buying area.
* Looking for potential bullish reaction from here.
* Supply Zone: Around 1.1818 – 1.1834
* Last zone of distribution before price dropped.
Possible Scenarios
Bullish Reversal
* Price shows rejection candles, internal bullish BOS, or engulfing pattern within demand.
* A long entry could be considered with:
* Stop Loss just below demand zone.
* Targets: Previous highs at 1.1726 and 1.1818.
Bearish Continuation
* If price breaks and closes below the demand, it invalidates the bullish idea.
* Expect continued bearish pressure toward 1.1400 or lower.
* Look for a potential retest of broken demand as new supply.
SMC Concepts in Use
* BOS (Break of Structure): Used to identify market shifts.
* FVG (Fair Value Gap): Spotting inefficiencies to anticipate retracements.
* Demand Zone: Watching for institutional buying and smart money footprints.
Trade Plan Summary
| Element | Value |
| Entry | Upon bullish confirmation in demand |
| Stop Loss | Below 1.1447 (zone invalidation) |
| Target 1 | 1.17265 |
| Target 2 | 1.18182 |
| Invalidated if | Price closes below demand zone |
Conclusion
We’re at a make or break level for EUR/USD. Price is testing a major demand zone with confluence from structure, FVG, and past bullish movement. Watching for reaction before taking action. Risk managed entries only.

Check if the second step-up trend can be maintained
Hello, traders.
If you "Follow" us, you'll always get the latest information quickly.
Have a great day.
-------------------------------------
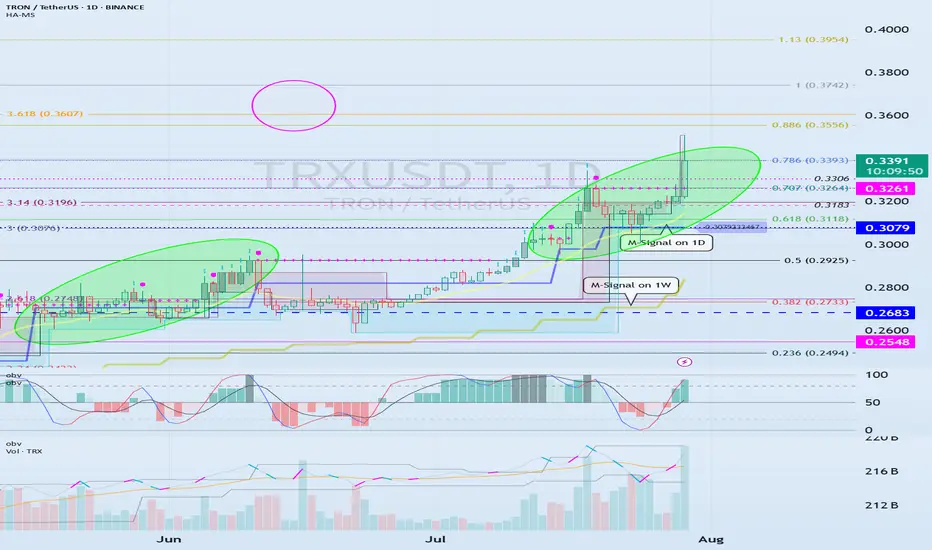
(TRXUSDT 1M Chart)
We need to see if the price can sustain itself by rising above the left Fibonacci level 3.618 (0.3607) and the right Fibonacci level 1 (0.3742).
When the next monthly candlestick is formed, we need to check the movements of the supporting indicators.
-
(1W Chart)
The DOM (60) indicator on the 1W chart is showing signs of forming a new trend.
Accordingly, we need to examine whether a rise above the left Fibonacci level of 3.618 (0.3607) will trigger a new wave.
The left Fibonacci level was created during the first rising wave.
Therefore, if the price rises above the left Fibonacci level of 3.618 (0.3607), a new wave is expected to form.
Since the HA-High indicator on the 1W chart is formed at 0.2683, if the price declines, support near 0.2683 will be crucial.
-
(1D chart)
If the price maintains above the 0.3079-0.3261 range, further upside is expected.
For the price to rise above the left Fibonacci ratio of 3.618 (0.3607) and the right Fibonacci ratio of 1 (0.3742), the OBV indicator of the Low Line ~ High Line channel must rise above the High Line and remain above it.
However, since the StochRSI indicator has entered an overbought zone, the upward movement may be limited.
Therefore, we need to consider how to reset the indicator.
-
The price is continuing a stepwise upward trend, rising above the HA-HIgh indicator.
It is currently in its second stepwise upward movement.
Therefore, the key is whether the price can sustain above the HA-High indicator.
Whether a third stepwise upward movement occurs will depend on whether the price can sustain itself around or above the 0.3079-0.3261 level.
-
Thank you for reading to the end.
I wish you successful trading.
--------------------------------------------------
- Here's an explanation of the big picture.
(3-year bull market, 1-year bear market pattern)
I'll explain more in detail when the bear market begins.
------------------------------------------------------
USDJPY long position 29/07/2025English : According to our analysis, we anticipate a bearish scenario.
Morocan Darija : kanchofo d'apres l'analyse dyalna antsanaw hboot
ATENTION : I only share my ideas, not signals
if TP1 hit i will move SL to BE

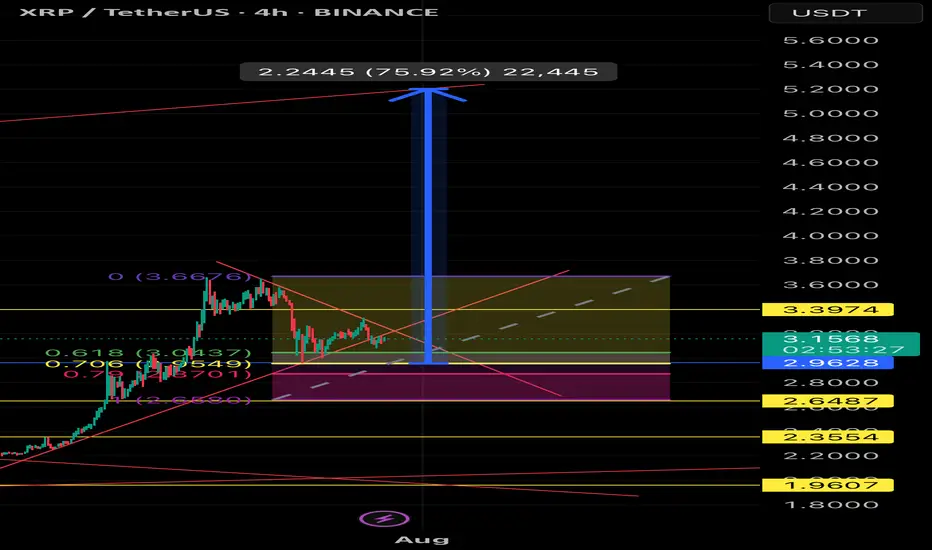
XRPUSDT Bullish Breakout Setup – 4H Chart, Fibonacci golden areaEntry: 3.16 (current level)
🛡️ Stop Loss: 2.9 (below range support)
🎯 Targets:
• TP1: 3.39 (local resistance)
• TP2: 4.50
• TP3: 5.40
• TP4: 5.90 (final target from wedge breakout – +75%)
🔍 Setup Details:
XRP is forming a bullish pennant after a strong rally. Price has held key Fibonacci retracement levels and is currently consolidating inside a wedge. A confirmed breakout could lead to a 75% move toward the $5.9 target. Volume confirmation and breakout candle close above $3.39 can accelerate the move.
⚠️ High volatility expected. Use proper risk management.
#XRPUSDT #CryptoAnalysis #Altcoins #TechnicalAnalysis #BreakoutAlert
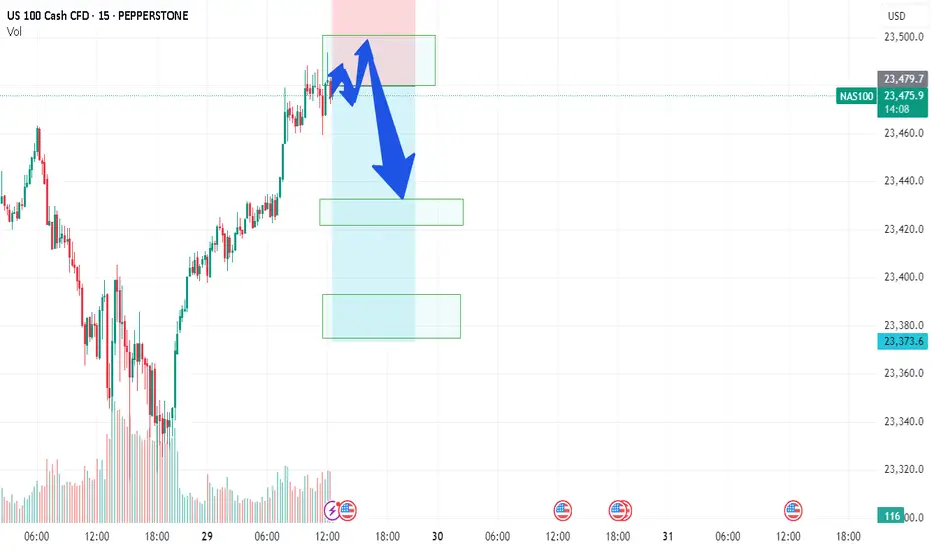
NAS/TEC100 - LETS GET NASTY ON NAS100Team, NAS currently sitting at 23480, before the US market open
however during the market open, please be aware of the volatility that may hit your stop loss
You have 2 options to trade on this NAS- NASTY
Option 1: wait for market open, if it hits 23500-23515 - then short with stop loss at 23580
Option 2: Short at the current market with small volume - and if the market open with volatile, you can take another advantage of shorting more volume as per option 1 instructed.
OK, pick your strategy! do NOT be shy.
I am going to have small short position and will consider adding more during US market opening after 5-10 minutes, much easier to see the direction of the market - we do LIVE trading everyday. Please note: if NAS fall below 23450-40 bring stop loss to BE (Break even)
1st TARGET range: 23435-23416 - make sure take 70% volume
2nd target at 23390 to 23376
Why do I short on NAS when tomorrow rate decision, i think this quarter report, market will not be the same as last quarter, even rate cut!