TLRY Earnings Play: Lotto-Style PUT Setup
📉 **TLRY Earnings Play: Lotto-Style PUT Setup**
*Tilray Brands (TLRY) - Earnings Due July 30 (AMC)*
🔻High risk. High reward. Possibly… nothing. But here's the setup:
---
### 🔬 Fundamental Breakdown:
* 💸 **TTM Revenue Growth**: -1.4% (🚩 declining)
* 📉 **Profit Margin**: -114.4%
* 🧾 **Operating Margin**: -16.8%
* 🧠 **EPS Surprise (avg 8Q)**: **-89.4%**, with only **12% beat rate**
* 🧯 **Sector Risk**: Cannabis = Over-regulated + Overcrowded
🧮 **Fundamental Score**: 2/10 → Broken business model.
---
### 📊 Technicals:
* 🔺 Above 20D MA (\$0.61) and 50D MA (\$0.49)
* 🔻 Well below 200D MA (\$0.91)
* 📉 Volume 0.72x = Weak institutional interest
* 📏 RSI: 57.69 (neutral drift)
**Technical Score**: 4/10 → Weak drift, low conviction.
---
### ⚠️ No Options Flow. No Big Bets Seen.
(But that’s exactly what makes this a clean lotto...)
---
## 🎯 Lotto Trade Idea:
```json
{
"Type": "PUT",
"Strike": "$0.70",
"Expiry": "Aug 1, 2025",
"Entry": "$0.10",
"Profit Target": "$0.50",
"Stop Loss": "$0.035",
"Confidence": "30%",
"Size": "2% portfolio max",
"Timing": "Pre-earnings close"
}
```
---
### 🧠 Strategy:
This is not a trade based on strength. It’s based on **TLRY’s consistent failure to deliver** — and if it disappoints again, we ride the downside. If not? Risk tightly capped.
---
⚖️ **Conviction**: 35%
💀 **Risk**: Total loss possible
🚀 **Reward**: 400%+ possible
---
📝 *Not financial advice — just one degenerate’s earnings notebook.*
💬 Drop your TLRY lotto plans below👇
Beyond Technical Analysis

CLS Earnings Play - Bullish Setup (07/28)
📈 **CLS Earnings Play - Bullish Setup (07/28)** 💥
💡 *Earnings Confidence: 75% | Sector: Tech/AI Hardware*
🚀 **THESIS**:
* 🔋 19.9% TTM revenue growth
* ✅ 8-quarter beat streak (avg. +11.5%)
* 📈 RSI > 50D/200D MA → Strong momentum
* 🧠 Sector tailwinds from AI/data infra
* 💬 Analysts lagging price → potential upgrades
📊 **OPTIONS FLOW**:
* 🟢 Calls piling at \$175 (institutions leaning bullish)
* 🛑 Some downside puts at \$170 (hedging only)
* 🧮 IV Rank: 0.65 | Expected Move: ±\$11
🔥 **TRADE PLAN**
> 🎯 **Buy CLS \$175 Call (08/01 Exp)**
> 💵 **Entry**: \$8.80
> 📈 **Profit Target**: \$26.40 (+200%)
> 🛑 **Stop Loss**: \$4.40
> ⏰ **Entry Timing**: *Just before earnings close* (07/30 AMC)
> 💼 **Size**: 2% of portfolio
📉 **Risk**: Moderate IV, downside if earnings miss.
📊 **Reward**: Strong beat history + AI trend = possible upside surprise.
🔔 **Watchlist it now. Execute near close 07/30.**

Gold setupGold us just broken to the downside from the previous uptrend and now we expect the prices to continue pushing towards the downside. the prices are likely to reject from the the current order block but if not, they will probably do on the smaller upper order block as you can see via the analysis

Daily Analysis- XAUUSD (Tuesday, 29th July 2025)Bias: No Bias
USD News(Red Folder):
-JOLTS Job Openings
Notes:
- Strong bearish closure
- Uncertainty on fundamentals
- Potential BUY/SELL if there's
confirmation on lower timeframe
- Pivot point: -
Disclaimer:
This analysis is from a personal point of view, always conduct on your own research before making any trading decisions as the analysis do not guarantee complete accuracy.

Super Sell!Hello all. as you see market reaches to an LOZ and it needs a historical low. As DXY will increasing, it it will falling. Effect of tariff started. be happy and have a super great week(wink)

Ready to go short?!Hello all. I was thinking on GBPUSD. then I found that a Node is left behind. is it possible to left sth. behind at market? I will tell you no. then it is a good Opp to start going short. huge R/R is important here. be happy and have a wealthy life (wink).
and let me tell you sth. """"BE PATIENT""". Today I lose 1.4% of my account just for having no patience.

XAUUSD approaches a strong buy zoneGold is approaching a strong buy area. Aggressive traders set pending orders whereas cautious ones wait for some confirmation signals in the range of such zones. I expect buyers to push price back up for atleast half day today Follow risk management to enjoy your trading journey.
Target1 3374

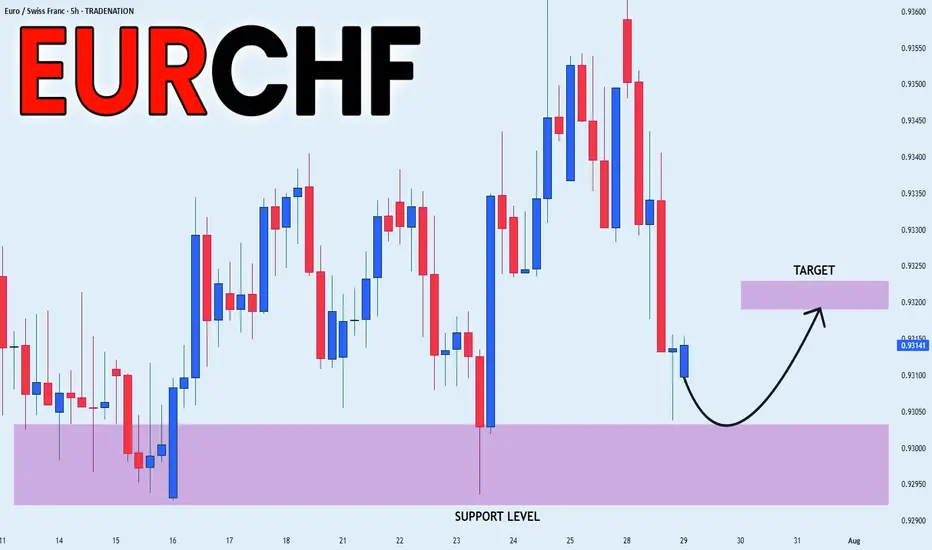
EUR_CHF RISKY LONG|
✅EUR_CHF is set to retest a
Strong support level below at 0.9300
After trading in a local downtrend for some time
Which makes a bullish rebound a likely scenario
With the target being a local resistance above at 0.9320
LONG🚀
✅Like and subscribe to never miss a new idea!✅
Disclosure: I am part of Trade Nation's Influencer program and receive a monthly fee for using their TradingView charts in my analysis.
DXY LOCAL SHORT|
✅DXY is going up now
But a strong resistance level is ahead at 98.948
Thus I am expecting a pullback
And a move down towards the target of 98.451
SHORT🔥
✅Like and subscribe to never miss a new idea!✅
Disclosure: I am part of Trade Nation's Influencer program and receive a monthly fee for using their TradingView charts in my analysis.

NZDUSDT Long Looking to enter NZD/USD around 0.59250 at the Order Block due to a liquidity inducement zone and potential Market Structure Shift (MSS).

USD_CHF SHORT FROM RESISTANCE|
✅USD_CHF has been growing recently
And the pair seems locally overbought
So as the pair is approaching
A horizontal resistance of 0.8064
Price decline is to be expected
SHORT🔥
✅Like and subscribe to never miss a new idea!✅
Disclosure: I am part of Trade Nation's Influencer program and receive a monthly fee for using their TradingView charts in my analysis.

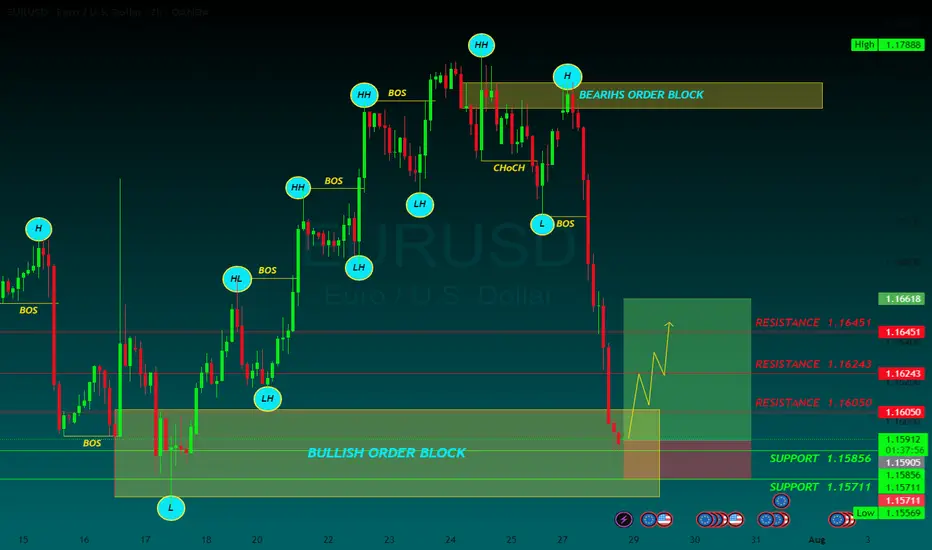
EURUSD BUYThe US Dollar (USD) gapped lower at the weekly opening amid optimism fueling demand for high-yielding assets, following news that the United States (US) and the European Union (EU) reached a trade deal.
The US and the EU agreed a 15% tariff on most European goods entering the US, much higher than the average 4.8% exporters face these days. No rates will apply to EU exports in important sectors, including aircraft parts, some chemicals, semiconductor equipment and some agricultural products.
The EU response to the headline was uneven. European Central Bank (ECB) policymaker Peter Kazimir said on Monday that the trade deal reduces uncertainty, but it is unclear for now how it impacts inflation. However, the French prime minister, François Bayrou, said the EU has capitulated to Donald Trump’s threats, adding it is a “dark day” for the EU. The trade focus now shifts to the US-China as officials from both countries resume talks in Stockholm.
The EUR/USD pair peaked at 1.1771 during Asian trading hours, but changed course early in Europe, with the USD surging across the FX board, resulting in the pair shedding over 100 pips.
The macroeconomic calendar had nothing relevant to offer at the beginning of the week, but will be flooded with first-tier releases, including US employment-related data ahead of the Nonfarm Payrolls report on Friday, the preliminary estimates of the Q2 Gross Domestic Product (GDP) for the US and the EU, and inflation updates. On top of that, the Federal Reserve (Fed) will announce its decision on monetary policy on Wednesday.
RESISTANCE 1.16050
RESISTANCE 1.16243
RESISTANCE 1.16451
SUPPORT 1.15856
SUPPORT 1.15711

Sell,Buy,Sell!Hello all. as you see market structure Talks. it is so beautiful move is running right here. be happy(wink)

DXY dont take these charts serious its just my way to keep myself entertained while finding levels etc.. no your usual boring systematic shiiiteee!! IRISH CRAIC ONLY!!! ☘

SAP - LONG Swing Entry PlanNYSE:SAP - LONG Swing Entry Plan
Entry Zone 1: $283.00 – $282.00
→ Open initial position targeting +8% from entry level.
Entry Zone 2: $274.00 – $273.00
→ If price dips further, average down with a second equal-sized entry.
→ New target becomes +8% from the average of Entry 1 and Entry 2.
Edit Zone : $260.00 – $258.00
→ If reached, enter with double the initial size to lower the overall cost basis.
→ Profit target remains +8% from the new average across all three entries.
Risk Management:
Stop Loss:
Risk is capped at 12% below the average entry price (calculated across all executed positions including the Edit Zone).
Position Sizing Approach:
Entry 1: 1x
Entry 2: 1x
Edit Zone: 2x
→ Total exposure: 4x
→ Weighted average determines final TP and SL calculations.
______________________________________
Legal Disclaimer
The information provided in this content is intended for educational and informational purposes only and does not constitute financial, investment, or legal advice or recommendations of any kind. The provider of this content assumes no legal or financial responsibility for any investment decisions made based on this information. Users are strongly advised to conduct their own due diligence and consult with licensed financial advisors before making any financial or investment decisions.
Sharia Compliance Disclaimer: The provider makes no guarantees that the stocks or financial instruments mentioned herein comply with Islamic (Sharia) principles. It is the user’s responsibility to verify Sharia compliance, and consultation with a qualified Sharia advisor is strongly recommended before making any investment decisions

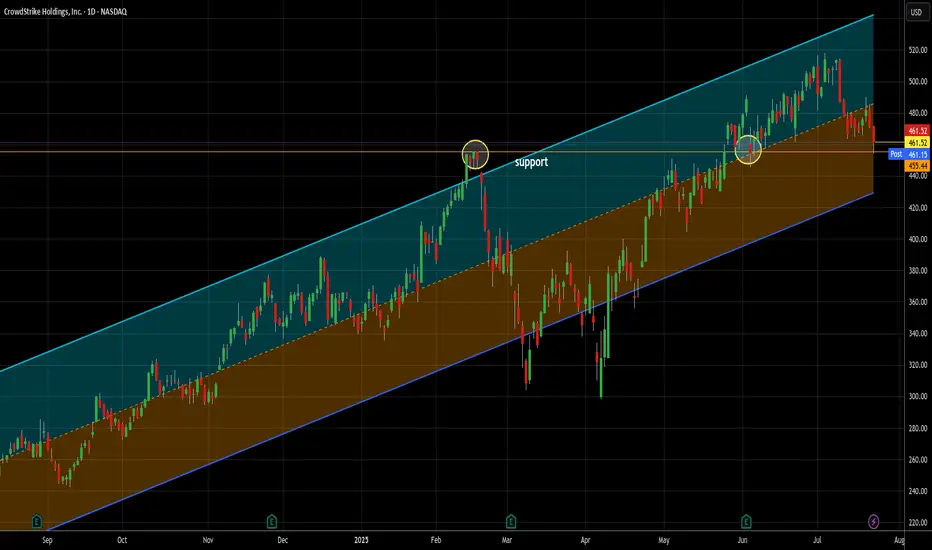
The only way to fight AI is with AI -- long at 461.52I love cybersecurity stocks generally. As our lives become ever more embedded in the electronic world, their necessity increases. As AI driven threats are sure to rise (Sam Altman, founder of OpenAI, spoke to a financial conference this week about the rising threat of AI driven banking fraud), the only way to combat it effectively is with AI. Crowdstrike, along with Palo Alto, are leading the charge in this area and I think will be another great example of AI ultimately being better than humans at the job they need to do here.
Yes, it's a story stock, but you know me - the story is the trading data. So here it is. In the last 12 months, 21 signals. 21 wins, 0 losses. Average trade length = 6.7 days (though that's misleading since all but 4 trades closed in less than that and 20 of 21 were 10 days or less). Average gain was 4.46% - that's an average of .67% per day held. That's almost 16x the long term daily rate of return of SPX and almost 10x the daily return of the Nasdaq 100 in the last year.
Additionally, it bounced off support near today's low and finished stronger. That's always good to see. I will happily add more if my signals suggest it, but of the 21 signals, only once did it produce 2 open lots at once. Nornally, it was one lot paying quickly. 2/3 of the trades closed in less than one week.
As always - this is intended as "edutainment" and my perspective on what I am or would be doing, not a recommendation for you to buy or sell. Act accordingly and invest at your own risk. DYOR and only make investments that make good financial sense for you in your current situation.
Candle Close July 2025I made a post about a draw to sell side. Objective met today. unexpected for a Monday but all good. We could continue lower but it's likely we get a pull back or consolidation considering this is the last week of the month thus a candle close for July 2025. let's watch. I'm gonna stay out for the rest of the week. toodles

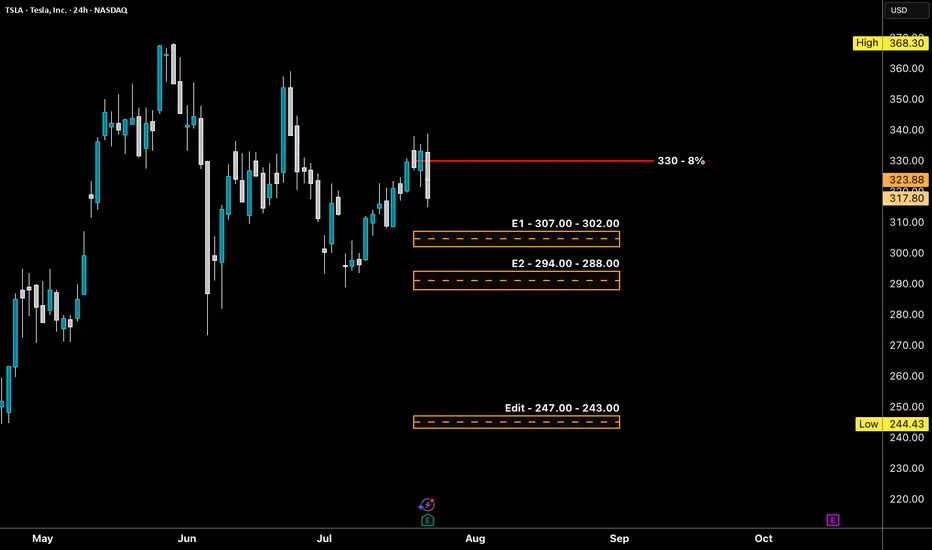
TSLA - LONG Swing Entry Plan NASDAQ:META - LONG Swing Entry Plan
Entry Zone 1: $307.00 – $302.00
→ Open initial position targeting +8% from entry level.
Entry Zone 2: $294.00 – $288.00
→ If price dips further, average down with a second equal-sized entry.
→ New target becomes +8% from the average of Entry 1 and Entry 2.
Edit Zone (Aggressive Demand): $247.00 – $243.00
→ If reached, enter with double the initial size to lower the overall cost basis.
→ Profit target remains +8% from the new average across all three entries.
Risk Management:
Stop Loss:
Risk is capped at 12% below the average entry price (calculated across all executed positions including the Edit Zone).
Position Sizing Approach:
Entry 1: 1x
Entry 2: 1x
Edit Zone: 2x
→ Total exposure: 4x
→ Weighted average determines final TP and SL calculations.
______________________________________
Legal Disclaimer
The information provided in this content is intended for educational and informational purposes only and does not constitute financial, investment, or legal advice or recommendations of any kind. The provider of this content assumes no legal or financial responsibility for any investment decisions made based on this information. Users are strongly advised to conduct their own due diligence and consult with licensed financial advisors before making any financial or investment decisions.
Sharia Compliance Disclaimer: The provider makes no guarantees that the stocks or financial instruments mentioned herein comply with Islamic (Sharia) principles. It is the user’s responsibility to verify Sharia compliance, and consultation with a qualified Sharia advisor is strongly recommended before making any investment decisions
"XAU/USD Gold Heist Plan | Pullback Entry for Big Bullish Move"🔐💰“GOLD HEIST PLAN UNLOCKED: Thief Trader’s XAU/USD Breakout Blueprint”💰🔐
by The Market Robber a.k.a. Thief Trader – Stealing Pips, One Candle at a Time!
🌍 Hey Money Makers, Market Hustlers, Robbers, & Chart Crackers! 🌍
Bonjour! Hola! Marhaba! Hallo! Ola! What's poppin'?
Welcome to another exclusive robbery plan crafted in pure Thief Trading style—built off technicals, fundamentals, market psychology, and a bit of outlaw intuition. 💸⚔️
This one’s for the GOLD DIGGERS – literally. We’re targeting XAU/USD for a high-voltage bullish heist 🎯💥. Stick to the plan, follow the chart, and you might just make it out with a sack full of pips 💰🔥.
🔓 THE SETUP: GET READY TO ROB THE GOLD MARKET
We're eyeing a LONG ENTRY, with clear intent to break past the consolidation zone and avoid the trap laid by the "market police" at the ATR barricade zone 🚨. This level is where overbought drama and bear claws are strongest – we slip in, grab the profits, and bounce before they know what hit ‘em.
🧠 Use caution: This level is filled with liquidity traps, reversals, fakeouts and retail bait zones. Classic Thief style means we know where the guards are sleeping and where the cameras don't reach. 🎥🔕
💸 ENTRY PLAN:
🟢 Entry Zone: Watch for a pullback to 3320.00 or above. Don’t jump early.
💡 Tactics:
Use Buy Limit Orders (DCA / Layered Entry Style)
Drop them in on 15min/30min swing levels – catch price slipping into liquidity
Confirm with minor structure breaks / order block retests
🔔 Set those alerts – the real move happens when the breakout candle hits.
🛑 STOP LOSS STRATEGY:
🧠 Pro Rule: No stop-loss before breakout.
Once breakout confirms:
🔴 SL Zone: Recent swing low (approx. 3280.00) on the 4H chart
🎯 Adjust SL based on:
Lot size
Order count
Risk appetite
You know the game: manage your risk like a pro thief—quiet, calculated, and fast on the getaway. 💨
🎯 TARGET ZONE:
🏁 TP Zone: 3490.00
⚠️ Escape earlier if the pressure gets heavy – smart thieves never overstay the job.
🧲 SCALP MODE:
Only scalp LONG SIDE – don’t get caught chasing shorts unless you're rich enough to burn your drawdown 🔥
🔐 Use trailing SL to secure bags while climbing the ladder.
🧠 FUNDAMENTALS & MACRO EDGE:
The Gold market is currently in a BEAR structure with hints of bullish reversal potential. This heist isn’t just technical – it’s backed by:
🌍 Global Macro Flows
💼 COT Reports
📰 Sentiment & News Risk
💣 Geo-political Heat
📊 Intermarket Analysis (Dollar, Yields, Risk-On/Off correlations)
Dig deep for the full macro breakdown. Knowledge is leverage.
(Find full reports on reputable sources — you know where to look 👀)
🚨 RISK ALERT:
Before, During & After News Releases:
Avoid fresh entries 🔕
Use Trailing SLs to protect live trades
Watch spread spikes & low-liquidity traps
👉 Don't trade when the market's drunk.
💖 SHOW LOVE – BOOST THE PLAN:
💥Smash that Boost Button💥 if you want more precision heist strategies like this. Support the Thief Trading Style, and we’ll keep robbing the markets clean and teaching the crew how to get in & get out profit-heavy. 🏴☠️📈💰
🎭 I’ll be back with another chart crime scene soon. Until then, stay sneaky, stay profitable, and always move like the market’s watching (because it is). 😎
🔐 Thief Trader Out. Rob. Exit. Repeat. 🔁💸

Trading as a Probabilistic ProcessTrading as a Probabilistic Process
As mentioned in the previous post , involvement in the market occurs for a wide range of reasons, which creates structural disorder. As a result, trading must be approached with the understanding that outcomes are variable. While a setup may reach a predefined target, it may also result in partial continuation, overextension, no follow-through, or immediate reversal. We trade based on known variables and informed expectations, but the outcome may still fall outside them.
Therefore each individual trade should be viewed as a random outcome. A valid setup could lose; an invalid one could win. It is possible to follow every rule and still take a loss. It is equally possible to break all rules and still see profits. These inconsistencies can cluster into streaks, several wins or losses in a row, without indicating anything about the applied system.
To navigate this, traders should think in terms of sample size. A single trade provides limited insight, relevant information only emerges over a sequence of outcomes. Probabilistic trading means acting on repeatable conditions that show positive expectancy over time, while accepting that the result of any individual trade is unknowable.
Expected Value
Expected value is a formula to measure the long-term performance of a trading system. It represents the average outcome per trade over time, factoring in both wins and losses:
Expected Value = (Win Rate × Average Win) – (Loss Rate × Average Loss)
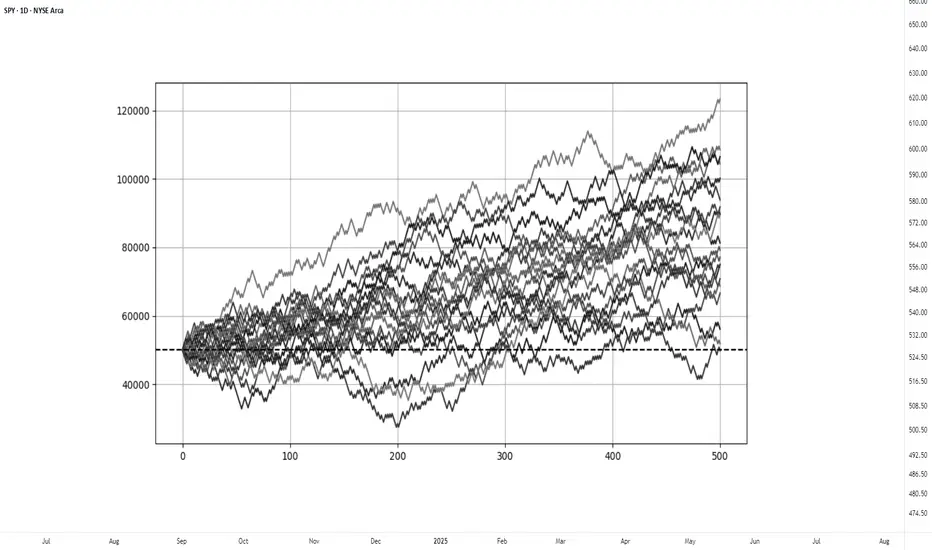
This principle can be demonstrated through simulation. A basic system with a 50% win rate and a 1.1 to 1 reward-to-risk ratio was tested over 500 trades across 20 independent runs. Each run began with a $50,000 account and applied a fixed risk of $1000 per trade. The setup, rules, and parameters remained identical throughout; the only difference was the random sequence in which wins and losses occurred.
While most runs clustered around a profitable outcome consistent with the positive expected value, several outliers demonstrated the impact of sequencing. When 250 trades had been done, one account was up more than 60% while another was down nearly 40%. In one run, the account more than doubled by the end of the 500 trades. In another, it failed to generate any meaningful profit across the entire sequence. These differences occurred not because of flaws in the system, but because of randomness in the order of outcomes.
These are known as Monte Carlo simulations, a method used to estimate possible outcomes of a system by repeatedly running it through randomized sequences. The technique is applied in many fields to model uncertainty and variation. In trading, it can be used to observe how a strategy performs across different sequences of wins and losses, helping to understand the range of outcomes that may result from probability.
Trading System Variations
Two different strategies can produce the same expected value, even if they operate on different terms. This is not a theoretical point, but a practical one that influences what kind of outcomes can be expected.
For example, System A operates with a high win rate and a lower reward-to-risk ratio. It wins 70% of the time with a 0.5 R, while System B takes the opposite approach and wins 30% of the time with a 2.5 R. If the applied risk is $1,000, the following results appear:
System A = (0.70 × 500) − (0.30 × 1,000) = 350 − 300 = $50
System B = (0.30 × 2,500) − (0.70 × 1,000) = 750 − 700 = $50
Both systems average a profit of $50 per trade, yet they are very different to trade and experience. Both are valid approaches if applied consistently. What matters is not the math alone, but whether the method can be executed consistently across the full range of outcomes.
Let’s look a bit closer into the simulations and practical implications.
The simulation above shows the higher winrate, lower reward system with an initial $100,000 balance, which made 50 independent runs of 1000 trades each. It produced an average final balance of $134,225. In terms of variance, the lowest final balance reached $99,500 while the best performer $164,000. Drawdowns remained modest, with an average of 7.67%, and only 5% of the runs ended below the initial $100,000 balance. This approach delivers more frequent rewards and a smoother equity curve, but requires strict control in terms of loss size.
The simulation above shows the lower winrate, higher reward system with an initial $100,000 balance, which made 50 independent runs of 1000 trades each. It produced an average final balance of $132,175. The variance was wider, where some run ended near $86,500 and another moved past $175,000. The drawdowns were deeper and more volatile, with an average of 21%, with the worst at 45%. This approach encounters more frequent losses but has infrequent winners that provide the performance required. This approach requires patience and mental resilience to handle frequent losses.
Practical Implications and Risk
While these simulations are static and simplified compared to real-world trading, the principle remains applicable. These results reinforce the idea that trading outcomes must be viewed probabilistically. A reasonable system can produce a wide range of results in the short term. Without sufficient sample size and risk control, even a valid approach may fail to perform. The purpose is not to predict the outcome of one trade, but to manage risk in a way that allows the account to endure variance and let statistical edge develop over time.
This randomness cannot be eliminated, but the impact can be controlled from position sizing. In case the size is too large, even a profitable system can be wiped out during an unfavorable sequence. This consideration is critical to survive long enough for the edge to express itself.
This is also the reason to remain detached from individual trades. When a trade is invalidated or risk has been exceeded, it should be treated as complete. Each outcome is part of a larger sample. Performance can only be evaluated through cumulative data, not individual trades.
EURJPY point of revers?
OANDA:EURJPY constantly pushing in last periods, currently on this point expecting trend revers and short bearish push.
SUP zone: 173.200
RES zone: 170.500, 169.700

Market Trap Alert! GBP/USD Bearish Robbery Plan🔥💸 "The Cable Heist" – GBP/USD Robbery Plan Using Thief Trading Style 💸🔥
— Unfiltered Forex Forecast with Risky Intentions —
🌍 Hey Money-Makers, Market Hustlers & Chart Bandits! 🤑✈️
Hola! Bonjour! Marhaba! Hallo! Ciao! Welcome to the Forex streets where the smart rob the charts, not banks.
Ready for the GBP/USD Heist? Let’s break it down with our infamous Thief Trading Style – raw, unapologetic, and built for profits.
💼 Operation Name: “The Cable Forex Bank Robbery”
🎯 Pair: GBP/USD – aka “The Cable”
⚔️ Style: Scalp / Day Trade / Swing Heist
📊 Bias: Short (Bearish Setup)
🛠 STRATEGY SETUP: "Follow the Shadows"
🔍 Analysis Basis:
Smart-Money Traps at Key Levels
Oversold ≠ Reversal (Read between the candles)
Liquidity Hunting Zones
Retail Stop Clusters Exposed
Thief-style DCA Entries (Staggered Entry Levels)
Multi-timeframe Confirmation
COT, Sentiment & News-Driven Volatility
🎯 ENTRY ZONE:
Enter short (sell) using 15M or 30M chart.
Sell Limits near recent highs (pullback zone).
DCA (Layered Entry) recommended – Thief loves catching price slipping.
Let the liquidity work for us.
🛑 STOP LOSS (SL):
Base SL around 1.34850 on 4H Chart – above swing high.
Adjust SL per position size and total entries.
Manage risk, but remember: thieves don’t panic, they plan!
🎯 TARGET ZONE:
TP near 1.32500 or adjust using price action.
Escape before target if market mood flips – no need to be greedy.
Trail SLs if market momentum dies down.
👀 Scalpers' Special Note:
Only SHORT — don’t mess with long side unless you’re a liquidity donor.
Quick ins & outs. If you're loaded with capital, jump in big – else follow the swing team.
Use trailing SLs for safety — protect the loot.
📢 FUNDAMENTALS TO WATCH:
News Impacting GBP/USD
COT Reports
Sentiment Indicators
Macro Trends / Yield Spreads
US Dollar Strength Index (DXY)
UK Economic Reports (CPI, GDP, Rate Decisions)
⚠️ RISK MANAGEMENT TIPS:
🚨 Avoid new entries during news releases
🚨 Use trailing stops during volatility spikes
🚨 Secure running trades before major announcements
🚀 Boost the Robbery – Support the Strategy
💖 Smash that BOOST BUTTON if you're vibing with this setup. Help the Thief crew grow stronger!
Let’s keep milking the market 💸 – one “heist” at a time. Stay dangerous, stay smart.
🔓 NOTE: This isn't investment advice. Just a wild trading idea from a chart outlaw.
Always DYOR – Do Your Own Robbery (Research).
Market conditions shift fast. Stay alert, adapt, and respect your capital.
#ForexThiefStyle #CableHeist #GBPUSDShort #SmartMoneyMoves #LiquidityHunters #ChartOutlaws #TradingRebels #DayTradeLife #ScalpersParadise #ForexGang #FXHeistPlans
