Beyond Technical Analysis
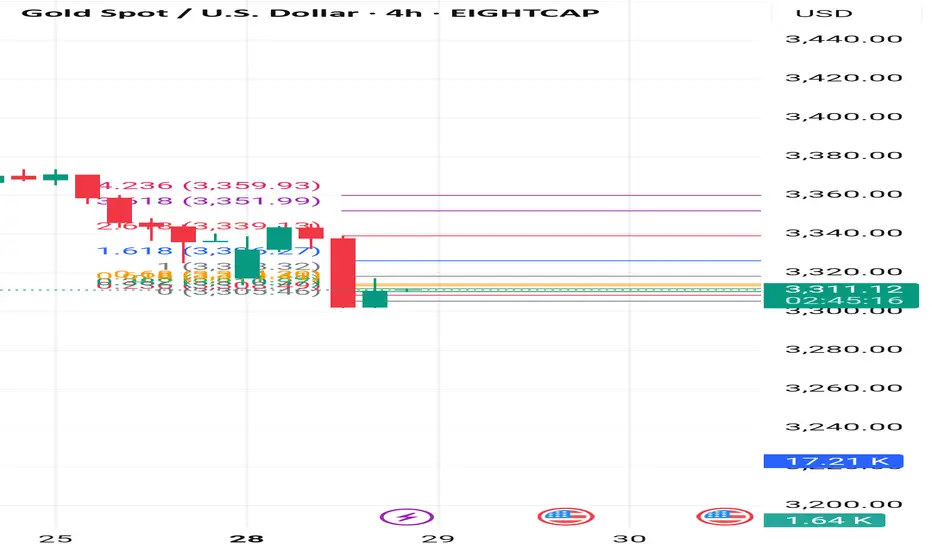
Gold Could Show there Potentially BearishGold is currently consolidating, but a downtrend range is forming based on the prevailing market setup. After erasing early gains, XAUUSD stabilized near 3340 on Monday, with downside pressure largely influenced by a stronger U.S. Dollar following the announcement of the US-EU trade agreement.
Price rejected sharply from the 3340 resistance zone, suggesting continued bearish momentum. A minor pullback was seen after testing the upper boundary, with sellers regaining control near resistance. Traders are closely watching the 3350–3362 resistance zone, where another rejection could fuel a fresh downside move A confirmed breakdown below 3312 could open the path toward 3282 in the short term.
Ps: Support with like and comments for more better analysis.

3M CLS I KL - OB I Model 2 I Targe 50% CLSHey, Market Warriors, here is another outlook on this instrument
If you’ve been following me, you already know every setup you see is built around a CLS Footprint, a Key Level, Liquidity and a specific execution model.
If you haven't followed me yet, start now.
My trading system is completely mechanical — designed to remove emotions, opinions, and impulsive decisions. No messy diagonal lines. No random drawings. Just clarity, structure, and execution.
🧩 What is CLS?
CLS is real smart money — the combined power of major investment banks and central banks moving over 6.5 trillion dollars a day. Understanding their operations is key to markets.
✅ Understanding the behavior of CLS allows you to position yourself with the giants during the market manipulations — leading to buying lows and selling highs - cleaner entries, clearer exits, and consistent profits.
📍 Model 1
is right after the manipulation of the CLS candle when CIOD occurs, and we are targeting 50% of the CLS range. H4 CLS ranges supported by HTF go straight to the opposing range.
"Adapt what is useful, reject what is useless, and add what is specifically your own."
— David Perk aka Dave FX Hunter ⚔️
👍 Hit like if you find this analysis helpful, and don't hesitate to comment with your opinions, charts or any questions.

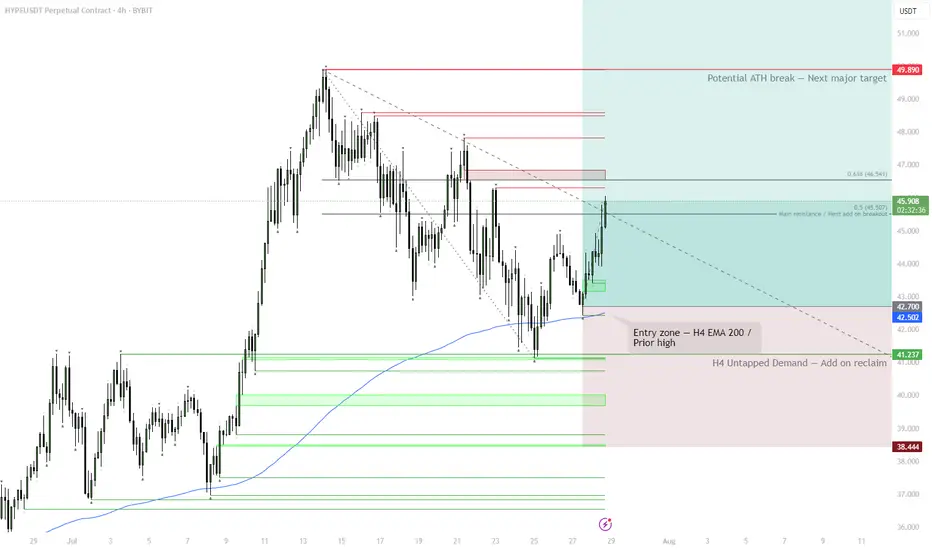
HYPE | #12h #long — Major Reversal Setup from 200 EMA & DemandStarted building a position around 42.7 due to the under/over of the H4 EMA 200 and the prior consolidation high. However, there's an untapped H4 demand zone beneath — if we get a flush into that area and then reclaim 41.2 and the H4 EMA 200, I'll be adding to my position.
Invalidation:
Losing the H4 demand would be my cut-off, potentially opening the door for a sweep of the equal lows near 30.
Scenario:
— If the 200 EMA holds or we see #OneMoreLow to trap sellers and reclaim, the setup remains very bullish.
— Targets: At minimum, a stab into ATH, with the potential for a full extension up to 55.3 and beyond.
Reasoning:
This is a classic under/over setup with demand untested and a clear invalidation level. If buyers step in and reclaim key levels, expect explosive continuation.
SMCI WEEKLY CALL SETUP (07/28/25)
### 🔹 SMCI WEEKLY CALL SETUP (07/28/25)
**Bullish Flow + Strong RSI = 🚀 Call Opportunity at \$62**
---
### 📊 TECHNICAL SNAPSHOT
* **RSI (Daily + Weekly):** ✅ Above 55 — clear bullish strength
* **Weekly Close:** 🔼 Broke prior highs — momentum continuation likely
* **Volume Ratio:** Slightly weak (0.9x) 📉 — watch early-week participation
* **VIX:** 14.93 💤 — low vol = smoother price action (great for weekly calls)
---
### 💥 OPTIONS FLOW HIGHLIGHTS
* **Call/Put Ratio:** 4.30 🔥 (heavy bullish skew)
* **Hot Strikes:** \$62.00 & \$63.00 = aggressive positioning
* **OI Surge:** Confirmed institutional interest → upside bets stacking up
---
### ✅ TRADE SETUP
* 🎯 **Strategy:** Long Weekly Call
* 📈 **Strike:** \$62.00
* 📅 **Expiration:** Aug 1, 2025
* 💸 **Entry Price:** \$0.86 (ask)
* 🛑 **Stop Loss:** \$0.43 (50% risk)
* 🎯 **Target:** \$1.20 (40% upside)
* 📈 **Confidence:** 80%
* ⏰ **Entry Timing:** Market open
---
### 🚨 KEY RISKS
* ⚠️ Weak volume = lower conviction from institutions
* 📉 Watch early-week flow → exit if buyers fade
* 🎯 Above \$63 = breakout fuel
* 🧨 Below \$61 = trend in question
---
### 🧠 MODEL CONSENSUS
> All quant models bullish except **one cautioning on volume**
> Options flow + RSI = overwhelming bullish case
---
### 📦 TRADE\_DETAILS (Algo-Friendly JSON)
```json
{
"instrument": "SMCI",
"direction": "call",
"strike": 62.0,
"expiry": "2025-08-01",
"confidence": 0.80,
"profit_target": 1.20,
"stop_loss": 0.43,
"size": 1,
"entry_price": 0.86,
"entry_timing": "open",
"signal_publish_time": "2025-08-01 09:30:00 UTC-04:00"
}
```
---
📈 **Watch zones:**
* 🚀 Above \$63 = breakout
* 🛑 Below \$61 = cut risk
---
**#SMCI #OptionsFlow #CallOptions #WeeklyTrade #RSI #BullishMomentum #MarketOpenSetup #QuantSignals #OptionsAlert**

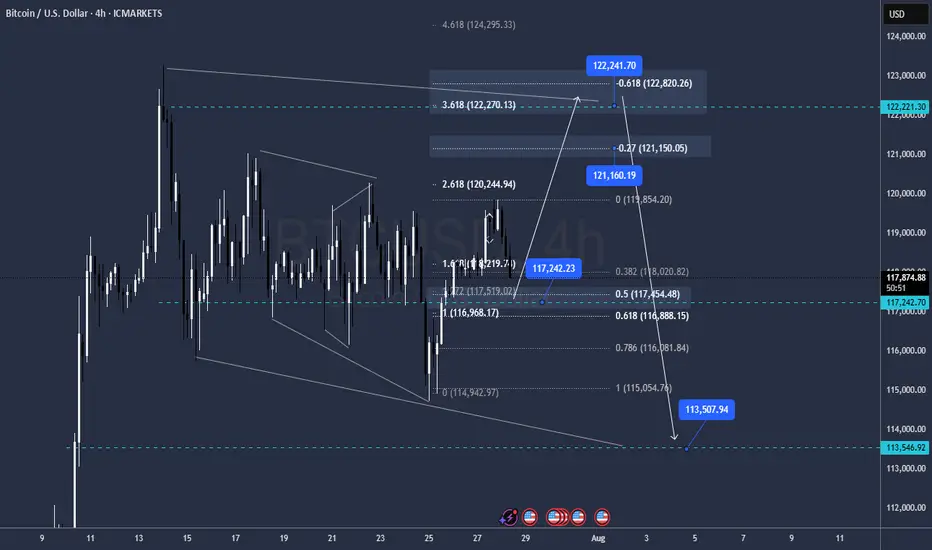
BTC new meassuresokay impulse is pretty much clear
buy level 117.250 Targtting 121.100 / 122.200 / 122.800
Sell level 122.200 targetting 113.500
Re buy level 113.500 targetting 127.500 / 133.000
GG
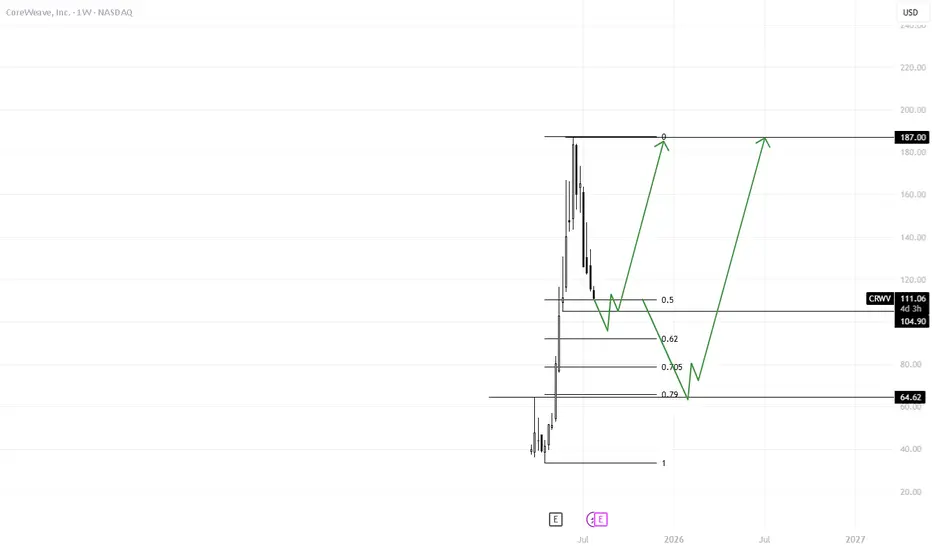
CRWVExpecting Bullish price action at 100$ level. If break of structure is noted and maintained I see upside targets remaining 189$. Second Scenario is Price falls to the 60$ level then shows bullish price action.
MSTR WEEKLY OPTIONS SETUP (2025-07-28)
### 🔻 MSTR WEEKLY OPTIONS SETUP (2025-07-28)
**Bearish Divergence with High Confidence — Time to Strike with a PUT?**
---
📊 **Momentum Recap:**
* **RSI:** Bearish 📉
* **Volume:** Weak (institutional exit risk)
* **Options Flow:** Mixed (calls > puts, but no alignment with price)
* **Sentiment Models:** Split 4:1 → **Only Claude/Anthropic** goes bearish with conviction
🧠 **Model Consensus:**
> “Momentum is weak, volume fading, and no upside confirmation = bearish edge.”
---
### ✅ SETUP OVERVIEW
* 🔍 **Trend:** Bearish (declining RSI)
* 📉 **Volume:** Weak = reduced institutional conviction
* 💬 **Options Flow:** Bullish bias, but **contradicts price trend**
* ⚙️ **Volatility:** Elevated, potential reward for directional plays
**Overall Bias:** 🔴 *Moderately Bearish*
---
### 💥 TRADE IDEA: MSTR \$400P
* 🎯 **Strategy:** Long Weekly Put
* 🔻 **Strike:** 400.00
* 📆 **Expiry:** Aug 1, 2025
* 💸 **Entry Price:** \$8.65
* ✅ **Profit Target:** \$12.50
* 🛑 **Stop Loss:** \$4.00
* 📈 **Confidence Level:** 72% (backed by Claude model)
* 📉 **Breakdown Trigger:** Below \$405 confirms bearish flow
* ⚠️ **Invalidation:** Break above \$415 → exit early
---
### 📦 TRADE\_DETAILS (Backtest/Algo Ready JSON)
```json
{
"instrument": "MSTR",
"direction": "put",
"strike": 400.0,
"expiry": "2025-08-01",
"confidence": 0.72,
"profit_target": 12.50,
"stop_loss": 4.00,
"size": 1,
"entry_price": 8.65,
"entry_timing": "open",
"signal_publish_time": "2025-07-31 09:30:00 UTC-04:00"
}
```
---
### 🧠 TRADE INSIGHTS
* 🟥 4/5 models say **no trade** due to signal divergence
* 🧠 **Claude’s bearish thesis = cleanest directional setup**
* 🚨 Volume + RSI combo = downside confirmation
* 🧭 Watch key price reaction zones: **\$400–\$405 (support)** / **\$415 (resistance cap)**
---
**#MSTR #PutOptions #WeeklyTrade #BearishSetup #OptionsFlow #QuantTrading #ClaudeModel #MarketMomentum**

NAS100 shortElite analysis
Confirmed the entire checklist
Targeting lower liquidity pools.
Main Target NY Low.
This was confirmed from Daily all the way down to 1m.

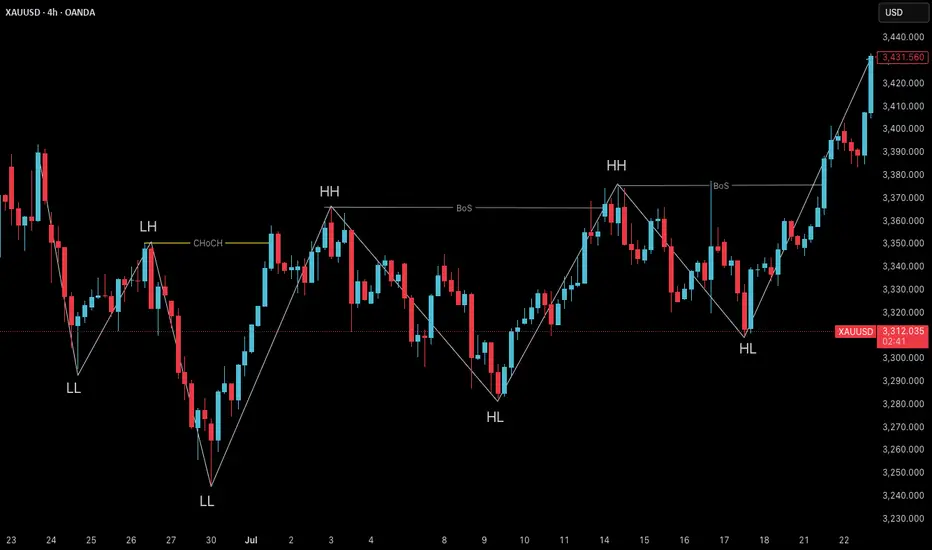
ChoCH: The Quiet Shift Most Traders Ignore“Most traders chase price. Few notice when price quietly turns around.”
Before a trend ends, before a breakout fails, before a setup forms —
There’s often a silent clue: Change of Character (ChoCH) .
What is ChoCH?
Change of Character marks the first structural sign that the market may be reversing — not continuing.
It’s a break in the internal rhythm of price, often happening after a liquidity sweep or inside a key zone.
In simpler terms:
BoS = Continuation
ChoCH = Potential Reversal
Most traders treat ChoCH like a green light to enter... but that’s a mistake.
ChoCH alone doesn’t mean a trend is ready to reverse.
It only tells you the current trend has paused or cracked — not ended.
What matters more is:
– Where the ChoCH happens
– Why it happens
– What came before it
This is where context matters.
How I Use ChoCH in My Trading Framework:
My approach is built around multi-timeframe structure:
✅ H4 – Bias
✅ M15 – Setup Alignment
✅ M1 – Sniper Entry
So when I see a ChoCH on M15 , I ask:
Does this align with my H4 bias ?
Has price entered a key zone or swept liquidity before the shift?
If yes — I start watching closely.
If no — it’s likely just noise.
ChoCH without narrative is just confusion.
BoS vs ChoCH – Know the Difference:
• BoS (Break of Structure) confirms trend continuation
• ChoCH (Change of Character) hints at a trend shift
• They look similar on a chart — but their implications are opposite
Mistake to avoid: Entering just because ChoCH appeared
Better approach: Let it warn you , not trap you
🪞 Final Thought:
ChoCH is not an entry. It’s an invitation.
A quiet shift the market offers only to those still enough to see it.
Some notice it.
Fewer understand it.
Even fewer know what to do after.
That’s the difference between recognizing a change… and trading it with conviction.
💬 If this spoke to you, share your thoughts below.
There’s more beneath the surface — tell me what direction you'd like to explore next.
Some of the most powerful methods I use aren’t shared openly — but those who’ve seen them know why.
You’ll know where to look if it’s meant for you.
📘 Shared by @ChartIsMirror
GE WEEKLY OPTIONS SETUP (2025-07-28)
### ⚙️ GE WEEKLY OPTIONS SETUP (2025-07-28)
**Mixed Signals, Bullish Flow – Can Calls Win This Tug-of-War?**
---
📊 **Momentum Breakdown:**
* **RSI:** Falling across models → ⚠️ *Momentum Weak*
* **Volume:** Weak 📉 = Low conviction from big players
* **Options Flow:** Call/Put ratio favors bulls 📈
* **Volatility (VIX):** Favorable for directional plays
🧠 Model Consensus:
> “Momentum weak, but bullish flow + low VIX = cautiously bullish.”
> Some models recommend **no trade**, others suggest **tight-risk long call**.
---
### ✅ WEEKLY SETUP AT A GLANCE
* 🔍 **Volume:** Weak (distribution risk)
* 📉 **Momentum:** RSI fading
* 💬 **Options Sentiment:** Bullish bias (calls > puts)
* ⚙️ **Volatility:** Favorable
**Overall Bias:** 🟡 *Moderate Bullish*
---
### 💥 TRADE IDEA: GE \$275C
* 🎯 **Strategy:** Long Weekly Call
* 🔵 **Strike:** 275.00
* 📆 **Expiry:** Aug 1, 2025
* 💸 **Entry:** \$1.10
* ✅ **Profit Target:** \$1.80
* 🛑 **Stop Loss:** \$0.55
* 📈 **Confidence Level:** 65%
* 🧮 **Risk Level:** Medium (momentum divergence = tread carefully)
* ⚠️ **Support Watch:** Monitor for drop below \$268–270 for potential exit.
---
### 📦 TRADE\_DETAILS (Algo/Backtest Ready JSON)
```json
{
"instrument": "GE",
"direction": "call",
"strike": 275.0,
"expiry": "2025-08-01",
"confidence": 0.65,
"profit_target": 1.80,
"stop_loss": 0.55,
"size": 1,
"entry_price": 1.10,
"entry_timing": "open",
"signal_publish_time": "2025-07-28 12:08:59 UTC-04:00"
}
```
---
### 📌 NOTES FOR TRADERS
* 🤖 Models split between *no trade* vs *tight-risk long*
* 🚨 **Momentum divergence** is real – don’t oversize
* 🧭 **Watch Friday theta decay** — manage exits accordingly
* 🔍 Chart check: Watch price action near \$275 and \$268
---
**#GE #OptionsTrading #WeeklyPlay #CallFlow #UnusualOptionsActivity #GEcalls #AITrading #RiskManagement**

GBPUSD and The Elliott Wave TheoryThis is the continuation of a larger wave that had started earlier. Our Wave 2(Green) was a Zigzag and our Wave 4(Green), a Flat completed when Wave C(Blue) finished. When Wave 4(Green) completed, we see a 5 Wave move begin, thus Wave 5(Green). This 5 wave move is shown in Black. Wave 2(Black) was a Zigzag meaning a Flat should be expected for Wave 4(Black) - more on this later in this article. Wave 3(Black) expressed itself in a 5 wave move, shown in Red. Wave 2(Red) was a Zigzag meaning Wave 4(Red) should be a Flat. We see exactly that when Wave 3(Red) completes -- a Flat for Wave 4(Red). After Wave 4(Red), a Wave 5(Red) forms to complete the 5 wave move for Wave 3(Black) and is marked as so. Wave 2(Black) was a Zigzag and as mentioned earlier, hence Wave 4(Black) should be a Flat. Indeed, a Wave A(Green) forms for the first leg of the Flat, then a B(Green). Currently, we are on Wave C(Green) and upon completion, this would be our Wave 4(Black). After Wave B(Green) completes we see a Wave 1(Orange) form with a 2 or A forming. This has two readings for now because it could be a Zigzag or the first leg of a Flat. Stay tuned for updates.

From Rejections to Breakout? CAKE Faces Key TrendlineNASDAQ:CAKE has been stuck in a long-term downtrend, constantly getting rejected from that falling red trendline.
But things are starting to shift...
After bouncing off the major support zone, price is once again pushing toward that trendline, and this time, momentum looks stronger.
If CAKE can break and hold above this level, we could finally see a powerful move toward the $5+ resistance zone.
Just a heads-up: it’s been rejected here before, so let the breakout confirm before getting too excited.
DYOR, NFA

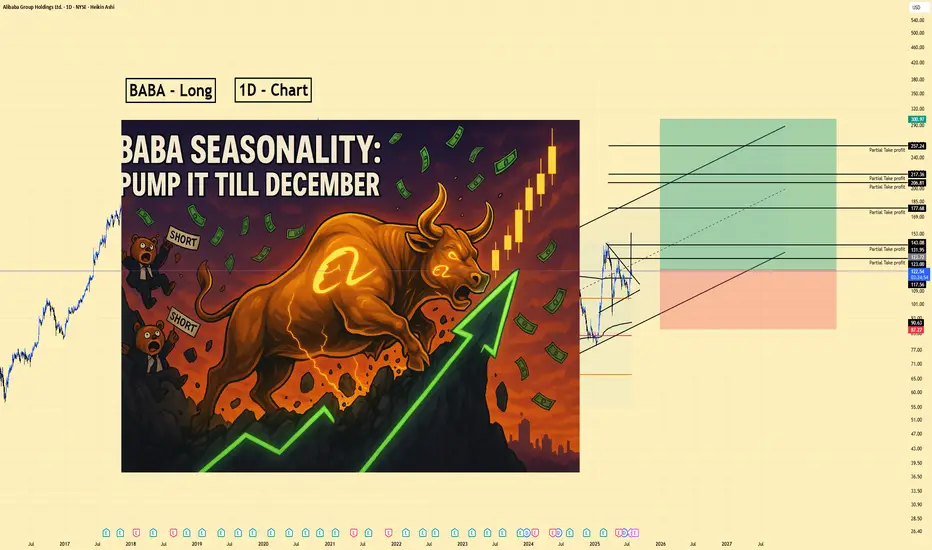
BABA | Long | Strong AI & Seasonality Tailwinds (July 2025)BABA | Long | Strong AI & Seasonality Tailwinds (Aug 2025)
1️⃣ Quick Insight: Alibaba is showing strong AI-driven momentum, healthy fundamentals, and positive seasonality patterns. August–December tends to be bullish, and the stock is already holding up well despite recent dips.
2️⃣ Trade Parameters:
Bias: Long
Entry: Current price zone (~$123)
Stop Loss: $87
Take Profits:
TP1: $131
TP2: $143
TP3: $177
TP4: $206
TP5: $217
TP6: $257
Extended Target: $300 (if momentum holds through the parallel channel)
3️⃣ Key Notes:
Alibaba’s fundamentals remain solid with revenue up on a yearly basis since 2021, even though some quarters have shown pressure. EPS is expected to grow annually, and institutional interest is strong (43% holding increase by Maridea Wealth Management). The AI pivot with Qwen LLM models and Quark AI glasses launch could be major catalysts. Seasonality supports upside through mid-December before potential reversals.
4️⃣ What to Watch:
AI & cloud revenue performance (Qwen adoption)
Cainiao and other potential spinoff IPOs
Regulatory updates and U.S.-China tensions
Seasonal strength: historically bullish until late November–early December
📊 Outlook: Analysts forecast $150–$160 in the next 12 months (~20–30% upside). Bull case targets range $200–$250 over 3–5 years, with potential extension if AI & international commerce expansions deliver.
Please LIKE 👍, FOLLOW ✅, SHARE 🙌 and COMMENT ✍ if you enjoy this idea! Also share your ideas and charts in the comments section below! This is best way to keep it relevant, support us, keep the content here free and allow the idea to reach as many people as possible.
Disclaimer: This is not financial advice. Always do your own research.
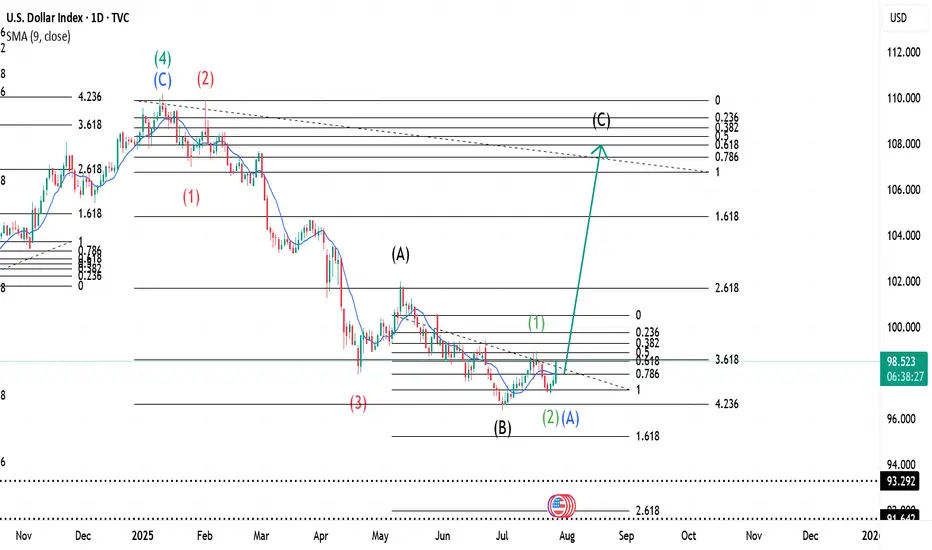
$ INDEX ~ Real Time Elliott Wave UpdatesThis is an update of a $ index chart I had previously posted. We see a Wave 1(Green) completed and a dip occurring. This dip is marked as Wave 2(Green) or Wave A(Blue). It has two readings because it could be a Zigzag, hence 2 or an A of a Flat, hence A. I will offer updates as the wave unfolds. All other analysis remains the same as I had previously posted and can be checked for references. Sentiment still remains buy.
USDCAD ~ Real Time Elliott Wave UpdatesThis is an update of a USDCAD chart I had previously posted. Wave 1(Red) completed and a Wave 2(Red) or Wave A(Grey) has a lso completed. This wave has two readings at the moment because it could be a completed Zigzag or the first Wave of a Flat formation. I will provide updates soon. Analysis remains the same as my previous post and can be used for references. Sentiment still remains buy.

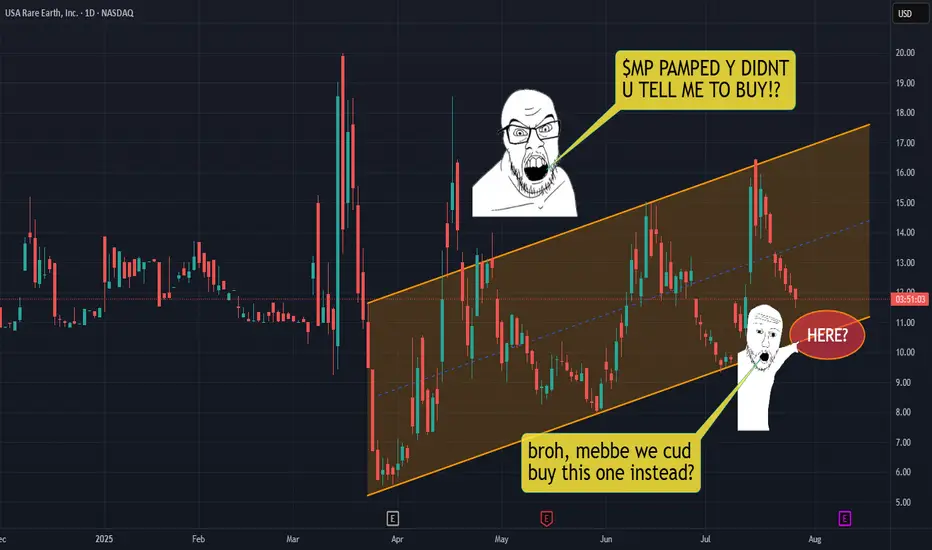
USAR | We missed(ish) on MP, can we get some rare earth pamp?!Tradesters, Let's focus our blurred vision on USA Rare Earth Inc NASDAQ:USAR
WHy?!?!?! YOU WANT TO KNOW WHY!?!?!
Well, the US is tryna get serious aboot national security. We're gonna need a lot of magic rocks to do that. In order to secure more magic rocks, recently the US Gubment PAMPED MP Materials NYSE:MP and maybe we missed the initial PAMP.
That recently signed Big Frothy Bill has mo' money in it for such investments. NASDAQ:USAR could be another target of such pamping. Parallel channel might indicate a good starter position entry point.
This is not financial advice. THANK YOU FOR YOUR ATTENTION ON THIS MATTER
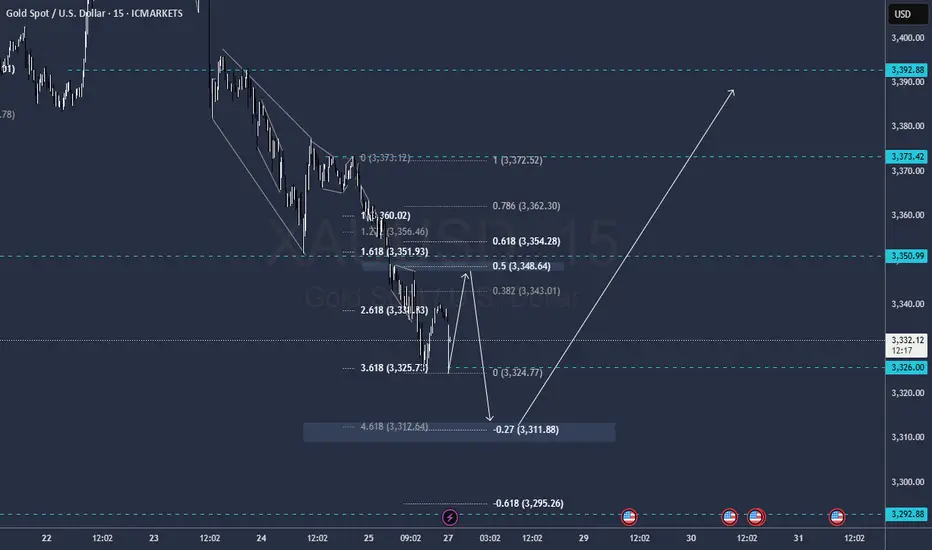
GOLD Continuation and ReversalIt still needs one more fall
Sell from 3348 to 3312
Buy from 3312 to 3392
GG
AUDUSD ~ Real Time Elliott Wave UpdatesThis is an update of an AUDUSD chart I had previously posted. We can see that Wave B(Blue) confirms at the 161.8% Fib. level and then sells. Wave B(Blue) pushed a bit higher than I had previously thought, but all other analysis remains the same. The sentiment is a for a sell. Check my previous post for more analysis on this pair.

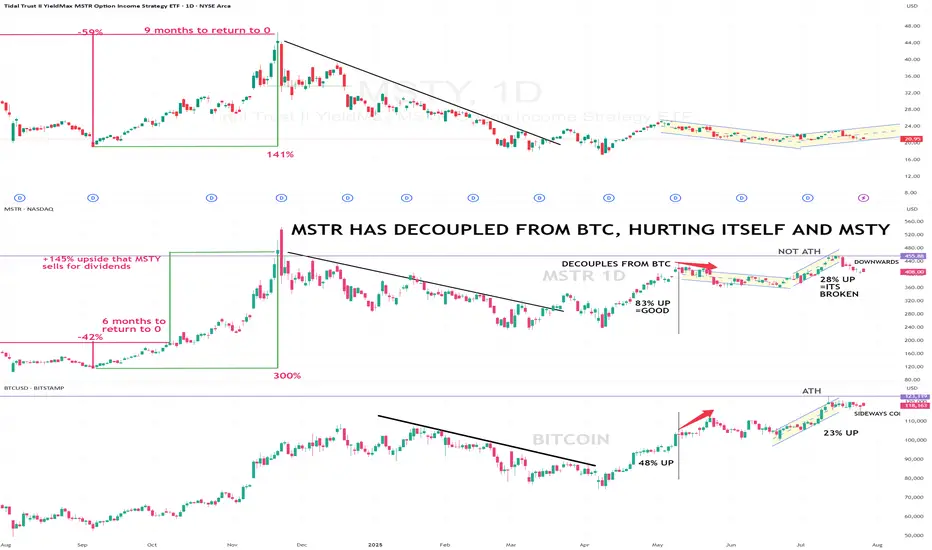
MSTR decouples from BTC, hurting MSTYI use this chart to track BTC, and MSTR so I can safely hold MSTY shares at a price that "should" be safe as long as BTC follows Global Liquidity with a 70-90 day offset (which it IS doing) and MSTR follows BTC price action with a 2x or so, multiplier, (which it WAS, until it decoupled recently). This makes holding MSTY for any share price at $23 or higher, dicey, when MSTR should be in the $500-600 range at the recent BTC ATH and MSTY share price should be in the $30 range, at least. Add to this: BTC is not enjoying the monster 400% runups it had 2021 and previous.
TSLA WEEKLY OPTIONS SETUP
### 🚗 TSLA WEEKLY OPTIONS SETUP (2025-07-28)
**Big Call Flow. Low VIX. Can Bulls Hold \$325?**
---
📊 **Momentum Overview:**
* **Daily RSI:** 48.2 🔻 → *Neutral-to-Weak*
* **Weekly RSI:** 57.1 🔻 → *Still bullish zone, but falling*
⚠️ **Interpretation:** Momentum is softening, trend in question.
📉 **Volume Context:**
* **Volume Ratio:** 1.3x ⬆️ (vs. last week)
* **Price Change:** -0.77% despite that volume
🔍 *Distribution Alert:* Institutions may be selling into strength.
📈 **Options Flow:**
* **Call/Put Ratio:** **1.70** = 🚨 *Bullish flow confirmed*
* **Volatility (VIX):** 15.16 🟢 Favorable for directional plays
✅ Strong setup for options traders riding short-term momentum
---
### 🧠 **Weekly Sentiment Scorecard:**
* ✅ **Bullish Signals (2):** Options Flow, Volatility
* ⚠️ **Neutral Signals (2):** Daily & Weekly RSI
* ❌ **Bearish Signal (1):** Volume pattern = distribution risk
**Overall Bias:** 🟢 *Moderate Bullish*
---
### 🔥 **TRADE SETUP IDEA:**
🎯 **Strategy:** Long Call Option
* 📌 **Instrument:** TSLA
* 💵 **Strike:** \$355C
* 📅 **Expiry:** Aug 1, 2025
* 💸 **Entry:** \~\$0.75
* 🎯 **Profit Target:** \$1.50
* 🛑 **Stop Loss:** \$0.45
* 🔒 **Key Support to Watch:** \$327.50 — lose that = exit fast
📈 **Confidence Level:** 65%
⚠️ **Gamma Risk:** High → trade small, manage tight.
---
### 📦 TRADE\_DETAILS (JSON Format for Algo/Backtest):
```json
{
"instrument": "TSLA",
"direction": "call",
"strike": 355.0,
"expiry": "2025-08-01",
"confidence": 0.65,
"profit_target": 1.50,
"stop_loss": 0.45,
"size": 1,
"entry_price": 0.75,
"entry_timing": "open",
"signal_publish_time": "2025-08-01 09:30:00 UTC-04:00"
}
```
---
### 🧭 **Quick Notes for Traders:**
* ✅ Bulls have short-term edge — but **momentum is fading**
* ⚠️ If TSLA breaks below **\$325**, exit fast.
* 🔍 Watch for fakeouts: options flow is bullish, but volume says “not so fast.”
---
📊 TSLA \$355C → Risk \$0.75 to potentially double 📈
💬 Will this hold, or is it a bull trap before a dump? 👀
Comment below ⬇️ and follow for Monday updates!
---
**#TSLA #OptionsFlow #WeeklyTrade #TradingSetup #GammaRisk #AITrading #TeslaStock #UnusualOptionsActivity #SmartMoneyMoves**

EURUSD ~ Real Time Elliott Wave UpdatesThis is an update of a chart I had previously posted. Here, we can see that Wave 1(Red) has already completed and a pullback occurred soon after, marked as Wave 2(Red) or Wave A(Blue). This has two markings because on one hand it could be a Zigzag formation or it could be the first wave of a Flat correction. All other analysis remains the same as I had previously posted. Sentiment still remains a sell.
@fabrx900
