ID: 2025 - 0095.5.2025
Trade #9 of 2025 executed.
Trade entry at 137 DTE (days to expiration).
Trade construct is a PDS (put debit spread) at Delta 15 combined with a PCS (put credit spread) at Delta 15. Overlapping short strikes give it the "unbalanced" butterfly nomenclature.
Sizing and strike selection is designed to keep the risk/reward "AT EXPIRATION" to a 1:1 risk profile. This lets charm work it's magic (second order greek), while exploiting the fact that this is a non-directional bias. The process is a disciplined and systematic approach letting time decay evaporate the extrinsic time value from the short options until target profit is achieved.
OF NOTE: This trade opened at EXCELLENT fills, and there is zero risk to the upside. The danger is of a catastrophic move to the downside, which will bring in phenomenal gains for ID 006 and 008. 😊
Happy Trading!
-kevin
Beyond Technical Analysis

PLTR WEEKLY TRADE IDEA (07/28/2025)
**🚀 PLTR WEEKLY TRADE IDEA (07/28/2025) 🚀**
**Momentum is 🔥 but Volume is the Missing Ingredient**
---
📈 **Momentum Snapshot:**
* **Daily RSI:** 71.9 ⬆️ (🚨 Overbought but still rising)
* **Weekly RSI:** 76.7 ⬆️ (📢 Clear Bullish Strength)
➡️ *Strong upside pressure, but entering the overbought zone*
📉 **Volume Insight:**
* Weekly Volume = **0.8x last week**
⚠️ *Weak institutional conviction during the breakout = yellow flag*
🔍 **Options Flow Check:**
* **Call/Put Ratio:** 1.09 = *Neutral*
➡️ Balanced flow = *no aggressive buying yet*
🌪️ **Volatility Environment:**
* **VIX = 15.4**
✅ Favorable for directional trades — low IV supports premium growth
---
📊 **Model Consensus Recap:**
✅ Bullish RSI momentum (unanimous)
✅ Volatility ideal for long calls
⚠️ Volume flagged as a concern by some models
📌 Final stance: **MODERATE BULLISH**
---
💥 **RECOMMENDED TRADE SETUP (Confidence: 65%)**
🎯 **Play:** Buy CALL Option
* **Strike:** \$167.50
* **Expiry:** Aug 1, 2025
* **Entry Price:** \~\$0.74
* **Profit Target:** \$1.48 (🟢 2x return)
* **Stop Loss:** \$0.37 (🔻-50%)
📆 **Entry Timing:** Market Open Monday
📦 **Size:** 1 Contract
---
⚠️ **Key Risks to Watch:**
* 📉 Weak volume = possible consolidation before next leg up
* ⏳ Premium decay risk into expiry
* 📊 No strong institutional footprint = stay nimble
---
📌 **JSON FORMAT TRADE DETAILS (Automation Ready):**
```json
{
"instrument": "PLTR",
"direction": "call",
"strike": 167.50,
"expiry": "2025-08-01",
"confidence": 0.65,
"profit_target": 1.48,
"stop_loss": 0.37,
"size": 1,
"entry_price": 0.74,
"entry_timing": "open",
"signal_publish_time": "2025-07-28 10:13:40 EDT"
}
```
---
🔥 TL;DR:
* Momentum is undeniable ✅
* Volume = suspect 🟡
* VIX = Green light for directional play ✅
💬 **\ NASDAQ:PLTR Bulls, are you ready or waiting for volume confirmation?**
\#PLTR #OptionsTrading #BullishSetup #UnusualOptions #MomentumPlay #TradingView #StockMarket

DAX / GER - ANOTHER ROUND OF ENTRY LONGTeam, we have successfully short DAX.GER earlier today with more than 300 points. both target hit
However the market has exceeding the dropping. We decide to go LONG
at the price range 23964-23945
With STOP LOSS at 23865-82
Once the trade hit above 21030-45 - BRING STOP LOSS TO BE
Target 1 at 21080-24115 = please take 50-70% volume target
30% Target remaining at 24165-24196

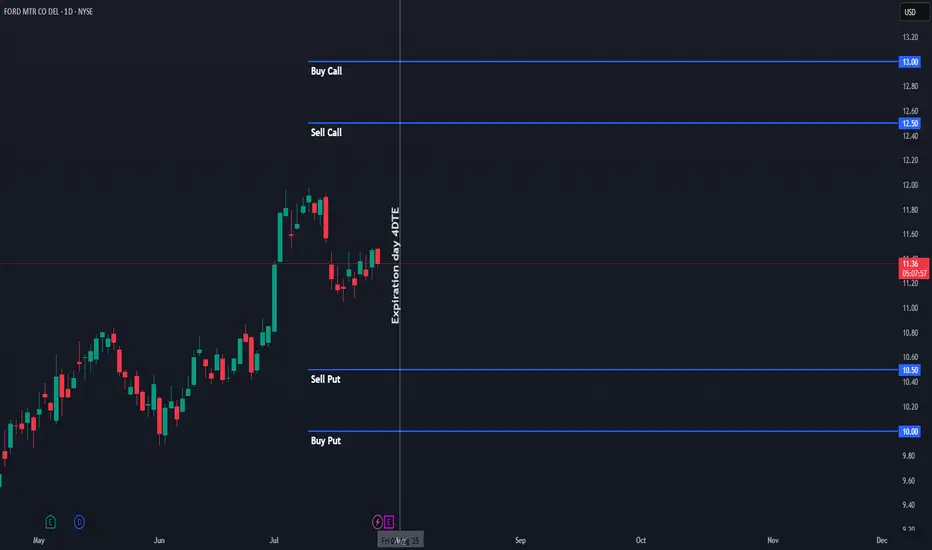
$F Iron Condor – Aug 1st Expiration | $7 Credit | I’m opening an Iron Condor on Ford ($F) with expiration on Friday, August 1st, 2025. The trade is based on the daily chart, using visible support/resistance levels to define the range. I selected strikes with approximately 0.15 delta on each side, giving the setup a high probability of success.
🔹 Total premium collected: $7 per contract
🔹 Stop loss: Defined at 50% of the premium collected (~$3.50)
🔹 Trade logic: We want $F to stay within the range throughout the week to let theta do its job.
🔹 Exit plan: If the price approaches either short strike, I will consider exiting at break-even or take a controlled loss.
This is a non-directional options strategy designed to benefit from time decay and low volatility. The setup is ideal for sideways price action, with no major catalysts expected during the week.
🎯 Target: Full profit if price stays within range until expiration.
❌ Stop: Exit if the price threatens any wing – max loss capped at 50% of the premium received.
This trade combines high probability with well-defined risk and is perfect for consistent weekly income when the market shows indecision or chop.
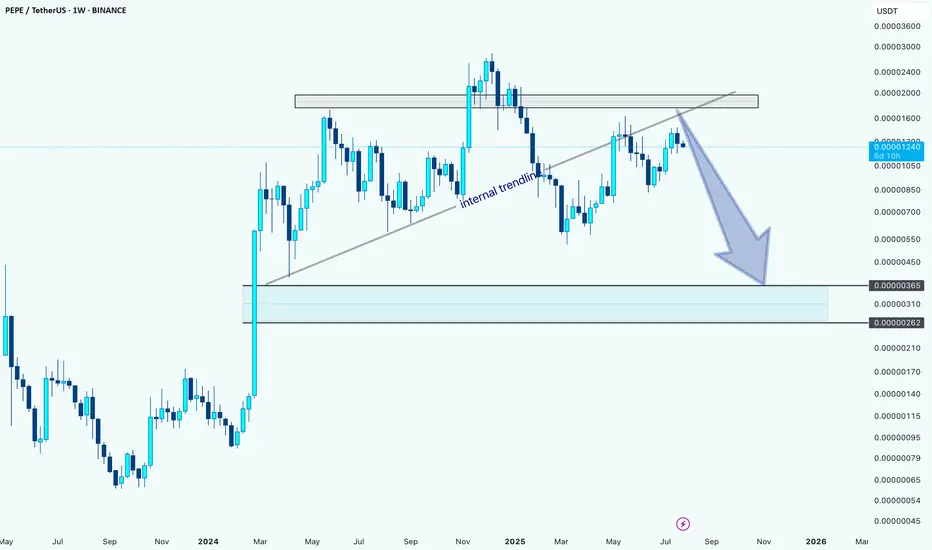
PEPEUSDT: Bearish Outlook After Internal Trendline BreakHello guys.
PEPE has tested the internal trendline multiple times and finally broke below it, signaling potential weakness. Price also failed to reclaim the key supply zone above.
Internal trendline broken
Rejection from a key supply zone
Potential move toward the demand zone around 0.00000262–0.00000365
Unless bulls reclaim the broken trendline and break above the recent highs, the bias remains bearish with a possible continuation to the downside.
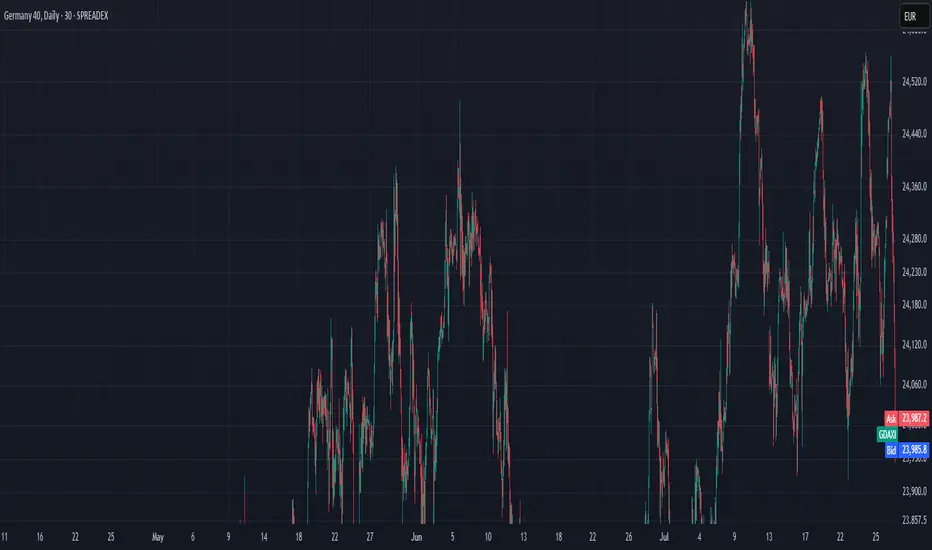
Technical Analysis WeeklyGermany 40 remains in a bullish trend and is currently in a pullback phase. It trades at 24,308, almost identical to its VWAP of 24,307.5. The RSI at 54 suggests a pause in momentum. Support is found at 23,786 and resistance at 24,650.
UK 100 is in an impulsive bullish phase, breaking above previous highs with price at 9,145 well above the VWAP at 8,970. The RSI is at 73, indicating strong buying pressure. Support is at 8,748 and resistance is at 9,101.
Wall Street continues its bullish trend, pausing near recent highs. The price is at 44,880, above its VWAP of 44,445. RSI at 63 confirms steady bullish momentum. Support sits at 43,921 and resistance at 44,880.
Brent Crude remains in a broad neutral trend with short-term range-bound action. Price is at 6,768, just under VWAP of 6,866. RSI at 45 reflects a lack of directional conviction. Support is at 6,717 and resistance at 7,015.
Gold continues to trade sideways within a broad range. It trades at 3,337, nearly equal to its VWAP. The RSI at 47 suggests balance. Support is found at 3,290 and resistance at 3,407.
EUR/USD holds a bullish trend while undergoing a correction. It trades at 1.1740, close to its VWAP at 1.1699. The RSI at 59 shows mild positive momentum. Support is at 1.1585 and resistance at 1.1814.
GBP/USD is in a bullish trend but under corrective pressure and seemingly turning rangebound. The price is 1.3433, slightly below the VWAP of 1.3511. RSI is at 42, hinting at waning momentum. Support is 1.3336, resistance at 1.3687.
USD/JPY continues in a neutral trend but could be about to break higher, currently ranging around 147.66 and VWAP at 147.00. RSI at 57 shows a modest bullish bias after having pulled back from overbought territory. Support is at 144.54 and resistance at 149.46.
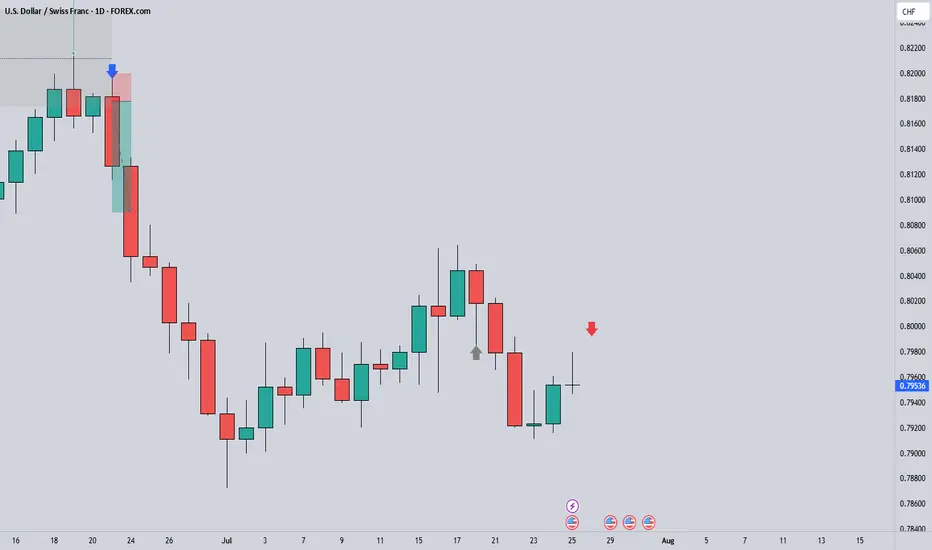
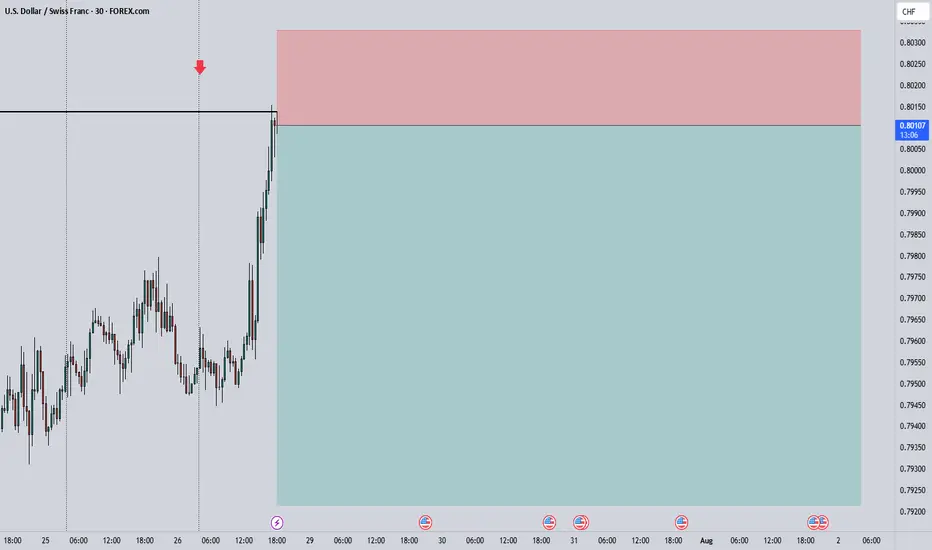
USDCHF Short ProjectHi guys...😎
My custom indicator says it's time to do a Short Project on USDCHF with 3 key reasons:
1. Price Drivers: institutional shorting
2. Trend: down
3. Momentum: bearish
Action: waiting for entry on the intraday timeframe (entry will be published further)

BTCUSD TO THE LAST PUSHWe are looking to finish the last push to the upside for the completed circle.

ICT CONCEPT OF LOOKING FOR THE FIRST FAIR VALUE GAP AFTER 9:30 This was my short idea that turned out profitable today with an 8.5RR. My bias was bearish, and once I noticed bullish PD arrays failing, I waited until 9:30 local NY time to look for the first FVG after that. I identified a SIBI with a 1-minute bearish order block after 9:30. I used the SIBI as an entry point for a sell, with my take profit set at a low from last week's New York trading session.

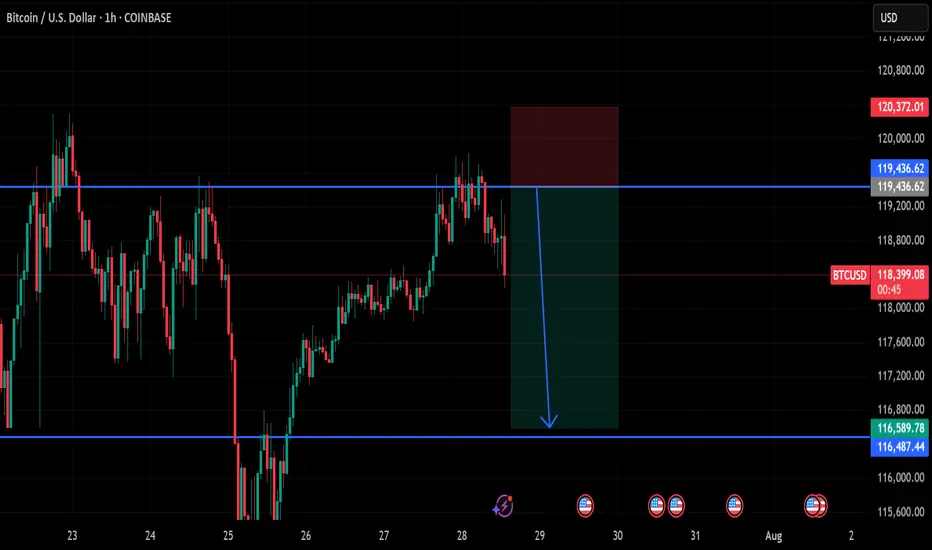
btc on selling#BTCUSD on multiple price rejection at 119k,now we await final touch before a fall below 116487-110k.
Sell at 119436, target 116487-110k, stop loss 120372.
Bullish range isn't strong
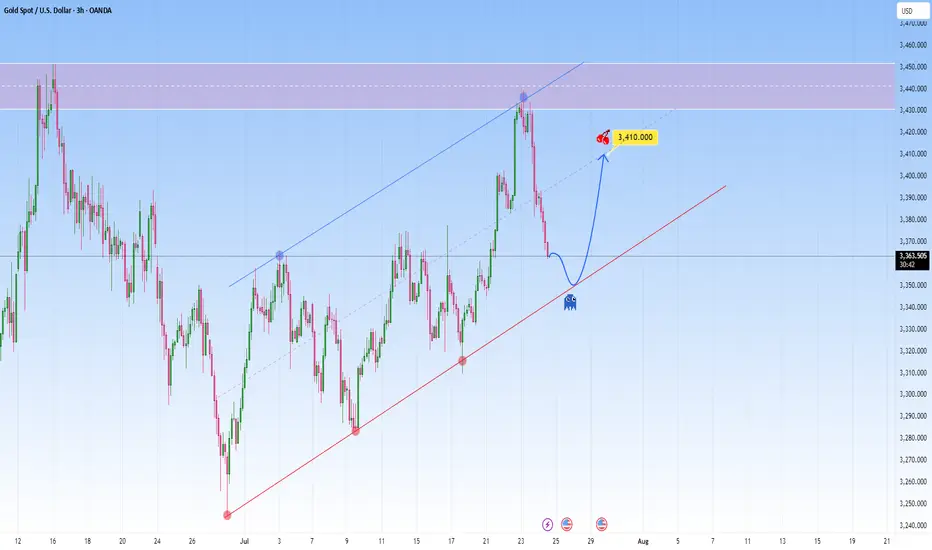
GOLD Reawakened: Corrects firmly but conditions remain bullishFrom a technical perspective Gold is climbing in a parallel channel, clearly bullish with a rhythm that’s hard to ignore. Price just bounced off the resistance with force, a classic overextension flush.
And the market is now approaching the lower boundary of this projected channel. This confluence of technical support is likely to attract renewed buying interest.
I expect it to bounce back toward 3,410, somewhere around the middle of the channel. The move up may not be determined right away. It could be consolitaing, fake dips first, or sudden acceleration.
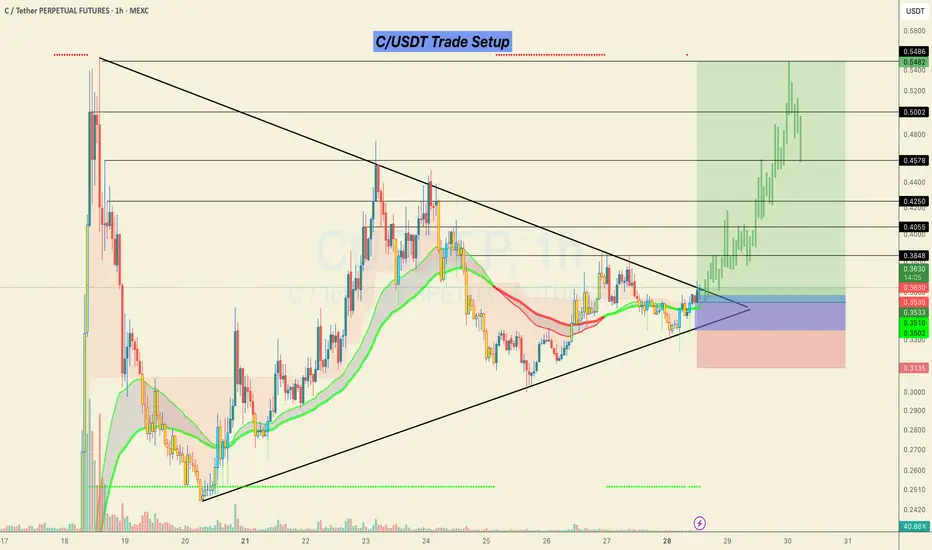
#C/USDT Looks ready for a 50% bullish move.C/USDT Trade Setup 📉
Currently forming a strong breakout structure after a long consolidation inside the triangle.
📌 Accumulation Zone:
0.3350 – 0.3580
🎯 Targets (Black Horizontal Levels):
0.4055
0.4250
0.4578
0.5002
0.5486
🛑 SL: Below 0.3135 (previous structural low)
Price broke out with solid momentum and retested the breakout zone. As long as we hold above the EMAs and the structure remains intact, continuation toward higher levels is likely.
This is a low-risk, high-reward setup as long as the risk is managed properly.
> Not financial advice. Trade at your own risk.
Do hit the like button if you want me to post more of these setups here.
Thank you
#PEACE
This Chart Screams Breakout – Are You In?AUD/USD – Bullish Setup Brewing
AUD/USD has been respecting this rising channel beautifully, with clean higher highs and higher lows.
Back in April, we saw a classic bear trap, price wicked below support, lured in shorts, and then reversed sharply. That fakeout sparked a strong rally and confirmed demand.
Currently, price is consolidating near the Key Resistance Zone and bouncing off the lower trendline again a sign of strength.
If this pattern continues, we could soon see a breakout above the upper trendline, potentially sending AUD/USD flying toward 0.68+.
Outlook:
As long as the structure holds, dips are for buying. Bulls remain in control.
DYOR, NFA
Thanks for the reading

Report - 28 jully, 2025Executive Summary
In a historic move to defuse transatlantic trade tensions, the United States and the European Union have struck a landmark agreement imposing a 15% blanket tariff on EU goods. The deal, brokered between President Trump and EC President Ursula von der Leyen, includes sweeping European commitments to increase purchases of American energy and military equipment—amounting to more than $1.35 trillion. This not only averts a trade war but realigns fiscal, defense, and industrial policy across the Atlantic. Meanwhile, Germany will escape EU sanction for deficit overruns due to elevated defense spending, and China has intensified its diplomatic push to lead AI governance, openly challenging U.S. technological hegemony.
These developments unfold amid a broader recalibration of global capital flows, with Chinese investors pouring record funds into Hong Kong equities, Brazil doubling down on BRICS despite tariff threats, and private equity investors increasingly opting for liquidity over continuation vehicles. All these signals point to a shifting world order, where economic fragmentation, tech rivalry, and military investment dominate the strategic calculus.
Market Reactions
Markets have reacted with cautious optimism. The resolution of the US-EU dispute has removed one of the most immediate risks to global trade, stabilizing risk sentiment. Equities across developed markets are firmer, while defense, energy, and industrial stocks in the U.S. have caught a fresh bid. European auto and export sectors remain under scrutiny given the tariff imposition, despite the broader stability.
The dollar softened slightly on expectations that the trade deal will reduce the likelihood of retaliatory disruptions, even as tensions over chip tariffs and Brazil’s alignment with BRICS persist. Gold briefly rallied but then settled as inflation expectations were tempered by diplomatic de-escalation. Oil prices remain subdued as demand signals remain weak despite energy reordering.
Fiscal and Political Implications
The US-EU agreement marks a major geopolitical win for Trump. The EU's commitment to spend $750 billion on U.S. energy and $600 billion on military procurement illustrates a fundamental pivot in the bloc’s external policy alignment. Politically, this underscores Washington’s ability to extract economic concessions under threat of tariffs—further validating Trump’s unilateralist negotiation style.
Germany’s exemption from EU deficit procedures further highlights Brussels’ strategic flexibility in an era where defense is taking precedence over fiscal austerity. Berlin will be allowed to run a deficit of 3.3% of GDP in 2025, thanks to a “national escape clause” invoked to cover expanded defense spending. This sets a precedent for other member states to follow suit, potentially unleashing a wave of fiscally supported rearmament across the EU.
Meanwhile, China's unveiling of a 13-point AI governance plan signals an emerging regulatory bifurcation in global technology. The push for a UN-backed AI governance body—and the positioning of its open-source models for Global South collaboration—challenges U.S. regulatory primacy and may spark a new front in the AI cold war.
Strategic Forecasts
The medium-term outlook is increasingly defined by strategic spending, tech sovereignty, and the weaponization of trade. The U.S. will likely continue to deploy tariffs not just for balance-of-trade concerns, but also to enforce strategic compliance. This tactic will carry mixed implications for global markets: inflationary near-term, but ultimately supportive of U.S. industrial and defense equities.
Europe’s gradual pivot toward U.S. alignment will create internal friction, especially among member states hesitant to cede strategic autonomy. At the same time, China’s AI diplomacy and Brazil’s defiance of U.S. tariffs will continue to fragment global consensus, creating an increasingly multipolar and protectionist macro environment.
Continued uncertainty around the Federal Reserve’s independence—as Trump ramps up pressure on Powell—will contribute to short-term volatility in bond and currency markets. The likelihood of delayed rate cuts or a politically forced pivot is increasing.
Risks and Opportunities
Risks include renewed tariff escalations, especially targeting tech, chips, and Brazil. Europe’s fiscal leniency could spook bond markets if perceived as unsustainable. In private equity, continuation vehicle fatigue risks forcing markdowns across illiquid portfolios.
Opportunities emerge in defense, energy, and AI-linked equities. The U.S. stands to benefit from a surge in industrial demand, while Chinese tech firms could capitalize on regulatory arbitrage in emerging markets. Open-source AI adoption will favor hardware and semiconductor exporters, particularly in Asia.
Asset Impact Analysis
Gold (XAUUSD):
Gold showed initial strength on trade fears but retraced as the deal lowered immediate inflation risk. With Powell’s position under political threat and long-term fiscal expansion in play, the bullish bias remains intact. Expect gold to test $3,400 in Q3 if Fed guidance shifts dovishly. Near-term support lies at $3,300.
S&P 500 (SPX):
Markets welcomed the trade clarity and defense spending surge. Industrials, defense, and energy are clear beneficiaries, while tech gains from relaxed macro pressure. Continued pressure on Powell could add volatility.
Dow Jones (DJIA):
Dividend-heavy Dow components in defense and manufacturing are poised to outperform. Trade normalization and fiscal leniency in Europe favor global cyclicals.
USDJPY:
With Japanese inflation slightly below forecast and the BoJ still cautious, yen strength is capped. U.S. political drama may induce mild USD weakness but not enough to break 145 convincingly.
DXY (US Dollar Index):
The dollar may weaken modestly as tariff resolution reduces safe-haven demand and the Fed comes under pressure to cut. A break below 103.00 would confirm a bearish turn.
Crude Oil (WTI):
Oil remains stuck in a neutral range. Although the EU will buy more U.S. energy, weak demand signals and lackluster PMI data keep prices rangebound. A breakout above $72 requires more forceful geopolitical tension.

GBPUSD LONGTERM BUYWe have H4 BUY range
Followed by SELL range (retracement)
SELL range turn to BUY range.
I expect to buy around 1.3410 (After confirmation = PRICE REJECTION)
TP: 1.3787 (Between there I will have small BUY AND CLOSE trade)

GBPCAD | One Kiss at 1.8390, and I’m All In!The big picture of GBPCAD is BUY possible up to 1.8550
See the H4 BUY range?
It slid love note to BUY into my DMs since 17/JulY. I didn't fall blindly since H4 SELL range came in like a jealous ex.
So I flipped to SELL and I shared my love signal with you here. (check my last week GBPCAD signal).
See that bottom black line at 1.8370?
It got a gentle kiss from the Daily candle (REJECTION).
Then 15m already whispered, "a sweet breakout"!
📌LONG STORY SHORT, I'M BUY AT 1.8390
If H4 comes and kisses 1.8390 (just a touch and wick), I’m BUYING — no more playing hard to get. 😘
TP? 1.8490 — that’s a sweet 100-pips date night!
But if it cuddles (closes by body) That’s it — my heart will be broken. 💔
WISH ME LUCK...or TISSUES! 😂!!!

Temporary SELL then BUYAs we said, BIG picture BUY.
Yesterday temporary sell since H1 range was still SELL.
Today H1 range is BULLISH.
We expect temporary SELL from 147.22/42 (After confirmation we will get Snip entry)
TP1: 146.45 (BUY ZONE)
Note: If It will go to BUY ZONE (146.45) first before SELL ZONE (I wont sell)


GBPCAD 15M SHORT BUY THEN BIG SELL15m range turn SELL
Note: The 15 SELL is inside BUY range.
So we need to BUY first
WAIT for confirmation around 1.8425. Once done price will bull up to 1.8466-1.8480 before SELL to 1.8380

USDJPY Cooking Something – Here's Where I’ll BiteTHE BATTLE OF MY BLUE LINES 📉
The big picture of USDJPY is BUY possible up to 149.35.
I see H1 send me love note to BUY (range) but 15m reject it by forming SELL range.
Conflict? No! This means there is temporary reversal (BEARISH).
Two top BLUE LINES (147.75/85) are where I can SELL my love story. I will first wait H4 to Kiss either of the line. Since 15m SELL range already formed, I ’ll jump in like a love-struck fool (AGGRESSIVE).
TP: Middle BLUE LINE (147.21) = Dating spot for Buyers.
Middle BLUE LINES (147.21, 147.00)
If H4 price come and KISS (touches and leave wick) in either of these, I’m rushing to 15m to catch that BUY breakout.
If H4 price come and CUDDLE (close by body),I’ll cozy up to SELL (after confirmation) and ride it all the way down to 146.42, the Bottom BLUE LINE. 📉
In Bottom BLUE LINE (146.42) = Buyers Chilling Zone
If H4 price come and KISS (touches and leave wick), I’m rushing down to 15m to catch that BUY breakout — love at first touch!
If H4 price come and CUDDLE (close by body), my trading heartbreak season will start!
WISH ME LUCK.!!!

EURUSD TEMPORARY BUY THEN SELLBIG picture SELL
There is Temporary BUY since 15m SELL range swiped to BULL.
The BULLISH can start from 1.1736 (BUY ZONE) (I WONT BUY IF SELL ZONE TAPPED FIRST)
TP: 1.1762 (SELL ZONE)
SELL ZONE (1.1762/1.1770) After confirmation SELL.
TP: 1.1710
