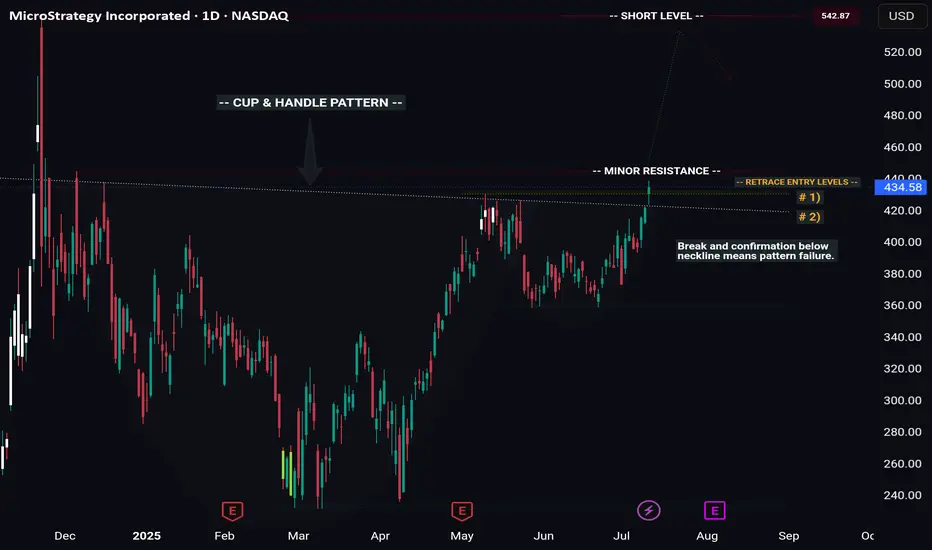
MSTR -- Cup & Handle Breakout // Long & Short SetupsHello Traders!
There is a beautiful cup and handle pattern that has formed on MSTR (Microstrategy).
This pattern offers us a wonderful long setup, as well as a potential short at the all time high.
Pattern Failure: If price both breaks and confirms below the C&P neckline the pattern is void.
Price will likely temporarily pull back from the all time high, giving us our short setup. However you'll want to be in and out quick considering price will likely continue to new highs after pulling back.
I will be swing trading the long setup and likely day trading the short setup.
Have fun and best of luck to everyone on their trading journey!
Beyond Technical Analysis
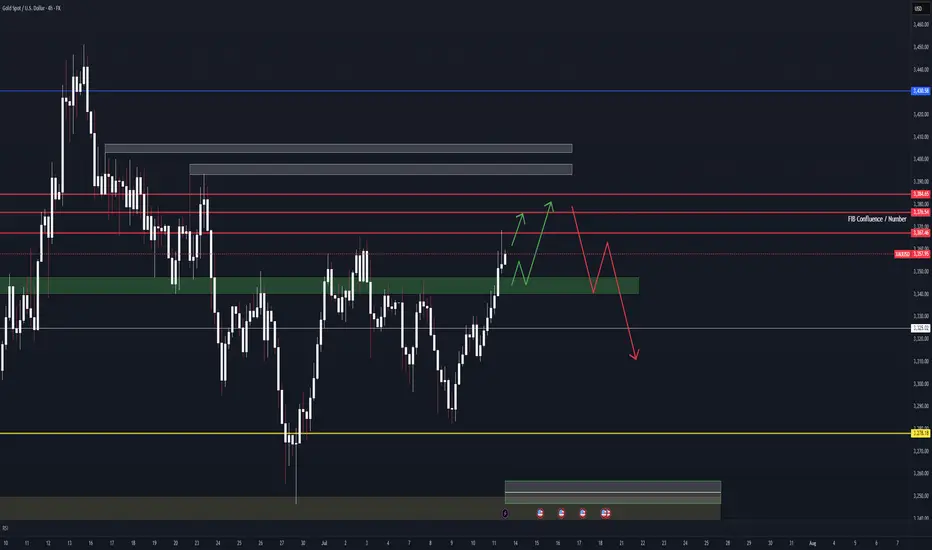
Expecting a slight Pull Back for gold I’m expecting a slight pull back on gold for the first day of trading week as always. A consolidation will always happen first before flushing retails out. 3339-3353 could be a possibility for bulls / long positions continuing higher. Breaking lower by EOD we can expect more bears to come in.
As always my analysis is for reference. Not an advised. Trade with your own due diligence. Risk management is always important for trading. Stay safe. Trade safe.

SP500, above the GAP bullish, below the GAP…As simple as it can be. Below the GAP, very bearish.
Ideally, a sharp move down would confirm
My bias.

FET — AI Market Wake-Up Above $0.801. Watch for breakout & close above $0.80
2. Enter on confirmed weekly hold > $0.80
3. TP: $1.12–1.25 (major resistance)
4. Key support: $0.73–0.71 (must hold)
5. Stop: below $0.71

EUR/USD Sells from 1.17200 back downWeekly Outlook: EUR/USD (EU)
This week, my bias on EUR/USD is similar to GBP/USD, as both pairs have been following a consistent bearish trend. Based on this structure, I’ll be watching to see if price begins a retracement back into an area of supply.
I’ve marked out the 8-hour supply zone, which sits at a premium level and was responsible for the last break of structure to the downside. If price retraces into this zone, I’ll look for potential sell confirmations on the lower time frames.
If price doesn’t tap into the supply zone first, I’ll then shift my focus to the 8-hour demand zone below. In that case, I’ll watch closely for signs of accumulation and a bullish reaction from this level, which could signal the start of a rally.
Confluences for EUR/USD Sells:
✅ Bearish trend has been consistent for the past few weeks.
✅ Breaks of structure have formed new supply zones to trade from.
✅ Liquidity exists below current price, which may be targeted first.
✅ The lower demand zone remains unmitigated, suggesting further downside movement.
📌 On the way down toward demand, I expect price to form another break of structure to the downside. The plan is to ride the sells down into demand, then look for potential buy opportunities if price begins to accumulate and react.
Let’s stay sharp and disciplined — have a solid trading week, everyone! 📊

Resistance zone: 3265.0-3321.30
Hello, traders.
If you "Follow", you can always get the latest information quickly.
Have a nice day today.
-------------------------------------
(ETHUSDT 1D chart)
It is showing an upward breakout of the important zone of 2419.83-2706.15.
We need to see if the price can be maintained by rising above the Fibonacci ratio of 0.5 (2788.93).
If so, it is expected to rise to the resistance zone of 3265.0-3321.30.
The important zone of 2419.83-2706.15 is the support and resistance zone that can lead to a full-fledged uptrend.
Therefore, if it falls below this zone, we should stop trading and watch the situation.
-
Thank you for reading to the end.
I hope you have a successful trade.
--------------------------------------------------
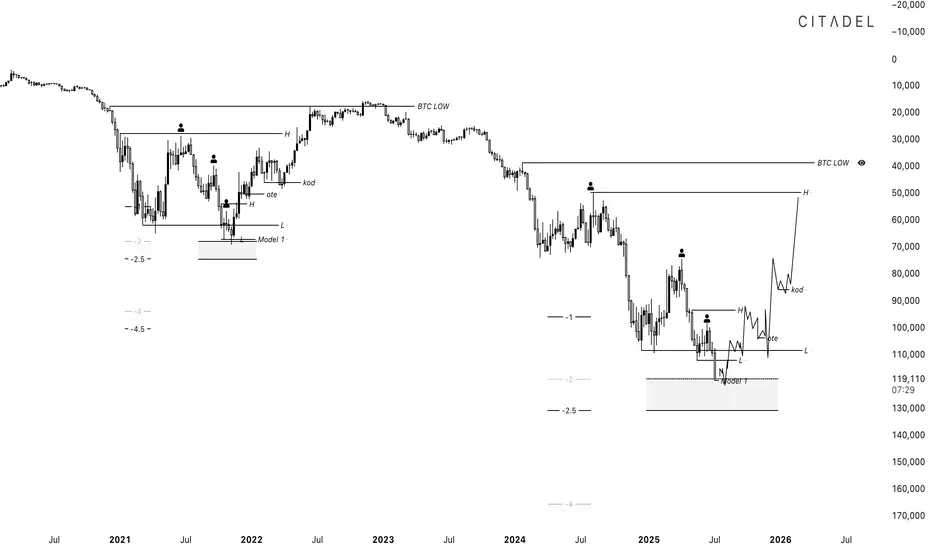
- This is an explanation of the big picture.
(3-year bull market, 1-year bear market pattern)
I will explain more details when the bear market starts.
------------------------------------------------------

Inverted BTC tells the full storyahhh here we are again bulls with the same playbook late in the cycle. we will see 40k before 200k
GBP/USD Shorts from 3hr/5hr supply zoneMy analysis this week centers around the continuation of the bearish trend we've been observing. Recently, there was a break of structure, and a new supply zone has formed—indicating a potential continuation of the downtrend.
I’ll be waiting for price to retrace back into these Points of Interest (POIs), where I’ll look for lower time frame confirmations to catch potential sell entries and ride the move down.
I believe there’s still some bearish pressure left, and I expect price to continue falling until it reaches the 6-hour demand zone. Once we approach that area, I’ll begin looking for Wyckoff accumulation patterns as a signal for a potential reversal or rally to the upside.
Confluences for GBP/USD Sells:
✅ GBP/USD has been bearish over the past few weeks, and this trend may continue.
✅ Breaks of structure have occurred, forming fresh supply zones ideal for entries.
✅ Liquidity exists below current price, which may get swept before a reversal.
✅ The lower demand zone still needs to be mitigated, suggesting more downside movement first.
📌 If price fails to react properly at the 3-hour supply, I’ll be watching for a move into the 5-hour supply zone, which sits in a more premium area and may offer a cleaner reaction.
Let’s stay patient and focused — wishing everyone a profitable trading week ahead! 📉💼

BUYTrend Line Break
Previous Day Volume
Rejection Point
Untapped Order Point
Asian Session
High Structure Swing

EURUSD BUY So we have nice weekly fvg below along with a strong pivot point we could possibly see price reach this level before the push to the upside. I’m pretty confident we will have a strong push to the upside due to the macroeconomics and positioning of key players as they are still very bullish on the euro as we still creating higher highs consistently. A lot of people are in sells right now so we could see them taken out before the move to the downside they the EurUsd buy will be in play .

Check if there is an upward breakout of 0.21409-0.22958
Hello, traders.
If you "Follow", you can always get the latest information quickly.
Have a nice day today.
-------------------------------------
(DOGEUSDT 1D chart)
HA-High and HA-Low indicators are converging.
Accordingly, if it breaks through the 0.21409-0.22958 section, it is expected to surge.
However, since the DOM(60) indicator is formed at the 0.46635 point, we need to look at how the DOM(60) indicator is newly created.
It seems possible that the DOM(60) indicator will be newly created while shaking up and down in the 0.21409-0.31600 section, which is the HA-High indicator ~ DOM(60) indicator section of the 1M chart.
If the DOM(60) indicator is newly created, we need to check whether it is supported in the HA-High ~ DOM(60) section.
If it rises above the HA-High ~ DOM(60) section, it is likely to show a stepwise upward trend.
-
To summarize the above, it is as follows. - Buy range: 0.16343-0.22958
- Resistance range: 0.31600-0.37778
If the price breaks through the resistance range upward and maintains, there is a high possibility that the upward trend will continue in the medium to long term.
-
Thank you for reading to the end.
I hope you have a successful transaction.
--------------------------------------------------
- Here is an explanation of the big picture.
(3-year bull market, 1-year bear market pattern)
I will explain the details again when the bear market starts.
------------------------------------------------------

SellTrend Line Break
Previous Day Volume
Rejection Point
Untapped Order Point
Asian Session
High Structure Swing

XAU/USD analysis & outlookWeekly Outlook: GOLD (XAUUSD)
This week, I’ll be monitoring different scenarios, as price is currently far from any of my key Points of Interest (POIs).
My nearest potential buy is around the 3-hour demand zone. While it's not the most ideal entry—since it isn’t located in a discounted area—I’ll still keep an eye on it.
That said, I would prefer to see a deeper retracement into the 6-hour demand zone, which is in a far more discounted region. This zone offers a stronger setup, and I could see price launching from there again if tapped.
We’ve already seen a strong bullish reaction from last week’s demand zone, and based on current momentum, I could see price continuing upward until it reaches my next sell opportunity—the 3-hour supply zone, which sits at a premium level.
Confluences for GOLD Buys:
✅ Bullish structure — price has broken to the upside and remains overall bullish.
✅ Fresh 3H and 6H demand zones formed, which price could return to.
✅ Liquidity above — including trendline liquidity and previous Asia highs.
✅ Fundamentals — potential tariff cuts could fuel long-term bullish momentum for gold.
✅ Bearish Dollar Index (DXY) aligns with the bullish gold outlook.
📌 If price doesn’t retrace and instead continues to push higher, I’ll wait for another break of structure to the upside on the way toward the supply zone before reassessing entries.
Let’s stay focused and let the market come to us. Wishing everyone a great trading week ahead! 👊📈

GBP_USD RISING SUPPORT AHEAD|LONG|
✅GBP_USD is going down now
But a strong rising support level is ahead
Thus I am expecting a rebound
And a move up towards the target of 1.3600
LONG🚀
✅Like and subscribe to never miss a new idea!✅
Disclosure: I am part of Trade Nation's Influencer program and receive a monthly fee for using their TradingView charts in my analysis.

XAUUSD - Breakdown: CPI Week The only news I am focusing on this week is the mighty CPI coming up this week. With oil & energy prices creeping higher, I expect CPI to come in just in line to prediction or slightly elevated, though nothing too drastic, this keeps us in a higher-for-longer rate environment, fueling a DXY bullish bounce and keeping the Gold bears in play. If the data surprises, we’ll adjust accordingly and trade accordingly.
If the numbers land in line with forecasts: No real surprises, market already priced in. In this case, the outlook is neutral to slightly bearish.
If below forecast, a weaker CPI print could increase the odds of an early rate cut. That will likely weaken the dollar, which is good for $Gold. So, this will lead to bullish sentiment for $XAUUSD.
Will also watch RISK ON/OFF Sentiment
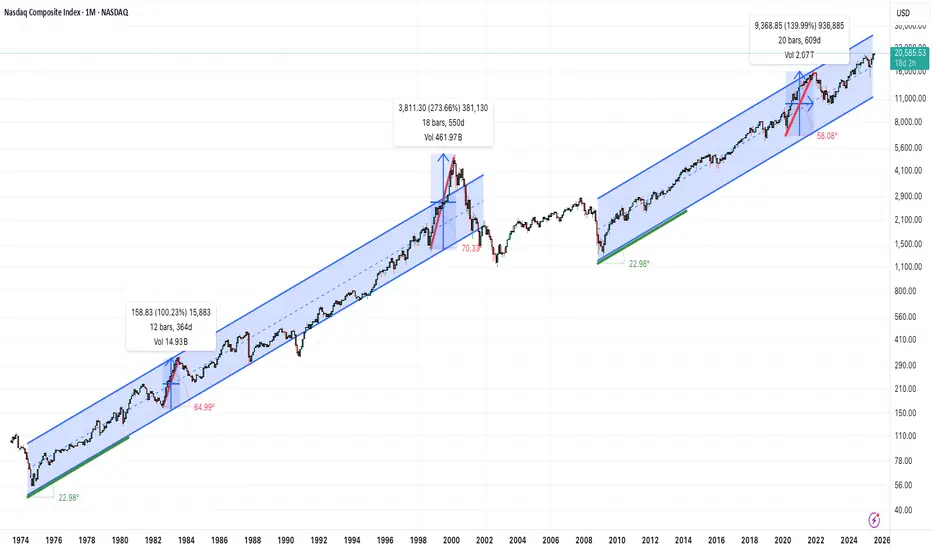
Is the Nasdaq in a bubble?On the monthly timeframe, there are no signs of an over-extended, parabolic condition for the Nasdaq Composite(IXIC).
It's interesting to note that for a 25 year period from 1974 to 1999 the overall trend was roughly a positive 23 degree angled climb. We see that again in the current 16 year trend that started in 2009.
Much steeper parabolic periods can be seen in shorter time frames like the 1998-2000 move, where the angle reached 70 degrees. That didn't end well. It's also worth noting that in 1982 and 2020 we saw similar behavior, though slightly less frothy. Both of those periods were also followed by significant retracements.
Maybe we are at the beginning of one of those multi-month, over-extended runs. But not seeing it today. If we are trading at 45,000 or more in 2026, that's a different story...
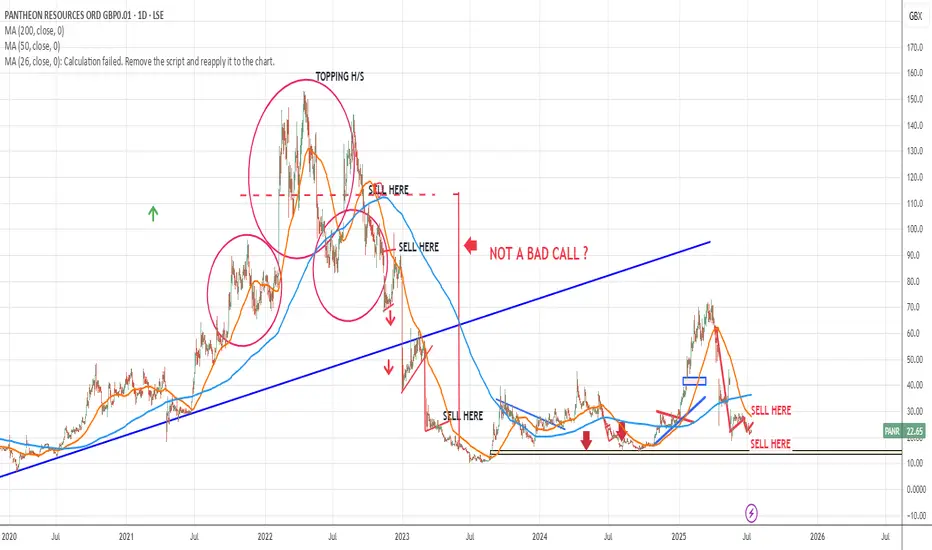
"PANR" shortI gave a sell signal around November 2022.
Look back..
No way this is a real share,,
BWTFDIK
SSB
XAU/USD Setup THIS WEEK
Expecting a drop into the 3300–3310 zone, where we have:
4H Fair Value Gap
Trendline confluence
Liquidity below New York Low
From there, looking for a potential bullish reaction targeting:
📈 3405 – area with resting liquidity above recent highs.
📍 No confirmed bullish structure yet — waiting for a shift on the 5M/15M timeframe to confirm entry.

sol sell midterm"🌟 Welcome to Golden Candle! 🌟
We're a team of 📈 passionate traders 📉 who love sharing our 🔍 technical analysis insights 🔎 with the TradingView community. 🌎
Our goal is to provide 💡 valuable perspectives 💡 on market trends and patterns, but 🚫 please note that our analyses are not intended as buy or sell recommendations. 🚫
Instead, they reflect our own 💭 personal attitudes and thoughts. 💭
Follow along and 📚 learn 📚 from our analyses! 📊💡"

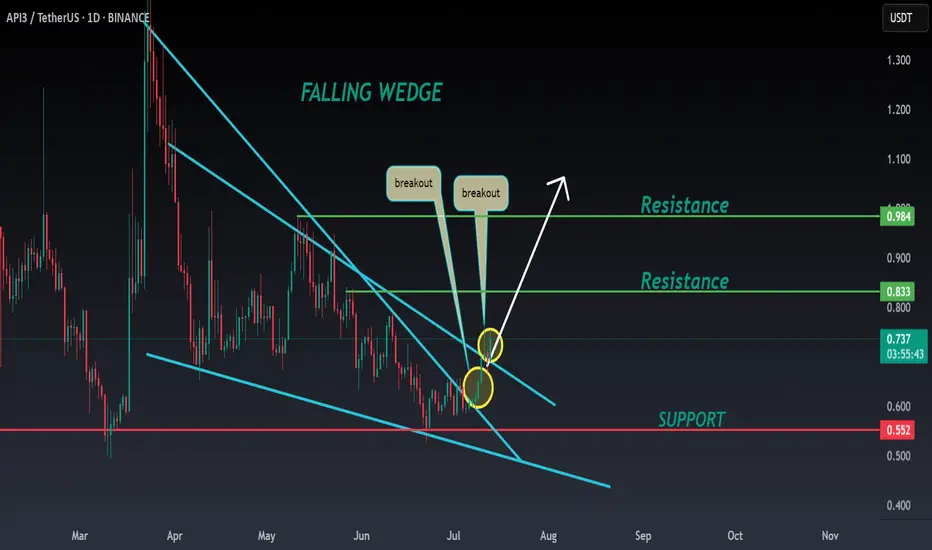
API3 ANALYSIS🚀#API3 Analysis :
🔮As we can see in the chart of #API3 that there is a formation of "Falling Wedge Pattern". In a daily timeframe #API3 broke out the pattern. Expecting a bullish move in few days if #API3 retest the levels
⚡️What to do ?
👀Keep an eye on #API3 price action. We can trade according to the chart and make some profits⚡️⚡️
#API3 #Cryptocurrency #TechnicalAnalysis #DYOR
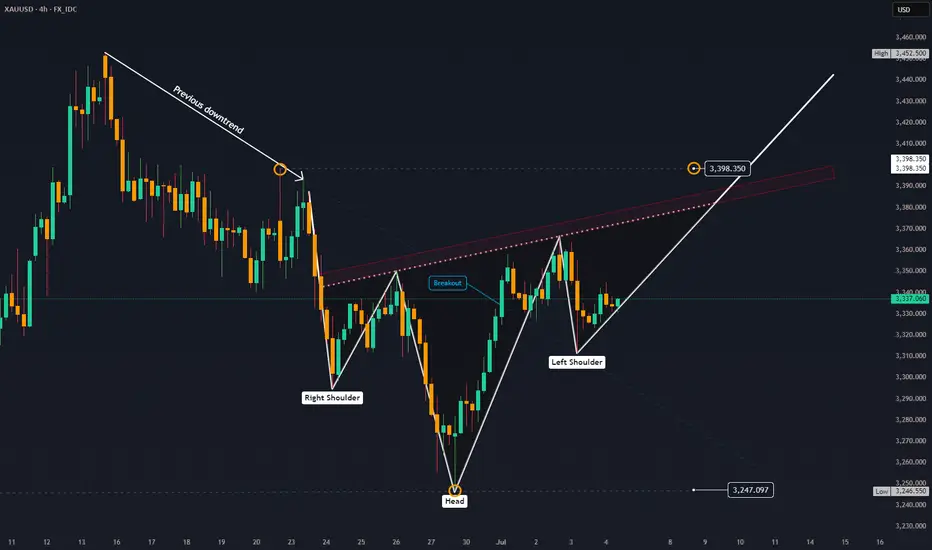
Looking for catalysts - Gold Outlook July 7 - July 11, 2025All about last week you can find here:
FX_IDC:XAUUSD Gold is currently seeking fresh catalysts this week. 🧐
While the economic calendar appears light for this time of year, a lack of economic data doesn't mean nothing is happening. Geopolitical events, especially tariff wars or other flashpoints, remain significant. Are there increasing signs for peace in the Middle East between Israel and Hamas? 🕊️
This week Gold could take advantage from an exisiting reversal head and shoulders pattern and painting pitchfork in the chart shows possibillities for Upside targeting $3400.
## Geopolitical News Landscape 🌍📰
Israel / Iran ⚔️🛑☢️
After fierce clashes in June, a **ceasefire** began June 24. 🇮🇷 Iran's Supreme Leader reappeared July 6, claiming victory 🎤. Tehran has now **banned IAEA inspectors** ❌🔍. Over 900 Iranians reportedly killed ⚰️.
🔮 Outlook: ⚠️ Nuclear tensions growing, diplomacy frozen 🧊. Regional powers remain on high alert 🚨.
India / Pakistan 🗻🔫🕌
Tense calm in Kashmir 😐. India launched its sacred **Amarnath Yatra** 🕉️ under heavy security 🛡️. Pakistan killed 30 militants near the Afghan border ⚔️, while China 🐉 admitted sharing intel 📡.
🔮 Outlook: Diplomatic track stays open 🕊️, but **border flare-ups** and water disputes 💧 remain volatile 🔥.
Gaza Conflict 💣🏘️🕊️
Israel launched deadly airstrikes ✈️, including one on a beach café ☕🏖️ killing 22. Dozens more died 💔. IDF admitted accidental strikes on aid sites 🚚❌. U.S.-led talks seek a **60-day truce** 🤝.
🔮 Outlook: Ceasefire possible 🛑, but **humanitarian crisis** worsening 🚨🩺. Trust remains fragile 💔.
Russia / Ukraine ⚔️
Zelenskyy 🇺🇦 and Trump 📞 discussed new air defense aid 🎯. Russia answered with **massive drone strikes** on Kyiv 🚁🔥. NATO boosts arms shipments 🔫 and backs Ukraine’s domestic weapons production 🏭.
🔮 Outlook: War grinds on ⚙️. No peace in sight, with **global stakes** rising 📈.
U.S. / China Trade War 💼📦🔥
With new tariffs looming 📆💣, Treasury said “multiple deals” are near 🤝. Trump claimed a **partial deal with China** 🐉, though tariffs remain high 📊.
🔮 Outlook: More piecemeal deals 🍰, but a **full-scale trade reset** looks unlikely before elections 🗳️.
🌍 Global Trade War 📉🚢💸
Trump’s shifting tariffs 🎯 hurt global growth 🌐. Markets hit record highs 📈 but investment chills ❄️. The 💵 dollar had its sharpest 6-month drop 📉 in decades.
🔮 Outlook: Businesses remain cautious ⚠️. **Supply chains** reroute 🔄. No global rebound without clarity 🔍.
Trump vs. Powell 💥🏛️📉
Trump demanded Powell’s resignation ❌📉, accusing him of weak rate policy 📊. Powell held firm 🧊, citing inflation risks 📈. Trump eyes replacements 👀🪑.
🔮 Outlook: Fed independence 🏛️ under fire 🔥. **Rate policy** may get politicized ahead of 2025 elections 🗳️.
📈 U.S. Inflation 🛒💰🧾
Inflation slowed to 0.1% 🐢, but tariffs raised prices on appliances 🔌 (+4.3%) and toys 🧸. Fed projects 3% inflation by year-end 📊.
🔮 Outlook: As **tariffs bite** 🦷, inflation likely to climb 📈. Fed stays cautious 🧐 on cuts.
Technical View 📐📈
Analysis Period: May 25 - June 6, 2025 | Forecast: June 7-11, 2025
1. ICT (Inner Circle Trader) Methodology Analysis 🧠
Market Structure
Higher Timeframe Bias: The chart shows a clear bullish market structure with higher highs and higher lows from the major low around 3,250. 🐂
Current Structure: Price is in a consolidation phase after reaching highs near 3,370, showing potential distribution. ⚖️
Key ICT Concepts Identified:
Fair Value Gap (FVG): Multiple gaps visible during the strong rally from 3,250 to 3,370. 💨
Order Blocks: Significant demand zone around 3,250-3,260 level (major accumulation area). 📦
Liquidity Zones:
Buy-side liquidity above 3,370 (recent highs). 💸
Sell-side liquidity below 3,320 (recent consolidation lows). 📉
Market Maker Models: Classic accumulation-manipulation-distribution pattern visible. 🔄
Session Analysis:
London Session: Shows strong directional moves. 🇬🇧
New York Session: Continuation of trends with increased volatility. 🗽
Asian Session: Consolidation and range-bound behavior. 🌏
2. Gann Analysis 🧙♂️
Gann Angles & Time Cycles:
Primary Trend: 1x1 angle supporting the bullish move from 3,250. ↗️
Resistance Angles: 2x1 and 3x1 angles providing resistance around current levels. 🚧
Time Cycles:
7-day cycle showing completion around June 2-3. 🗓️
14-day cycle suggesting potential reversal window June 7-9. ⏳
Gann Price Levels:
Major Support: 3,250 (1/8 level). 🛡️
Current Resistance: 3,370 (7/8 level). 🛑
Next Target: 3,400 (full octave completion). 🎯
Geometric Relationships:
Price squared relationship suggests 3,380-3,400 as natural resistance. 📐
Time-price balance indicates consolidation period before next major move. 🕰️⚖️
3. Fibonacci Analysis ✨
Retracement Levels (from 3,250 low to 3,370 high):
23.6%: 3,341.6
38.2%: 3,324.2
50.0%: 3,310.0
61.8%: 3,295.8
78.6%: 3,265.6
Extension Levels:
127.2%: 3,402.6
161.8%: 3,444.2
200.0%: 3,490.0
Current Analysis:
Price has respected the 23.6% retracement level multiple times. ✅
Strong support confluence at 38.2% level (3,324). 💪
Extension targets suggest potential move to 3,402-3,444 range. 🚀
4. Institutional Levels Analysis 🏦
Psychological Levels:
3,300: Major round number providing support. 💯
3,350: Mid-level resistance. 📊
3,400: Next major psychological target. 🎯
Institutional Order Flow:
Accumulation Zone: 3,250-3,280 (heavy institutional buying). 💰
Distribution Zone: 3,350-3,370 (profit-taking area). 💸
Breakout Target: 3,400+ (next institutional objective). ⬆️
Volume Analysis:
High volume on the initial move up from 3,250. 📈
Decreasing volume during consolidation (typical distribution pattern). 📉
Volume expansion needed for breakout confirmation. 💥
5. Cycle Timing Analysis ⏰
Short-Term Cycles:
3-day cycle: Currently in compression phase. 🤏
7-day cycle: Completed around June 2-3. ✅
14-day cycle: Due for completion June 7-9. ⏳
Medium-Term Cycles:
Monthly cycle: Bullish momentum phase. ⬆️
Quarterly cycle: In expansion phase. 🌟
Cycle Projection:
Next major cycle turn expected June 7-9. 🔄
Potential for either breakout or correction during this window. 🤞
6. FORECAST: June 7-11, 2025 🔮
Primary Scenario (60% probability): Bullish Breakout 🚀
Target 1: 3,400-3,410
Target 2: 3,440-3,450
Catalyst: Break above 3,370 with volume. 💥
Timeline: June 7-9 initial move, June 10-11 extension.
Secondary Scenario (35% probability): Corrective Pullback ⬇️
Target 1: 3,320-3,325 (38.2% Fibonacci)
Target 2: 3,300-3,310 (psychological support)
Catalyst: Failure to break 3,370 resistance. 🚫
Timeline: June 7-8 decline, June 9-11 consolidation.
Low Probability Scenario (5% probability): Deep Correction 📉
Target: 3,280-3,290 (61.8% Fibonacci)
Catalyst: Major risk-off sentiment. 😱
Timeline: Extended throughout the week.
7. Key Assumptions & Risk Factors 🤔
Bullish Assumptions:
Continued institutional accumulation at current levels. 🏦
Breakout above 3,370 with confirming volume. ⬆️
Favorable macroeconomic backdrop for gold. 🌍
Weakness in USD supporting gold prices. 💵
Geopolitical tensions maintaining safe-haven demand. 🕊️
Bearish Risk Factors:
Profit-taking at psychological 3,400 level. 🤝
Stronger USD due to economic data. 💹
Reduced safe-haven demand. 📉
Technical failure at key resistance levels. 🚧
Central bank policy shifts. 🏛️
8. Trading Recommendations 💡
Entry Strategies:
Bullish Setup: Buy on pullback to 3,340-3,345 with stop below 3,320. 🎯
Breakout Play: Buy break above 3,372 with stop below 3,350. 🚀
Conservative: Wait for retest of 3,324 support area. patiently 🧘
Risk Management:
Position Size: Limit to 2-3% of portfolio per trade. 📏
Stop Loss: Always use stops below key support levels. ⛔
Take Profit: Scale out at Fibonacci extension levels. 💰
Key Levels to Watch:
Immediate Resistance: 3,365-3,370 🛑
Support: 3,340-3,345 🛡️
Breakout Level: 3,372 🚀
Major Support: 3,320-3,325 💪
9. Conclusion ✅
The XAUUSD chart presents a constructive bullish setup with multiple confluences supporting higher prices. The completion of various cycles around June 7-9 suggests a potential catalyst for the next major move. While the primary bias remains bullish targeting 3,400+, traders should remain alert to the possibility of a corrective pullback to test lower support levels. 🧐
The institutional accumulation pattern, combined with favorable Gann angles and Fibonacci projections, supports the bullish thesis. However, proper risk management is essential given the potential for volatility around key psychological levels. ⚠️
Please take the time to let me know what you think about this. 💬
-------------------------------------------------------------------------
This is just my personal market idea and not financial advice! 📢 Trading gold and other financial instruments carries risks – only invest what you can afford to lose. Always do your own analysis, use solid risk management, and trade responsibly.
Good luck and safe trading! 🚀📊
1D, chart analysis.
Drawn from the major swing low ($3,500):
0.236 Level = $3,418 → minor resistance
0.618 Level = $3,274 → critical retracement (gold bounced near this)
1.000 Level = $3,131 → absolute support
These levels suggest the retracement may be over, and price could be prepping for a new push.

"XAG/USD: BULL FLAG FORMING? LAST CHANCE TO JUMP IN!"🔥 XAG/USD "SILVER RAID" – Bullish Loot Grab Before the Cops Arrive! 🚨💰
🌟 Greetings, Market Pirates & Profit Bandits! 🌟
Based on the 🚨Thief Trading Style🚨 (a ruthless mix of technicals + fundamentals), we’re plotting a day/swing trade heist on XAG/USD (Silver). Our mission? Loot bullish gains before hitting the police barricade (resistance zone). Stay sharp—this is a high-risk, high-reward escape plan with overbought signals and bearish traps lurking!
📜 THE HEIST BLUEPRINT
🎯 Entry (Bullish Swipe):
"Vault is OPEN!" – Long at any price, but for smarter thieves:
Buy limit orders near swing lows/highs (15m-30m TF).
DCA/Layering strategy: Spread entries like a pro bandit.
🛑 Stop Loss (Escape Route):
Nearest swing low/high (1H candle body/wick) → 36.700 (adjust based on risk & lot size).
Risk management is key! Don’t get caught by the market cops.
🏴☠️ Take Profit (Escape Before Handcuffs!):
First Target: 38.500 (or bail earlier if momentum fades).
Scalpers: Only play LONG! Use trailing SL to lock profits.
💡 WHY THIS HEIST? (Market Drivers)
Bullish momentum in Silver (XAG/USD) fueled by:
Macro trends (COT report, sentiment shifts).
Intermarket moves (Gold correlation, USD weakness).
Potential breakout from consolidation.
⚠️ News Risk: Major releases can trigger volatility—avoid new trades during high-impact events!
🚨 THIEF'S PRO TIPS
✅ Trailing SL = Your getaway car.
✅ Small accounts? Ride the swing traders’ coattails.
✅ Big wallets? Go full-throttle.
✅ Boost this idea 💥 to strengthen our robbery squad!
📌 DISCLAIMER (Stay Out of Jail!)
Not financial advice! DYOR, manage risk, and adapt to market changes.
Silver is volatile—trade smart, not greedy.
🤑 NEXT HEIST COMING SOON… STAY TUNED! 🕵️♂️
🔗 Want the Full Intel?
Check the fundamentals, COT reports, and intermarket analysis for deeper clues! (Klick the 🔗🔗).
💬 Drop a comment if you’re joining the heist! 👇
