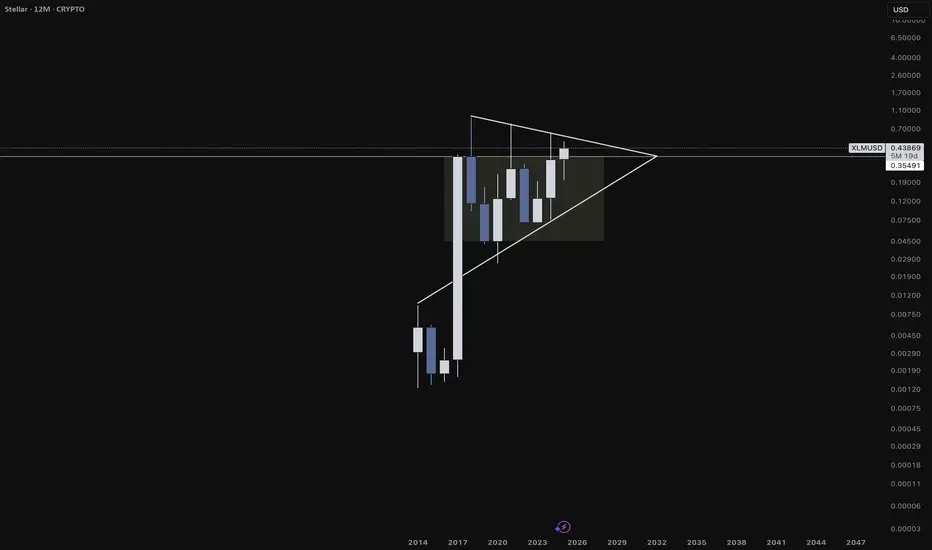
Here's Why XLM is on the Verge of a Massive breakoutThe next 10 years of success for the Stellar Network (XLM) are being shaped by decisions, developments, and trends happening right now (2024–2025). Here’s a breakdown of the long-term shaping factors currently in motion that will influence Stellar's trajectory through 2035:
------------
🌍 1. Real-World Use Cases Being Built Now
Stellar is not waiting for hypothetical adoption — it’s already deploying use cases that are foundational to its future success.
Examples:
MoneyGram Access gives real people the ability to cash in/out of crypto in over 180 countries.
USDC on Stellar enables stablecoin remittances with instant settlement and low fees.
Stellar Aid Assist provides governments and NGOs a working model for humanitarian digital cash aid.
Long-Term Impact: Building trust and infrastructure in the real world now means exponential network effects later — especially in emerging markets where crypto utility > speculation.
-------------------------------------------------------------------------------------------
🛠️ 2. Soroban (Smart Contracts) Rollout
Stellar is rolling out Soroban, a Rust-based smart contract platform that will transform the network into a programmable blockchain.
Why Soroban is Important:
Enables DeFi, lending, NFTs, on-chain identity, and DAOs.
Designed for predictable gas fees, making it ideal for finance and compliance.
Makes Stellar more competitive with Ethereum, Solana, Avalanche, etc.
Long-Term Impact: Soroban turns Stellar into a platform where real, decentralized applications can live — critical for long-term value capture and developer retention.
-------------------------------------------------------------------------------------------
🌐 3. Laying Global Payment Infrastructure
Stellar is quietly building global payment rails through partnerships with:
Fintechs (MoneyGram, Leaf, Settle, Cowrie)
Stablecoin issuers (Circle for USDC, Novatti for AUDC)
Payment aggregators in Africa, Latin America, Southeast Asia
Long-Term Impact: By 2030, these partnerships could evolve into a globally interconnected network of on/off ramps, anchors, and stablecoins. This gives Stellar real utility far beyond speculation.
-------------------------------------------------------------------------------------------
🏛️ 4. Regulatory Alignment & Compliance Tooling
The Stellar Development Foundation (SDF) is heavily involved in regulatory dialogue, including:
Working with the BIS Innovation Hub and IMF working groups
Building on-chain compliance tools (e.g. KYC/AML anchor guidelines)
Developing the Stellar Disbursement Platform, which complies with aid distribution requirements
Long-Term Impact: As crypto becomes more regulated, networks that built with compliance in mind will thrive. Stellar is positioning itself as a compliant blockchain for finance, especially for governments and NGOs.
-------------------------------------------------------------------------------------------
💸 5. Tokenization of Real-World Assets (RWAs)
The future of blockchain is heading toward tokenizing everything — and Stellar is already positioning itself at the front of that movement.
Franklin Templeton tokenized a U.S. mutual fund on Stellar.
Stablecoins like USDC and native fiat tokens are in active use.
Discussions are ongoing around CBDC pilots and tokenized bonds.
Long-Term Impact: The network that supports the most trusted tokenized assets — from CBDCs to real estate to securities — will gain enormous value from volume and liquidity. Stellar is in that conversation now.
-------------------------------------------------------------------------------------------
🧠 6. Mission-Aligned Ecosystem Funding
The Stellar Development Foundation holds billions of dollars in XLM and is using it to:
Fund early-stage startups building on Stellar
Run accelerator programs and hackathons
Expand into new regional markets (Africa, Asia, LATAM)
Long-Term Impact: Unlike many ecosystems that fizzle due to lack of funding or misaligned VC interests, Stellar has long-term strategic capital to guide the network toward its mission of financial access.
-------------------------------------------------------------------------------------------
🔐 7. Security, Speed, and Simplicity
From day one, Stellar has prioritized:
Fast block finality (~5 seconds)
Very low fees (< $0.001)
Energy-efficient consensus (SCP – Stellar Consensus Protocol)
These strengths are especially important for high-volume, low-margin applications like:
Micropayments
Remittances
Real-time settlements
Tokenized wages and aid
Long-Term Impact: As the blockchain infrastructure layer for finance matures, efficient networks will dominate. Stellar’s technical foundation makes it a sustainable long-term option.
-------------------------------------------------------------------------------------------
🧭 8. Stellar’s Focused, Long-Term Vision
SDF’s mission isn’t to be “just another smart contract chain” — it’s to improve access to equitable financial services, especially in underbanked regions.
That vision is:
Clear
Consistent
Attractive to partners, governments, and NGOs
Long-Term Impact: Clarity of mission = better talent, partners, funding, and resilience during market cycles.
-------------------------------------------------------------------------------------------
Beyond Technical Analysis
XAUUSD Daily Sniper Plan – July 14, 2025Hey team 👋 and welcome to a fresh new week on the charts!
We’re starting this Monday without any major news — just pure price action, clean zones, and structure doing all the talking. No distractions. No excuses. Let’s lock in our focus and let the market show us where the edge is.
🔸 Bias: Bearish while below 3390
Last week’s rejection from the H1 premium zone (around 3375) created clear signs of exhaustion. Price is now forming lower highs and lower lows, with clean CHoCHs on both H1 and M15. Until we reclaim 3390, we remain bearish — waiting for the next lower high to form.
🔽 Sniper Sell Zones (above current price)
3360–3370 → H1 premium FVG + CHoCH OB + EMA5 cap
3380–3390 → Inducement zone + internal imbalance + RSI divergence
🔼 Sniper Buy Zones (below current price)
3310–3320 → Discount FVG + BOS base + HL support
3280–3290 → Final HL structure zone + fib 61.8% + OB + RSI oversold
🟡 Decision Zone:
3330–3340 → Neutral zone
→ Wait for break and retest or rejection confirmation.
→ No setup = no trade.
🧠 Battle Plan – Execution Scenarios:
🔴 Scenario A – Bearish Setup Active:
If price returns to 3360–3370 or 3380–3390 and shows M15/M30 rejection → enter short.
Target: 3330 → 3310.
If 3390 is broken and held → cancel short bias.
🟢 Scenario B – Bullish Setup Activated:
If price sweeps 3320 or 3290 and reacts with strong bullish PA (engulfing or CHoCH) → enter long.
Target: 3340 → 3360.
No confirmation = stay flat, do not anticipate.
🟡 Scenario C – No Reaction / Choppy Flow:
If price consolidates between 3330–3340 without clean rejection or break → wait.
Let price show its hand. Today is Monday — we need clarity, not emotion.
Every level in this plan was drawn with purpose — no shortcuts, no borrowed zones.
If you value structure, discipline, and originality in your trading, you’re in the right place.
Your support means everything — I see every 🚀 and every comment, and I appreciate this community deeply.
Let’s keep growing, with real work and real structure.
Follow GoldFxMinds — we stay sharp, we stay true. 💛
📎 Trade Nation Disclaimer
Chart and structure based on Trade Nation broker feed on TradingView. For educational purposes only — not financial advice.

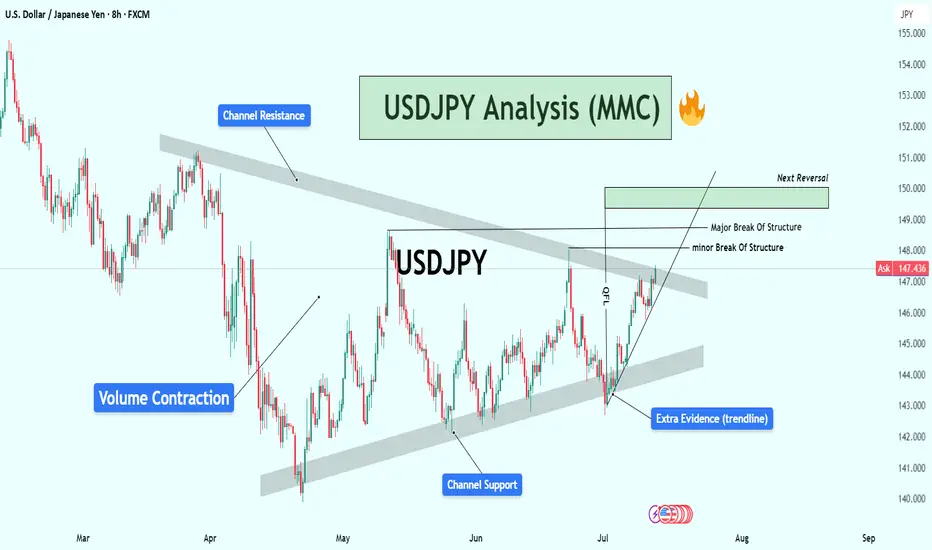
USDJPY Analysis : Major Move Loading Towards Target Zone🕵️♂️ Overview
The USDJPY pair is approaching a critical turning point within a well-established descending channel structure. After several months of corrective movement and internal structure shifts, the market is now displaying multiple layers of confluence pointing toward an impending major reaction or reversal. Let’s break down this chart step by step.
🧱 Market Structure Analysis
🔹 Descending Channel:
The entire chart is governed by a broad descending channel, with price making lower highs and lower lows since early March.
Each touch of the channel support has led to a bounce, and the price is now once again near channel resistance, creating a possible reaction zone.
🔹 Volume Contraction Phase:
In the mid-section of the chart, we observe volume contraction, indicating liquidity drying up and buyers/sellers entering a phase of uncertainty.
This contraction is typical in accumulation or re-accumulation phases, which often precede strong impulsive moves — exactly what followed here.
🧩 Structural Breaks and Trendline Clarity
🔸 Minor Break of Structure:
A recent high was taken out in early July, marking a minor break of structure (BOS), showing the first signs of bulls taking short-term control.
🔸 Major Break of Structure:
A more significant high (marked on the chart) has also been broken, confirming a major BOS — this implies institutional positioning or a shift in market sentiment.
🔸 Trendline Break – Extra Confirmation:
The bullish push came after breaking a clean internal trendline, which acted as diagonal resistance.
Once this trendline broke, price aggressively accelerated upward — this is a classic market maker cycle (MMC) Phase 2 (expansion) move.
📍 Confluence at Next Reversal Zone (149.00 – 150.00)
The green highlighted zone is the next potential area for bearish pressure to return, based on:
Key Supply Zone: Historical area where sellers previously dominated.
Channel Resistance Confluence: Top of the descending channel aligns with this zone.
Psychological Level: 150.00 is a major psychological round number — often attracts profit-taking and institutional activity.
Fibonacci (if plotted): Likely 78.6% – 88.6% retracement from last swing high.
Overextended Rally: Price has rallied strongly since early July with very little correction — it’s approaching exhaustion.
🔄 Market Maker Cycle (MMC) Alignment
This move perfectly reflects the Market Maker Cycle:
Accumulation: During volume contraction phase.
Manipulation: Fakeouts near channel support to trap shorts.
Expansion: Break of structure + trendline, aggressive rally.
Distribution (Next): Likely to occur at the 149–150 zone with a sharp rejection.
🧠 Trader’s Plan – What to Look For
📈 If Bullish:
Targets: 148.80 to 149.80 zone
Hold until rejection signs (bearish candles, volume spikes, divergences)
SL: Below recent swing low/trendline (~146.00)
📉 If Bearish (After Rejection):
Watch for:
Strong bearish engulfing candle or shooting star
RSI/MACD divergence (not shown but suggested)
Break of short-term ascending trendline
Targets: Back toward 145.50 or mid-channel (dynamic)
🔖 Summary
USDJPY is showing clear signs of bullish exhaustion near the upper channel resistance and major structure levels. If price respects this zone (149–150), expect a healthy corrective leg or full reversal. Multiple layers of technical evidence, including structure breaks, trendline breach, and MMC phases, are aligning for a high-probability play.
This is a textbook setup for experienced traders watching key zones with proper confirmations.
XAGUSD Weekly Analysis (MMC) : Bullish Channel Toward Target🧠 1. Trend Shift Confirmed – Silver in Full Bullish Momentum
Silver has officially broken free from its multi-year sideways range and has entered a well-defined ascending channel, pushing toward higher highs week after week. The momentum is strong and supported by a combination of technical elements, structure shifts, and clean retests.
The trend is now clear: bullish, with the price aiming for the Next Reversal Zone between $46 and $48 — a level not seen since mid-2020.
🔷 2. Blue Ray Break – Start of the Rally
The breakout began with a clean move above the Blue Ray trendline, a key structure that had suppressed Silver’s growth for several years.
As the chart notes:
“Blue Ray Always Continue Trend” — until broken.
Once Silver broke above this resistance, it not only confirmed the trend reversal but also triggered the formation of a new bullish market structure, supported by aggressive buying.
🔁 3. SR – Interchange Zone Holding Strong
The SR Interchange zone (around $27 – $30) has played a critical role in this breakout. It acted as:
Resistance during the multi-year range.
Then Support after the breakout, confirming a classic Support-Resistance Flip (SRF).
This zone now serves as a solid demand base, giving the rally a stable foundation to push higher.
🪙 4. QFL Formation – Momentum Confirmation
The breakout also aligns with a QFL (Quick Flip Level) structure — a powerful bullish continuation pattern.
QFL setups form when price breaks above a former base, pulls back slightly, and then quickly resumes the upward trend.
This indicates that buyers are aggressive and unwilling to let price fall too far, fueling a rally.
Combined with the ascending channel, the QFL structure gives extra confidence that Silver is on track to reach the $46–$48 Reversal Zone.
📏 5. Trendline & Channel – Price Structure in Control
Silver is currently moving cleanly within an ascending parallel channel, respecting both upper resistance and lower support trendlines. The inner trendline has been tested multiple times, and price is now riding its upper half.
This shows:
Buyers are in control.
Each correction is shallow.
Market confidence is growing week after week.
Expect volatility to increase as Silver approaches the next target area.
🎯 6. Next Reversal Zone: $46 – $48
The green box at the top marks the Next Reversal Zone, where Silver might:
Stall temporarily and consolidate.
Or face a pullback back toward the mid-channel line or lower support.
This zone corresponds to:
Historical supply area (2020 highs)
Strong psychological resistance
Potential profit-taking by institutions or swing traders
🔭 Trade Scenarios to Watch
✅ Bullish Continuation:
If Silver maintains support above $36 and remains inside the ascending channel, we may see a smooth ride into the reversal zone. Look for:
Break-and-retest of the midline
Bullish candles with long wicks on dips
⚠️ Short-Term Rejection:
If price reaches $46–$48 and shows signs of exhaustion (like long upper wicks, evening star, or bearish engulfing), expect a healthy pullback toward $35–$36 or even $32.
As long as the ascending structure holds, bulls remain in control.
🧩 Key Technical Levels
Element Zone / Level Action
SR Interchange Support $27 – $30 Strong demand zone
Blue Ray Breakout Confirmed Trend reversal signal
QFL Zone Around $36 Retest and rally confirmation
Reversal Zone $46 – $48 High-probability reaction area
Trendline Support Dynamic ($35–$36) Bullish channel continuation
📌 Final Thoughts:
Silver is now playing in the big leagues again. With the Blue Ray broken, QFL confirmed, and price following a disciplined trendline channel, this rally looks both technically sound and fundamentally strong.
Watch the $46–$48 zone carefully. Whether price rejects or breaks through, there will be high-probability setups for both breakout traders and dip buyers.
Stay disciplined, don’t chase, and let price give you confirmation.

XAUUSD H4 Outlook – July 15, 2025After a sharp early-week move, gold is now pressing into H4 supply with clean CHoCHs and clear inducement in play. With CPI data and multiple FOMC speakers on deck, volatility is rising — and so are the opportunities. Let’s break down the current structure.
🔸 H4 Market Bias
Bias: Bearish unless we close firmly above 3420
Structure: Internal bearish flow remains → HL formed at 3210 → CHoCH → current move likely inducement
Context: Price has filled key FVGs and is testing unmitigated OBs in premium, with RSI approaching exhaustion
🔼 Zones Above Current Price:
3445–3465:
This is the weak high and final layer of buy-side liquidity. It includes an unfilled FVG and marks the upper limit of the premium range. If price reaches this zone, it’s likely to act as a trap before a deeper rejection.
3405–3420:
A clean imbalance zone left after the initial CHoCH push. It has already shown rejection once and is now positioned as the key area where a lower high could form. If price reacts here, it confirms continuation to the downside.
3360–3385:
This is the core supply OB, created from the CHoCH. It also aligns with the premium boundary and EMA21 resistance. Current price is already reacting here. Rejection confirms the bearish bias.
🔽 Zones Below Current Price:
3340–3355:
A minor wick-fill zone from past reactions. It may provide a small pause, but it’s structurally weak and more likely to break on momentum. Not a major support.
3300–3280:
This is the key intraday demand zone. It’s built from a previous BOS and sits at the 50% retracement of the last bullish leg. If this zone breaks, we open up deeper downside potential.
3240–3210:
The strongest demand OB on the chart. This is the HL origin and the 61.8% fib zone. If gold reaches here, expect a major decision: bounce or break.
3185–3160:
The final liquidity base under the higher low. If price sweeps this zone, it signals a major shift — potentially invalidating the June rally structure.
📊 Indicators & Flow Notes:
EMAs (5/21): Crossed bullishly, but testing overextension at 3360
RSI: Leaning overbought → potential for rejection at current zone
Volume: Bearish pressure expected if price fails to close above 3385
Fibonacci (last bullish leg): 50% sits at 3285; 61.8% near 3250
🧠 Trade Scenarios:
🔸 Bearish Setup (preferred):
→ Reject inside 3405–3420 → form LH under 3420 → clean drop toward 3300
→ Ideal confirmation = rejection wick or bearish engulfing on M30–H1
🔸 Bullish Breakout (less likely):
→ Break and hold above 3420 = potential squeeze into 3445–3465
→ Must be supported by CPI upside miss or dovish FOMC tone
→ But 3445–3465 remains weak liquidity — not a safe continuation zone
I appreciate every 🚀, comment, and follow I see on my plans.
If this breakdown helped sharpen your outlook, let me know below.
I post real levels with precision — no hype, just clean structure.
Keep following for daily sniper plans built from logic, not noise. 💼⚔️
--GoldFxMinds--
Chart and structure based on Trade Nation broker feed on TradingView. For educational purposes only — not financial advice.

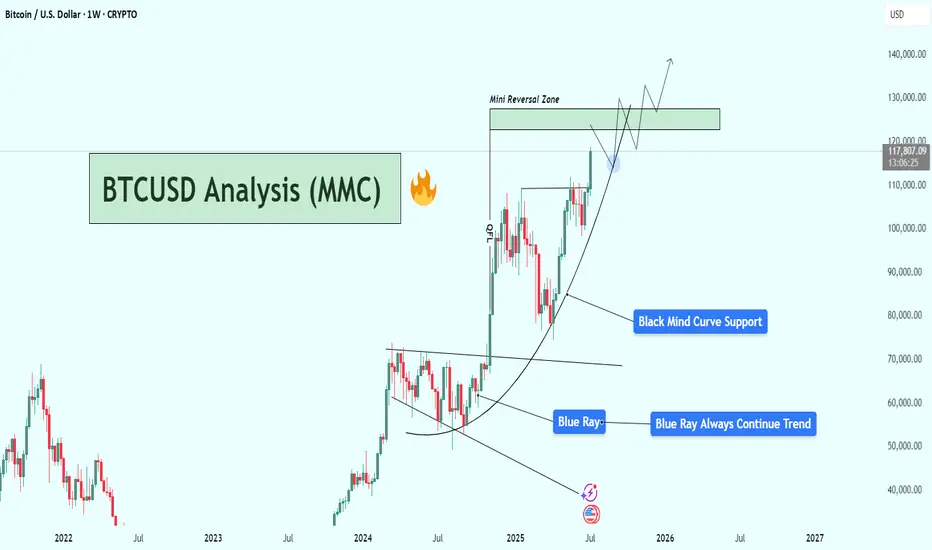
BTCUSD Weekly Analysis : Testing $130K Resistance + Next Target📌 1. Big Picture – Bitcoin is in a Parabolic Uptrend
This chart clearly shows that Bitcoin has shifted from a consolidation phase into a full-blown parabolic rally. That’s not just random growth — it’s an aggressive, momentum-driven market move that usually only happens during major bull cycles.
The curve shown in black — labeled “Black Mind Curve Support” — is your guide here. It's not a simple trendline. It shows how Bitcoin is accelerating upward, and this curve acts as a dynamic support. Every time price dips to it, buyers jump in fast — which shows strong bullish pressure and market confidence.
🔍 2. Blue Ray Broken = Trend Change Confirmed
Earlier, BTC was stuck under the Blue Ray, a long-term resistance trendline. As marked:
“Blue Ray Always Continue Trend”
That means, as long as price stays under it, the market is bearish. But guess what?
BTC broke above it — strongly.
That break confirmed a reversal in long-term structure, and it triggered this massive upward move. This breakout also aligned with a pattern of higher highs and higher lows, further confirming that bulls are now in full control.
🧠 3. Current Situation – Heading Into Mini Reversal Zone
Now BTC is trading around $117,820, and it's approaching the green box labeled Mini Reversal Zone — between $125,000 and $135,000.
Why is this area important?
It’s a psychological zone (big round numbers).
It lines up with historical resistance and previous supply zones.
It’s where smart money might take some profit, so we could see rejection or a short-term pullback here.
🎯 4. Two Scenarios to Watch
✅ Scenario A: Mini Pullback & Retest
BTC hits the Mini Reversal Zone → stalls → pulls back → retests the Black Mind Curve → bounces again.
That’s bullish and normal in a healthy uptrend. If you missed earlier entries, this pullback could be your golden opportunity.
🚀 Scenario B: Breakout of Reversal Zone
If Bitcoin breaks above $135K with strong momentum and closes the weekly candle high, we may see another parabolic rally toward $140K+.
This would mean even stronger buyer interest, possibly driven by FOMO, ETFs, or macro news.
📉 What Could Invalidate the Bullish Move?
Only if BTC:
Breaks below the Black Mind Curve, and
Starts closing weekly candles under $105K–$100K
That would mean the curve is broken, momentum is lost, and we might go into a consolidation or deeper correction.
But for now? No signs of weakness. Trend is strong, volume is rising, and price action is clean.
🧩 Summary of Key Levels
Type Level Notes
Curve Support Dynamic ($105K–$110K) Critical for trend continuation
Mini Reversal Zone $125K – $135K Watch for rejection or breakout
Bullish Target $140K+ If breakout holds above reversal zone
Trend Indicator Black Mind Curve As long as price rides this, bulls are in control
📌 Final Thoughts
This BTC chart isn’t just a random uptrend — it’s a well-structured parabola, powered by strong technical support and clean breakouts. Everything is lining up for a potential monster move, but don’t chase price blindly.
Watch the Mini Reversal Zone closely. If we see rejection, be ready to buy the dip. If we break through with volume — it’s 🚀 time again.
XAUUSD Daily Outlook – July 14, 2025Happy Sunday, traders. Gold opens the week inside a compressed range under key premium resistance, with CPI and FOMC speakers loading the macro agenda. Let’s break down today’s structure and expectations.
🔸 D1 Structure Overview:
Bias: Neutral with bearish pressure building
Trend: Still technically bullish, but compressing between LH OB and mid-range FVG
Current Position:
Price is trapped below 3395, inside a lower high structure
No clear BOS yet — but bearish CHoCH already formed
EMAs are tightening and RSI is neutral → signs of indecision
🧭 Key Daily Zones:
Zone Type Price Range Confluences
🔼 Supply Zone 3448–3465 Daily OB + FVG + Weak High trap + EMA divergence
🔼 LH OB 3385–3395 Structure cap + internal supply + EMA21 rejection
🔽 Mid FVG Demand 3328–3310 Daily FVG + fib midpoint + prior reaction
🔽 Strong OB Support 3260–3245 Unmitigated OB + fib 61.8% + sweep low base zone
Fibonacci: Pullback toward 3310 = mid-retracement of last bullish impulse
EMA 5/21/50: Bearish crossover confirmed, but no strong divergence yet
RSI: Flat, suggesting reactive play — confirmation must come from PA
📊 Macro Outlook:
Core CPI data drops today → key for market expectations on inflation
Multiple FOMC members will speak — high potential for whipsaw moves
Gold may remain volatile and range-bound until post-CPI structure resolution
📌 Trade Scenarios:
Bearish case: Reject from 3385 → continuation toward 3310 or deeper into 3245
Bullish case: Clean break & retest above 3395 → short-term pump into 3460 liquidity
Confirmation matters — follow the reaction at each zone, don’t rush reversals.
✅ I appreciate every 🚀, comment, and follow I see on my plans.
If this breakdown brought you clarity, show some love below.
I post pure structure, no noise — every day.
Keep following GoldFxMinds for sniper insights, real levels, and full transparency on XAUUSD.
Let’s grow sharp, consistent, and fearless — together. 💛
📎 Disclaimer:
Chart and analysis based on Trade Nation broker feed on TradingView.
This is a technical outlook for educational purposes and not financial advice.

XAUUSD Analysis : Bullish Move Toward Key Resistance + Target🟩 Overview:
Gold is currently showing a clear bullish breakout on the 2-hour timeframe. The market structure has shifted from a downtrend into a bullish phase, with price now approaching a critical Reversal Zone. Let’s break down the key levels, structure shifts, and potential trade opportunities.
🔍 1. Structure Shift – Trendline Break & BOS Signals:
The price previously followed a Blue Ray Descending Trendline, which acted as dynamic resistance and guided the bearish trend.
As highlighted, “Blue Ray Always Continue Trend” – but in this case, we’ve seen a clean Break of Structure (BOS) that invalidated the bearish setup.
A Minor BOS occurred first, which hinted at weakening selling pressure.
Later, a Major BOS confirmed the bullish transition as the price broke above a key resistance level with strong momentum.
This transition was supported by consistent higher lows and a breakout above the descending resistance trendline — a classic reversal signal.
🟩 2. Demand Zone Reaction – Major Support Held Firm:
The Major Support Zone between $3,280 – $3,300 provided a strong base for buyers.
Multiple wick rejections and bullish engulfing patterns near this zone indicated aggressive buyer interest.
This support has now become the foundation for the recent bullish rally.
🎯 3. Next Target & Reversal Zone:
The current price is hovering around $3,358, showing strong bullish momentum.
The next major resistance area is marked between $3,380 – $3,400, identified as the Next Target + Reversal Zone.
This zone is critical — it aligns with a historical supply area and the previous market swing highs.
Traders should be cautious here, as price may react sharply. Reversal patterns (like bearish engulfing, pin bars, or double tops) could signal a potential retracement.
⚠️ 4. Trade Plan:
🟢 Bullish Bias (Short-Term):
If you entered from the support or trendline breakout, continue to hold long positions until price nears the reversal zone.
Trail stop-loss under the most recent higher low to secure profits.
🔴 Bearish Scenario (Near-Term Reversal Play):
Watch for bearish rejection patterns in the $3,380 – $3,400 zone.
If confirmation appears, potential short setups could offer a retracement back to $3,330 – $3,320.
📌 Key Levels Summary:
Major Support Zone: $3,280 – $3,300 ✅
Next Target + Reversal Zone: $3,380 – $3,400 ⚠️
Current Price: $3,358
Major BOS Level: Confirmed
Trendline: Broken with strong bullish pressure
🧠 Final Thoughts:
Gold has officially shifted gears. The bullish breakout is in motion, and the trendline break + BOS combo supports further upside — at least until the reversal zone is tested. However, this is also where the market could exhaust, making it crucial to monitor price action closely.
Stay patient, wait for confirmation, and let the levels guide your next move.

Weekly XAUUSD Outlook (July 14–19, 2025)Hey team — we're entering a decisive week on gold as macro tensions heat up and price dances inside a key premium range. Let’s dive into what the chart is telling us.
🔸 HTF Bias: Weekly Structure Breakdown
Bias: Bullish with exhaustion signs
Current candle: Bearish rejection forming after last week's lower high inside the premium range
Trend: Still bullish overall, but stalling inside a distribution-like pattern
Weekly structure:
Confirmed CHoCH in early 2023 launched the bullish leg
Break of structure toward Higher High (HH) continues but weak high was created near 3500
We’re currently inside a weekly premium range, rejecting the upper quadrant
🔸 Key Weekly Confluences:
Zone Type Price Level Confluences
🔼 Resistance 3490–3500 Weak High + Premium zone + FVG + RSI divergence
🔼 Upper Range 3450–3470 Historical imbalance fill + EMA5 overextension
🔽 Support 3355–3320 Weekly OB + Discount side of premium leg + FVG
🔽 Deep Support 3200–3170 Last strong demand + BOS origin + RSI oversold risk zone
Fibonacci Range: 3500 = top of the bullish extension; 50% retracement sits around 3250
RSI (Weekly): Starting to curve down from overbought territory — watch for structure cracks
EMAs (5/21/50): Strong upside lock remains but a flattening 5EMA hints short-term slow-down
🗓 Macro + News Context:
This week is loaded with high-impact U.S. data and a parade of FOMC speakers:
Core CPI (Monday) and Retail Sales (Thursday) = critical for short-term inflation outlook
FOMC members speaking throughout the week = high chance of volatility spikes
Pre-G20 positioning (Friday–Saturday) could lead to risk-off flows or safety bids on gold
Watch Crude Oil Inventories and Building Permits for risk sentiment impact
The combination of CPI, retail sales, and continuous Fed commentary could cause abrupt sentiment swings — especially if inflation surprises to the upside again.
⚠️ What to Watch This Week:
Any weekly close above 3470 = potential sweep into weak high (3500)
Failure to hold 3355 zone = opens the door to revisit the deeper OB around 3200
Look for a lower high inside premium to confirm bearish weekly intent — otherwise we remain bullish
Any bounce from 3320 must show strong volume + FVG reaction to confirm continuation
✅ Final Notes:
This week is all about patience. We’re in a premium exhaustion phase, and with heavy macro catalysts on the table, gold is primed for a decisive breakout — up or down.
Stay flexible. Let price show its hand around the major zones. We’ll refine sniper entries on H4 and H1 once the weekly opens fully.
—
📌 If this breakdown helped, hit 🚀🚀🚀 follow @GoldFxMinds🔔 for daily updates as this structure develops and drop a comment:
Will gold sweep 3500 or collapse toward 3200? 👇
📢 Disclosure:
This analysis is based on the Trade Nation TradingView feed. I’m part of their Influencer Program and receive a monthly fee.
⚠️ Educational content only — not financial advice.

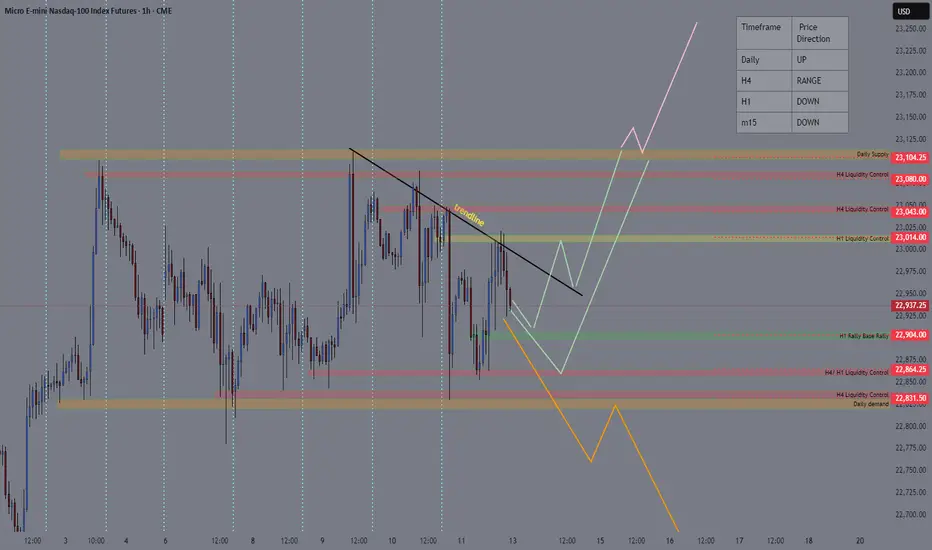
NASDAQ TRADING IDEA FOR 14-18 JULY 2025The price of NASDAQ is ranging between daily supply zone (23100) and daily demand (22830) and respecting trendline to find next liquidity control at h1 base at 22904 or H4/H1 liquidity control at 22864. I am looking for long opportunities at that area depend on how the price action for and wait confirmation before taking long position.
The price will continue to rise if daily supply breakout and form a new higher high at daily timeframe.
The market will shift direction if the daily demand breakout and I’m focusing to find opportunity taking short position at important key level/zone.

GBPAUD Pre-Market Analysis📉 GBPAUD Pre-Market Analysis – Weekly Outlook
Date: July 13, 2025
Session: Pre-London Open
Analyst: Papalui | Sub Saharan Technicals
🕵️♂️ Macro Outlook
The British Pound / Australian Dollar (GBPAUD) is currently showing signs of trend exhaustion after reaching major highs around the 2.14932 zone (Marked MHH – Most Recent Higher High). A strong bearish reaction is emerging from this area, suggesting potential for long-term downside retracement or even a reversal.
🔍 Technical Structure Breakdown (1W)
MHH (Major Higher High): 2.14932
WHH (Weekly Higher High): 2.06088
Current Price: 2.05049
Fib 50% Level: Aligned around recent resistance and acting as a pivot zone.
BOS (Break of Structure): Occurred in early 2022, later invalidated by strong bullish rally.
MLL (Major Lower Low Target Zone): Projected zone around 1.59109 - 1.57752
📉 Bearish Scenario: Reversal Play
🔽 Bias: Bearish Reversal
Context: Price has formed a new high but is rejecting near the 50% Fibonacci retracement and supply zone.
Plan: Watch for lower timeframe confirmations (e.g., D1 or H4 structure breaks) below 2.04859 to initiate short positions.
Target Zones:
TP1: 1.86584
TP2: 1.81327
TP3: 1.59109 – aligning with weekly demand and structural lows
🔧 Invalidation: A sustained weekly close above 2.14932 would invalidate this bearish scenario and signal bullish continuation.
🔁 Trade Management Zones
Zone Type Action
2.06088 - 2.14932 Supply/Resistance Monitor for rejections or confirmations of reversal
1.86584 - 1.81327 Intermediate Support Partial TP or structure reassessment
1.59109 Major Demand Full TP / Trend reversal opportunity
🧠 Sentiment & Strategy
This pair has rallied over the past year, but the bearish impulse from the recent high suggests large players may be unloading positions. With key Fibonacci confluence and price action showing weakness, the current zone is a strong sell interest region. Traders should:
Stay alert for weekly or daily lower lows
Use smaller timeframes to refine entries
Avoid premature entries before price confirms lower timeframe structure breaks
📌 Summary
Bias Key Resistance POI Bearish Target
Bearish 2.14932 2.04859 1.59109
Risk Disclosure:
All trading involves risk. This analysis is for educational purposes only and should not be taken as financial advice. Always manage risk appropriately.

USD Dollar Canadian Dollar AnalysisThe US dollar is gaining strength due to Trump tarrif polices but the strength will be short live. The downward movement might continue around 1.38404 with a stop loss of 1.38676 and take profit of 1.35287

short recovery, trend line✍️ NOVA hello everyone, Let's comment on gold price next week from 07/14/2025 - 07/18/2025
⭐️GOLDEN INFORMATION:
Gold prices surged nearly 1% on Friday as market sentiment soured in response to US President Donald Trump’s controversial trade policies targeting Canada, while hinting at broader tariffs on other nations and copper. At the time of writing, XAU/USD is trading at $3,354, rebounding from intraday lows of $3,322.
On Thursday, Trump announced a 35% tariff on Canadian imports, though goods complying with the 2020 USMCA trade agreement remain exempt. He also signaled intentions to expand tariffs across most trading partners, proposing blanket rates ranging from 15% to 20%.
With a light US economic calendar, attention turned to Fed commentary. Chicago Fed President Austan Goolsbee pushed back on calls for rate cuts aimed at reducing government borrowing costs, stressing the central bank’s focus remains firmly on employment and price stability.
⭐️Personal comments NOVA:
growth according to the trend, maintaining the accumulation price zone above 3300
🔥 Technically:
Based on the resistance and support areas of the gold price according to the H4 frame, NOVA identifies the important key areas as follows:
Resistance: $3392, $3447
Support: $3330, $3308, $3246
🔥 NOTE:
Note: Nova wishes traders to manage their capital well
- take the number of lots that match your capital
- Takeprofit equal to 4-6% of capital account
- Stoplose equal to 2-3% of capital account
- The winner is the one who sticks with the market the longest

Sonic ($S) Price Analysis: Key Levels to WatchThe markings on your chart outline a trading plan based on key price levels:
Resistance (Potential Sell Zones): The red lines at approximately $0.3520 and $0.3660 are acting as price ceilings. For the price to go up, it needs to break through these levels.
Support (Potential Buy Zones): The green boxes represent demand zones where buyers might be interested. The first is around $0.3370 - $0.3400, and the second, stronger zone is near $0.3270 - $0.3300.
The price is currently consolidating between the first support and resistance levels. A decisive break above or below this range will likely indicate the next short-term trend.

Gold – H4 Structure at Key Decision Point | July 14 Outlook🟡 Gold (XAUUSD) – July 14 Outlook | Key Reaction Ahead at 3366
Gold closed Friday at 3355.665 , after facing resistance from the H4 swing high (3366) .
While price failed to break that level during the session, the last H4 candle closed as a bullish spinning top , signaling indecision — but with slight bullish pressure.
As we head into Monday’s open, the next move could be pivotal in determining the direction of the upcoming H4 trend leg.
🔮 Key Scenarios to Watch
1️⃣ Bullish Scenario (Preferred Bias):
If the market opens above 3366 , creating a clean Break of Structure (BoS) , it would confirm the continuation of the H4 uptrend.
→ In this case, we will watch for a retest of the 3320 Order Block (OB) — a potential long setup zone.
→ If price gives another BoS after the first, it may also present a continuation entry opportunity, depending on structure.
2️⃣ Rejection / Bearish Case:
If the market fails to break 3366 , we’ll step back and observe how M15 reacts.
→ Consolidation could follow before any significant BoS.
→ In this scenario, patience is key — we’ll wait for either confirmation of a deeper pullback or a structure shift on lower timeframes.
3️⃣ Consolidation Possibility:
There’s also a strong possibility that price consolidates between the H4 swing high (3366) and the 3320 OB before making a structural decision.
→ A tight range can trap both buyers and sellers — so it’s crucial not to act prematurely.
🧭 Trade Bias Summary
✅ If BoS (above 3366):
→ Bullish bias confirmed
→ Look for long on OB retest (e.g., 3320 zone) or next M15 structure break
⚠️ If No BoS:
→ Step back, observe M15
→ Wait for structure clarity before forming bias
🔁 If Range Forms (3366–3320):
→ Stay out until market resolves direction
→ Let breakout + retest guide the next setup
🧠 Final Thoughts
This analysis is shared for educational and structural observation purposes only — not as trade advice or recommendation.
The goal is to track price behavior around key zones and adapt based on how structure confirms or invalidates bias.
📖 Let the market reveal its intention — not with emotion, but through structure.
We don’t predict the breakout — we prepare for both outcomes.
📘 Shared by @ChartIsMirror

Trading Altcoins for Maximum Profits · StrategyIt is a tricky market. How are you going to trade the altcoins to maximize profits? What's your plan?
Everyday there is always some odd pair that grows 100%+, and we feel attracted to this kind of action. We want to be in and we want to hold those pairs. But, there are hundreds of choices on each exchange and only 1-2 pairs breakup this strongly every few days. Quietly, behind the scenes, everything grows but slowly.
Three months down the road the entire market will be 2-3 levels up, minimum. Some pairs will be up five levels and some even more.
If we fall for the trap of trying to catch the next big move, we can miss the real bullish action that is happening every day. I mean, it is better to buy and hold 5-10 strong good pairs rather than chasing around the dream of big wins. A dream that most often than not never comes.
If you look at 22-June or 7-April, it takes months for a bullish wave to develop. All across, marketwide, it happens step by step. Every day altcoins are growing 2-3%, 5-10%, over and over, again and again.
When we jump around trying to catch the next sudden jump, we miss the safe and secure sustained daily growth. When we finally make the right move and buy the pair that is breaking up strong, there is a 50% bullish breakout but somehow this isn't enough, we want more, more, more. 50%, 70% up and yet, we do not sell, we wait for more. But the entire bullish wave, regardless of how you slice it, takes a minimum of 3 months. Then comes a retrace, fast, or a strong correction, and we sell when prices are low. A strong rise at first and we might end up with just 20-30% gains. And in this way we end up wasting months and months.
Three months later, we do have some gains; it is a bull market after all, but total growth is nothing compared to holding a strong pair long-term. The strong pairs, most of them, end up growing 700%, 800%, 1,000%. When you look at your capital and you are moving around, you see only 100 or 200% total growth. What is happening here?
If you have 2-3 years of spot trading experience, then you can definitely choose 20 good pairs and sell the few that breakup weekly, hold the rest. Each time several pairs breakup strong, collect profits and find the ones trading low. But, if you have less than 2 years experience trading spot, you are better off buying low and holding long-term. You will end up with bigger profits in the end.
There are many ways to approach the market, make no mistake, but a plan is needed to maximize profits. I will continue to share my experience so you can avoid making the same mistake I made back in the days.
I've been trading Bitcoin since 2013, altcoins starting 2015; full time Cryptocurrency since 2017 through present day.
The market is a school and will you give tons of lessons, experience is needed for success. If experience is lacking, planing ahead of time will produce the best results.
To plan, just ask yourself the following questions:
1) How long am I willing to wait after buying a pair?
2) If prices rise, will I sell? If yes, when and by how much?
3) If prices drop, will I close the position at a loss? If no, how long are you willing to wait with a losing pair? If yes, when will you close? At -10%, -20%, -50%?
Answering these questions ahead of time can help you avoid anxiety and stress. The more you prepare, the more you read; higher profits.
Namaste.

BTC crash to 50kLooks like the top is in!
This should propagate into a nice bear run.
Crypto community got BTC to 100,000$
That’s the PUMP
Then the ETF opens the flood gates for corrupt / corporate money supply… that’s the DUMP signal!
Take their money and run!
Where to? Maybe the park… I’m gonna run my DOGE!

GOLD TRADING IDEA FOR 14-18 JULY 2025The price of Gold currently at the H4 liquidity control area at 3376. It's seem like there candlestick H4 rejection at that area but still not valid for market structure shift direction.
If the candlestick breakout above at H4 liquidity control ,I will looking opportunity for long position with target at next H4 liquidity control at 3390 or extension target at 3410.
short term SELL
Price retracement before the price going up.
If small timeframe show market structure shift or develop bearish engulfing pattern at H1 0r m30 below 3376 . The target will be h4 liquidity control at 3354 or 3320 depend on how price act at that area.


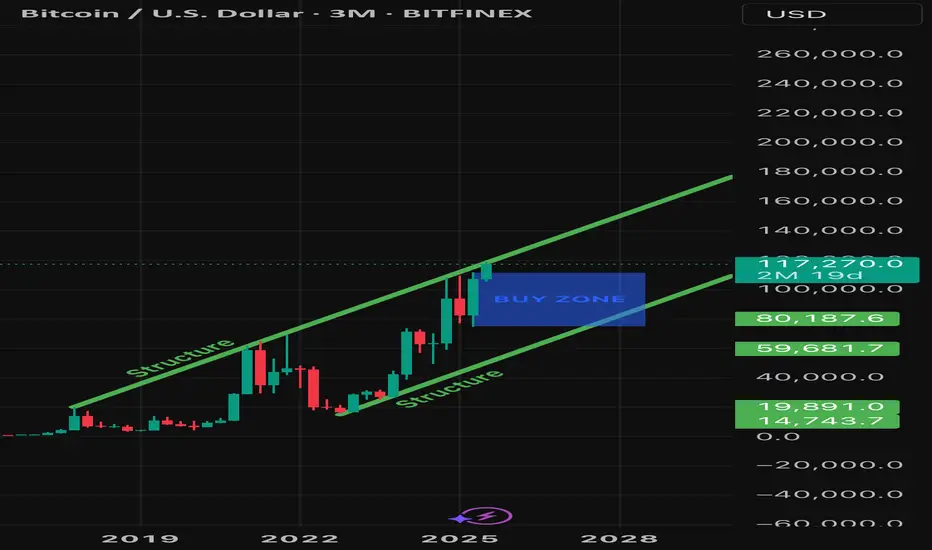
Bitcoin’s ForecastWho knows how high Bitcoin will go but my guess is between 300/350k. What I may know ahead of time is where price may fall, for the buy. I labeled the buy zone which I believe will trigger in January 2027 based off of the pattern Bitcoin has created. I’ve noticed a couple years ago that the best time to buy Bitcoin is in January, the year after being bearish. This is the pattern and you can check for yourselves: 3 years bullish, approximately 1 year bearish. January of 2027 may begin the next bull cycle that could last for 3 years. Stay tuned!
GBP/JPY Low Risk BUYS - SWINGLOW RISK TRADE
If you prefer not to swing you can scalp buys on the pullbacks throughout the week ahead.
GBP/JPY - BULLISH ENGULFING CONFIRMED
A+ SETUP since it has touched
and respected our area of interest.
SL - 185.599
TP1 - 190
TP2 - 192.799
TP3 - 194.681

Next target for the legendary Bitcoin: $143,000🚀 Keep buying the dips all the way to the top.
📈 Algo traders: lock your EAs on LONG.
Need one? Check the link in my bio 😉
#Bitcoin #CryptoTrading #BTC143K #BuyTheDip #AlgoTrading #EAs
