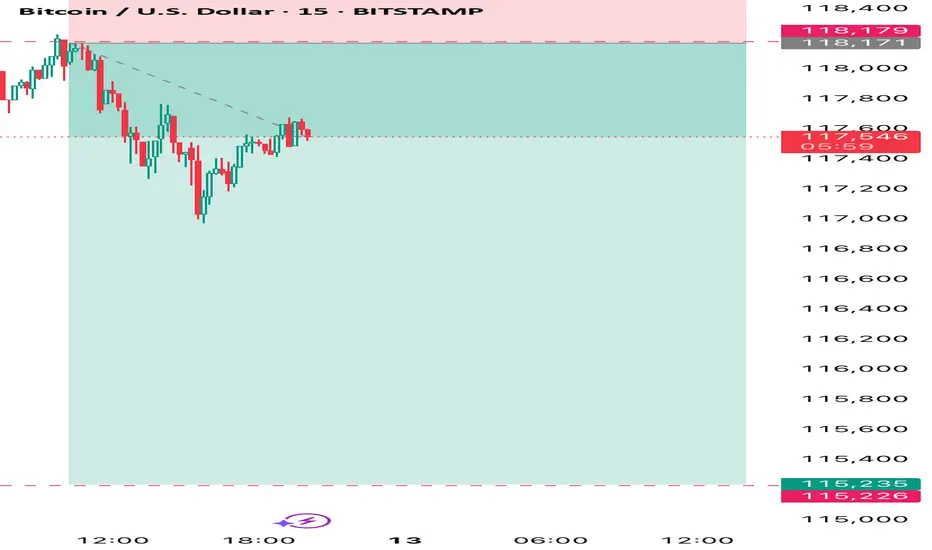
BTCUSD scalpWe are looking at classical liquidity concept in which we anticipate price to pull back $115k in order to determine to continue with the bullish move or not however, for extra confluence, we have to look at buyers and sellers market volume and control
Beyond Technical Analysis
doge buy midterm"🌟 Welcome to Golden Candle! 🌟
We're a team of 📈 passionate traders 📉 who love sharing our 🔍 technical analysis insights 🔎 with the TradingView community. 🌎
Our goal is to provide 💡 valuable perspectives 💡 on market trends and patterns, but 🚫 please note that our analyses are not intended as buy or sell recommendations. 🚫
Instead, they reflect our own 💭 personal attitudes and thoughts. 💭
Follow along and 📚 learn 📚 from our analyses! 📊💡"

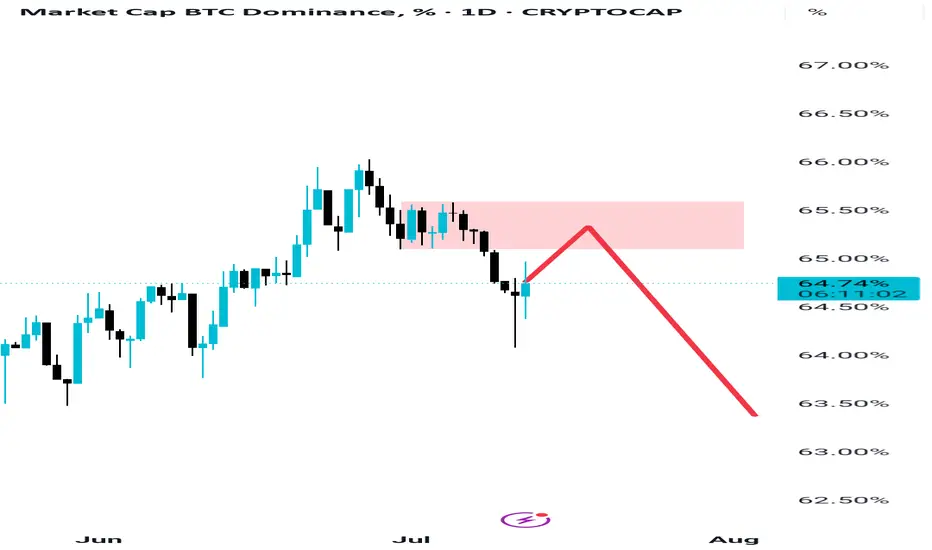
Btc Dominance Just doing retest, HOLD Everyone is selling their altcoins out of fear after minor pumps, but they don’t realize that Bitcoin dominance is only retesting its supply zone. It has already broken its structure, indicating a shift into a downtrend. This retest is not a reversal—yet people are spreading fear among each other as if something major is about to happen. Many will miss what’s coming and regret it later. Don't miss Altseason which is coming in few days not weeks.
Mind It
You Seek Profit, they seek you !who?Every time you think the market’s about to crash, it pumps.
And when you’re sure it’s time to enter, it dumps.
Maybe it’s time to ask a serious question: Who’s really hunting whom?
Hello✌
Spend 3 minutes ⏰ reading this educational material.
🎯 Analytical Insight on Ethereum:
As noted earlier, after several days of sideways action, BINANCE:ETHUSDT has confidently broken above its parallel channel. 🚀 This breakout sets the stage for a potential gain of at least 10%, targeting around 3200. There is also a chance for a retest of the channel’s upper boundary before continuing higher. 🔄
Now, let's dive into the educational section,
🎯 The Modern Market Hunters
Markets today aren’t simple anymore. Behind every candle lies a strategy, an algorithm designed for one thing:
Profiting from your fear and greed.
In crypto, liquidations have turned from a mere term to a deadly tactic. When you enter a position, exchanges know exactly where your stops are. Often, price moves are designed to trigger liquidations of traders like you.
🛠 TradingView’s Tools to Spot the Traps
In a market where hunters are always one step ahead, TradingView’s default tools can be your secret weapon. You just need to know where and what to check:
Volume Profile (Range & Fixed): Shows where real money volume has entered, not just pretty candles.
Liquidity Zones Indicators: Pinpoints exact areas where stops cluster the prime hunting grounds.
Order Block Detection Scripts: Marks zones where whales place heavy orders, always moving against retail trader sentiment.
Set these tools on 1H to 4H timeframes and focus on overlapping areas. This way, you can spot traps before they activate, not after.
🔬 How Are Traps Actually Set?
Markets first build a nice trend, making everyone FOMO in. Then, a sudden shadowy candle crashes the party.
This is called a liquidity sweep or stop hunt.
Signs are clear:
Sudden volume spikes
Positions quickly flipping to profit or loss
Long shadows on candles signaling stop grabs
This is exactly where Open Interest and Liquidity Maps come in handy. They reveal the hunting map before your eyes.
🧠 Your Mind Is The Biggest Liquidity Map
The biggest traps are built inside traders’ minds. When the market moves against you, you panic and set stops.
But that’s exactly the lesson market makers want you to learn: don’t react emotionally.
Instead, a pro trader uses others’ behaviors as cues before market moves.
While you focus on profit, whales focus on your biggest fear: stop loss.
🔄 Your Greed Is Their Data
Every stop you set is a data point for them. You chase profit, they chase your surrender.
Lots of long volume in one zone? Price gets dragged down.
Everyone’s short? Expect a fake pump.
Volume is a footprint, and they track emotional traders like a bloodhound.
🚧 Escape The Trap, Don’t Predict The Market
Pro trader’s formula:
Don’t try to predict track.
When you realize the market isn’t moving naturally but hunting orders, your mindset shifts. You become a tracker, not a soothsayer.
📉 Every Candle Can Be A Killer If You’re Unaware
When a big opposing candle hits your position, ask:
Are we all thinking the same thing?
If yes, you’re likely the next target.
📌 Final Summary
If you only chase profit, you miss the fact the market is hunting you.
The only way out: know they play with your info, not just the charts.
Trading blindfolded is walking into the wolf’s den.
✅ What To Do Next?
Learn to analyze other traders’ moves, not just price action.
Use TradingView tools to see behind the candles.
You’re not here to be hunted you’re here to hunt. So this time, guess where everyone’s stop will be before entering!
✨ Need a little love!
We pour love into every post your support keeps us inspired! 💛 Don’t be shy, we’d love to hear from you on comments. Big thanks , Mad Whale 🐋
📜Please make sure to do your own research before investing, and review the disclaimer provided at the end of each post.

Bitcoin price increaseAfter the tensions between traders in the United States and the strong price fluctuations in the dollar and other stocks, and after the 3-month increase in gold, this time it will be the turn of digital currencies to increase again and there are signs of their increase in the market. For Bitcoin, two increase targets can be considered: $110,000 - $120,000.
Sasha Charkhchian

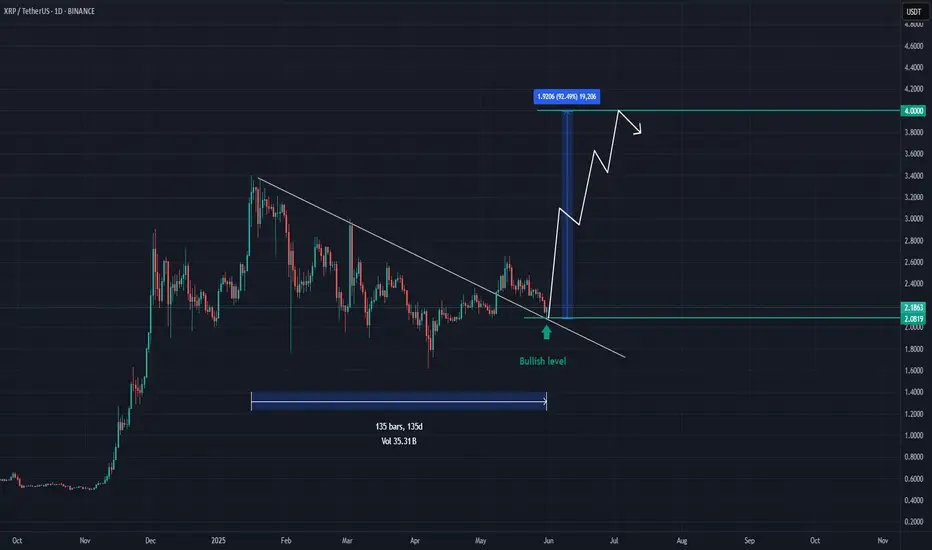
XRP - ContinueRipple's price movement in the main channel and its decline or decrease to the lowest price level has been completed, and we can expect an increase in the price of this currency in the crypto market. Ripple's analysis has recorded a 200% increase so far, which you can see the results of in past analyses.
Sasha Charkhchian

Continued Bitcoin AnalysisAccording to the exact analysis, Bitcoin fell to the specified range and is currently on an upward path. You can follow the rest of the analysis in the main analysis updates.
Sasha Charkhchian

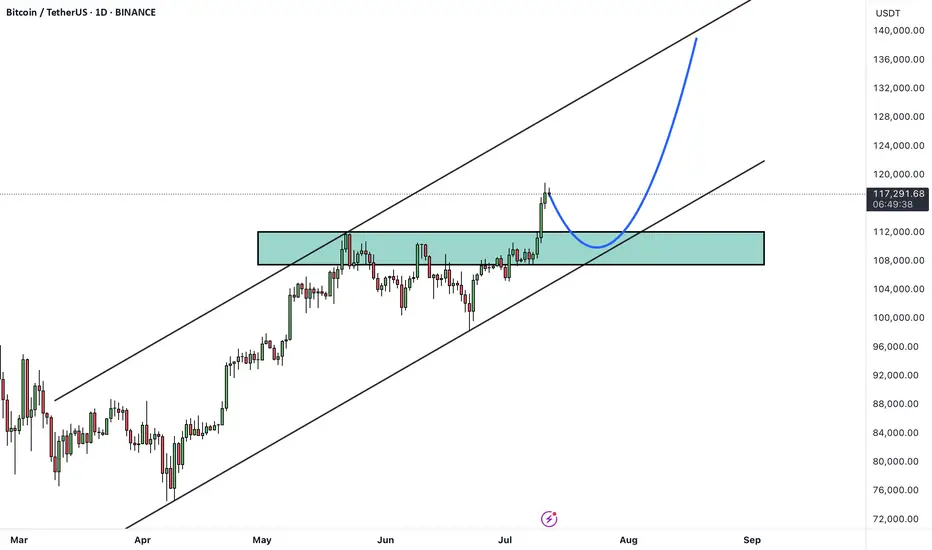
BTCUSDTHello Traders! 👋
What are your thoughts on BITCOIN?
Bitcoin has recently broken above its all-time high and printed a new record high, signaling strong bullish momentum. Currently, the market has entered a consolidation phase, which is typical after such a major breakout.
A pullback toward the previous breakout level (the old all-time high) is expected, which now acts as new support.
After this consolidation and pullback, the price could resume its bullish trajectory and move toward higher targets, including the upper boundary of the current bullish channel.
As long as the price remains above the key support zone, the overall trend remains bullish and any dip could be seen as a buying opportunity within the broader uptrend.
Will this consolidation lead to the next leg up, or is a deeper correction ahead? Share your thoughts below! 🤔👇
Don’t forget to like and share your thoughts in the comments! ❤️
AUD_JPY IS OVERBOUGHT|SHORT|
✅AUD_JPY is trading in a strong
Uptrend but the pair is now
Locally overbought so after the
Pair hits the horizontal resistance
Level of 97.350 we will be expecting
A pullback and a bearish correction
On Monday!
SHORT🔥
✅Like and subscribe to never miss a new idea!✅
Disclosure: I am part of Trade Nation's Influencer program and receive a monthly fee for using their TradingView charts in my analysis.

Will Cardano’s breakout drive a 15% surge to $0.80?Hello✌
let’s dive into a full analysis of the upcoming price potential for Cardano 📈.
BINANCE:ADAUSDT has broken out of its descending channel with strong volume, indicating a potential bullish reversal. Price is currently near a key support level, setting the stage for further upside. A move toward the $0.80 target, offering at least 15% gain, looks likely. 📊🔥
✨ Need a little love!
We pour love into every post your support keeps us inspired! 💛 Don’t be shy, we’d love to hear from you on comments. Big thanks , Mad Whale 🐋

EUR_CAD GROWTH AHEAD|LONG|
✅EUR_CAD went down to retest
A horizontal support of 1.5964
Which makes me locally bullish biased
And I think that a move up
From the level is to be expected
Towards the target above at 1.6040
LONG🚀
✅Like and subscribe to never miss a new idea!✅
Disclosure: I am part of Trade Nation's Influencer program and receive a monthly fee for using their TradingView charts in my analysis.

Euro DollaroThe Euro is close to resistance, represented by the bullish equilibrium orbit in the 1.192 area. A break of the resistance would project prices to the 1.22 area to be realised by 25/08/2025.

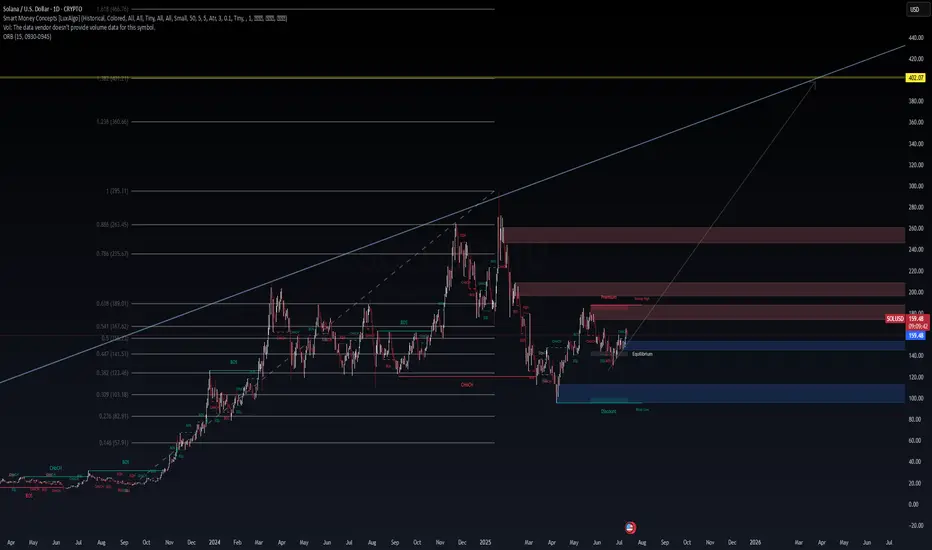
SOL/USD – The War Between Discount & Premium Zones Is Heating Up📈 SOL/USD – The War Between Discount & Premium Zones Is Heating Up
Posted by: WaverVanir_International_LLC
Date: July 12, 2025
Asset: Solana (SOL/USD) | Timeframe: 1D
Strategy Stack: SMC | Fibonacci | Volume Profile | Macro | Catalyst | VolanX DSS Protocol
🔍 Technical Summary
SOL is battling near the 0.5 Fib retracement (~$167), a classic inflection zone. Price is compressing within an equilibrium band bounded by $145–$175. Despite a prior break of structure (BOS) to the downside, recent CHoCH and bullish BOS patterns suggest accumulation may be underway.
Key Zones:
Support (Discount): $123.46 → $103.18 → $82.91
Resistance (Premium): $189 → $235 → $263
High-Conviction Targets:
Bullish Extension: $295 → $360 → $402
Bearish Sweep Zones: $103 → $80 (liquidity pockets)
Structure Readout:
CHoCH (Mar–Apr 2025) suggests reversal potential.
BOS (May–June 2025) confirmed demand stepping in.
Current: Price testing equilibrium mid-zone, low conviction until a clean break of $175 or a flush into $130.
🌐 Macro Context (Q3 2025)
🏦 Federal Reserve Policy
FOMC paused in June, signaling data-dependency.
Market pricing 30–50bps cut by Q4 2025.
Liquidity-sensitive assets like crypto are forward-looking, already attempting to front-run easing.
💰 Global Liquidity Shift
US M2 money supply stabilizing after 2022–2024 contraction.
Global CBs (e.g., ECB, BOJ) showing coordinated signals of easing.
Risk-on flows resurging into high-beta assets → Crypto stands to benefit on the second leg of liquidity wave.
💻 Tech/Crypto Catalysts
Solana Ecosystem rebounding on strong developer metrics, NFT integration, and institutional onboarding (Visa, Shopify integrations).
Tokenization narrative gaining momentum with TradFi firms exploring SOL-based infrastructure.
Regulatory Clarity: US & EU moving toward crypto-safe harbor legislation; positive for altcoin allocation.
⚠️ VolanX DSS Signal Matrix
Module Signal Confidence
Trend Structure Transitional (CHoCH → BOS) Moderate
Fibonacci Levels Compression (0.5–0.618) High
Volume Profile Thin above $175, HVN near $145 High
Macro Liquidity Rising global flows Moderate
Catalyst Tracker Positive (SOL-specific) Moderate
🎯 Execution Framework (2 Scenarios)
🔵 Bullish Bias (Continuation):
Entry Zone: $157–$162 (with SL below $145)
Trigger: Break + close above $175
Targets: $189 → $235 → $263
Invalidation: Daily close below $141.5 BOS zone
🔴 Bearish Bias (Rejection):
Short Zone: $175–$189
Trigger: Rejection w/ CHoCH + imbalance fill
Targets: $145 → $123 → $103
Invalidation: Clean break above $195 with volume
📜 WaverVanir Risk Advisory
This outlook is generated under the WaverVanir DSS (Decision Support System) and is shared strictly for educational and analytical purposes.
We do not manage outside capital, and none of this constitutes investment advice. All systems are probabilistic and adaptive, not deterministic.
🧠 Final Notes:
Solana is at a macro hinge point. Either the liquidity-driven expansion phase begins with force — or we get one more sweep into deeper discount zones before lift-off. With global liquidity expanding and catalysts aligning, the next few weeks will define the rest of 2025’s structure.
💬 Drop your thoughts below.
🔁 Follow @WaverVanir_International_LLC for high-conviction, system-generated macro + SMC trading insights.
🌍
What’s Your Catalyst?
Lately, many QS members have been DM’ing me asking:
“What do you think of this trade idea?”
“Should I go long here?”
“Do you think this setup looks good?”
And my go-to response is always the same:
“What’s your catalyst?”
Because without a catalyst, you’re not trading — you’re guessing.
---
🎮 Trading Is Not a Video Game
New traders often treat the market like it’s a video game.
As long as they “crack the code” of green arrows and red arrows on the chart, they believe they’ll make infinite money.
But that’s not trading.
That’s fantasy.
The harsh truth? Most of these traders haven’t paid their tuition yet.
Some are still in the honeymoon phase.
But the market always gets paid — in blood, time, or money.
---
💀 Real Trading Is Financial Warfare
Trading is not a game.
It’s war.
Behind every price tick, every candle, every fill — is another trader fighting for their financial life.
It’s a sword-to-sword battle. Just because you see it on your phone doesn’t mean it’s not real.
Real trading is life and death for hedge funds, prop firms, and even retail traders trying to survive.
Yet so many jump in, chasing arrows and patterns like they’re spinning a slot machine.
---
🎲 Why You’re Losing with “Green Arrow, Red Arrow”
No offense to TA — it has value. But let’s be honest:
If you’re blindly betting off green and red signals without context, you’re gambling.
You’re just hoping that one of those arrows lines up with a rare, random outlier move — so your one win is big enough to cover all your prior losses.
That’s not strategy.
That’s survival through luck.
---
🔍 What Real Traders Do Differently
To stand out, you need more than pretty charts.
You need information. Insight. Intent.
You need to answer questions like:
Why is this price movement happening?
How far can it go?
What’s driving this move — and what’s the broader context?
You won’t find those answers in price and volume alone.
---
💡 The 4D Framework of Modern Trading
To get an edge, you need to think in 4 dimensions — beyond what most retail traders see:
Market Data – price, volume, trends
Fundamentals – earnings, balance sheets, growth
Macro Forces – rates, inflation, policy, geopolitics
Catalysts – news, events, industry changes
Options Data – implied vol, skew, positioning
This 4D perspective is how modern trading works — and it’s exactly what AI is built to do better than any one trader.
You’re not going to out-research Goldman Sachs.
You’re not going to manually read every 10-K, earnings call, tweet, and Fed update.
But AI can.
---
🤖 AI Isn’t Perfect — But It’s Better Than Gambling
Is AI trading the ultimate answer?
No.
But it’s the closest thing we have to a scalable edge — because it combines massive information processing with human-level reasoning.
The choice is yours:
Stick with “green arrow, red arrow” and hope for Vegas-style luck
Or embrace AI tools that give you a fighting chance through context and analysis
I’ve made my choice.
And every day, my tools — and my edge — get better.
---
🧠 So Next Time You Trade, Ask Yourself
What’s your catalyst?
If you don’t have one, you don’t have a trade.
You have a lottery ticket.

How Much Risk Are You Really Taking?
I get two common horror stories from new QS members:
“I followed a few QS signals, nailed some wins… then bled it all back.”
“My first couple signals lost, and my account was toast.”
My first question to both groups is always the same:
“How much risk did you assign to that trade?”
❌ Why Most Traders Dodge This Question
Risk management isn’t sexy.
Green arrows and slam‑dunk gains are fun to talk about. Stop‑losses and position sizing? Not so much.
Gambling feels easier than math.
Going “all‑in” gives you the casino rush. Calculating max drawdown does not.
Accountability hurts.
If the trade blows up, there’s no one to blame except the person who sized it.
⚔️ Trading = War (No, It’s Not “Fun”)
Like I said in “What’s Your Catalyst?” — trading is financial warfare.
Show up without armor (risk rules) and you’re the first casualty.
In basketball you need defense before dunks.
In war you need body armor before bullets.
In trading you need risk management before any strategy.
📏 My Simple Rule
Only risk what you’re prepared to watch burn—completely.
If the idea of that money turning to ash makes you queasy, you’re oversized. Period.
🧠 Questions to Ask Before Every Trade
Position size: How many dollars exactly can I lose and still fight tomorrow?
Probability: Is this setup strong enough to justify that risk?
Stop‑loss: Where is my hard exit? No “I’ll see how it feels.”
Reward‑to‑risk: Is the upside worth at least 2–3× the downside?
Confidence check: If I’m not 100 % cool watching this cash burn, why am I risking it?
🚀 Pair Your Edge with Protection
AI and QS signals give you edge — a slightly better chance in a brutal game.
But edge without risk control is like a sniper without body armor: lethal until one bullet hits.
Next time you celebrate a hot streak or curse a quick wipe‑out, pause and ask:
“How much risk did I really assign to this trade, and was it worth it?”
If you can answer honestly and still sleep at night, proceed.
If not, size down, armor up, and protect your capital first.
Strong defense wins championships — and trading accounts. 🛡️💰

The Myth of Win RateOne of the most common questions I get from QS members:
“What’s the win rate of the signal?”
Sounds like a smart question. But it's often coming from the wrong mindset — the same mindset as a student cramming for a test, hoping for one perfect answer key that’ll give them a 90% score and an easy win.
Let me break this down for you:
🧮 The Only Two Numbers That Matter in Trading
There are only two math truths that actually grow your account:
Win Rate – how often you’re right
Win/Loss Ratio – how much you make when right vs. how much you lose when wrong
Everyone obsesses over #1.
Almost no one truly understands or applies #2 — and that’s the real killer.
---
🤔 So What’s the Ideal Setup?
In a perfect world, you’d have:
A high win rate (80–90%)
AND a high win/loss ratio (make $3, lose $1)
But guess what?
This isn’t a perfect world — this is a war.
See my earlier post: "What’s your catalyst?"
---
⚔️ Trading Is Like War (or Sports)
In war, victory is rare and costly.
In sports, scoring takes hard work, timing, and discipline.
In trading:
You win big when the odds are stacked in your favor
You cut losses quickly when you’re on the wrong side
That's the gold standard — but few do it.
Even worse, many do the exact opposite:
Take quick profits to “lock in a win”
Let losers run hoping for a miracle
Then they wonder why their account bleeds over time.
---
🎰 Vegas Was Built on 51% Win Rate
Casinos don’t need to win every game. They just need:
Slightly better than 50% edge
Strict control over risk and payout
That 1–2% edge? It built every billion-dollar casino on the Strip.
Now think again:
Why are you chasing a 90% win rate when even 55% + smart risk control can make you rich?
---
🧠 Profitability > Win Rate
You don’t need to win all the time.
You need to win big enough and lose small enough.
Your goal should be:
3 steps forward, 1 step back.
That’s the realistic rhythm of trading success.
---
✅ So Next Time You Ask About a Signal...
Don’t just ask:
“What’s the win rate?”
Instead ask:
“What’s the reward if I’m right?”
“What’s the damage if I’m wrong?”
“How do I size this trade so my wins outgrow my losses over time?”
This is how real traders think.
Not about perfection — but about probability, edge, and sustainability.
---
💬 TL;DR
Win rate is just one piece.
Your win/loss ratio and risk management matter more.
Profitability > accuracy.
The market doesn’t reward perfection. It rewards preparation, defense, and discipline.
Keep playing smart, not perfect.
And remember — it’s a long game. 🧠📈
How I Manage Risk (When Buying Options) If you’ve read my previous post — “How Much Risk Are You Really Taking?” — you already know my view on risk:
Treat every trade like watching your cash burn in front of you.
Ask yourself:
💭 “Would I be OK watching this much money disappear right now?”
If your answer is yes, take the trade and move on.
If it’s no, don’t do it — resize it.
🚫 What Not to Do:
Many traders fall into the trap of:
“I’ll think about it later”
“I’ll set a mental stop and cut if it hits my level…”
That approach has two fatal flaws:
#### ❗ 1. Execution failure
You might not react fast enough when the market hits your level — or worse, you’ll forget to act at all.
#### ❗ 2. Emotional resistance
Even if your stop level is hit, will you actually cut?
Probably not.
Human nature avoids pain and chases pleasure.
Cutting a loss — even a planned one — is painful. That’s why mental stops often fail.
Mental stops:
Add more burden to monitor
Add more emotion to your decision-making
That’s why I keep it simple.
---
✅ My Risk Rule for Buying Options:
Every dollar of premium I spend is 100% acceptable to lose.
This way:
I don’t need a mental stop.
I don’t need to watch it every second.
I sleep well, regardless of outcome.
---
📊 How Much Do I Risk?
It depends on account size and account type:
#### 📌 Main Account:
Risk 1–2% per trade
Never more than 5% on a single trade
Rarely hold more than 3 trades at once
Targeting 6–10% total exposure, only if trades are uncorrelated
⚠️ SPY & QQQ are NOT uncorrelated — don’t fool yourself.
#### 📌 Small Account:
Can risk 5–10% per trade, but only on A+ setups(See: “What’s Your Catalyst?” for what qualifies as A+ in my book)
The goal of a small account is different: it’s about growth — but still must be strategic.
---
💰 “But How Can I Make Big Money Risking So Little?”
This is the common pushback I get:
“Shouldn’t we take big risks to get big rewards?”
Sure — high risk = high reward.
But high risk also = high chance of blowing up.
Even if you hit a few big winners, you’ve compromised your long-term survival.
That’s not trading. That’s gambling.
---
🧠 What I Actually Look For:
Low Risk / High Reward.
Yes, they’re rare.
Yes, they’re like lotto tickets.
But you don’t need to win often if you only risk a little and win big when it counts.
What’s not rare is:
Traders risking big on uncertain setups
Going all in on gut feelings
Wiping out in one or two bad trades
That’s not strategy — that’s self-destruction.
---
🧾 The 2 Core Rules of Risk:
Protect capital at all costs
Only take trades where potential reward outsizes the risk
Don’t flip the logic.
Too many traders hear “high risk = high reward” and assume high risk is required.
It’s not.
That mindset is built for Vegas, not for Wall Street.
---
🧠 If You Want to Be a Trader — Not a Gambler:
You must believe in:
Small risk, big reward
Patience
Discipline
Letting time and luck compound your edge
No other way.
🎯 If you truly get this… congrats.
You’ve crossed the line from gambling to trading.

How to Do Your “Trading Homework” (The Smart Way)
If you’ve been following this channel, you’ve heard me say it many times:
Trading is war — and you should never enter a battle unprepared.
But here’s the real question:
How exactly do you prepare?
The answer lies in a powerful strategy I use called:
💡 Thematic Investing
Read more here →
Instead of chasing news or signals in isolation, thematic investing means:
You first understand where the world is heading
Then you position yourself ahead of that move
It’s not about reacting. It’s about anticipating.
---
❌ What Most Traders Do Wrong
Most beginners:
Follow one tweet
See one red or green arrow
Watch one chart pattern
Then they jump in blindly.
That’s not trading — that’s guessing.
News headlines and chart moves reflect what already happened.
But your edge comes from understanding what’s likely to happen next.
---
✅ What I Do Instead (with QS AI)
Back in the day, doing thematic analysis manually could take hours of reading across dozens of news sites, earnings calls, and macro reports.
But now?
QS AI does the heavy lifting for you — in seconds.
Here’s how I do my “trading homework” every week using QS signals:
---
🧠 Step 1: Start with the News Theme
Go to 📰news-signal — let the AI scan hundreds of headlines and summarize the key themes shaping the week.
Ask yourself:
What’s the main event or policy shift?
Which sectors are directly impacted?
Who are the winners and losers?
---
🔎 Step 2: Zoom Into Sectors or Stocks
Once you spot a theme, use other QS signals to dig deeper:
⏰0dte for fast-moving trades (same-day catalysts)
📅weekly-options for 1–5 day plays
💸earning-signal for earnings-related positioning
🔄swing-signal for broader trend/position trades
---
📈 Real Examples of Thematic Trades
Let me walk you through a few past trades — all built off this exact process:
✅ BBB Defense Play
Theme: Bill passed removing EV credits, boosting defense
Strategy: Long PLTR / Short EV sector using 📅weekly-options
✅ Robinhood Crypto Tokenization
Theme: Robinhood’s crypto product event
Strategy: Crypto stocks pump → took profits early
✅ Tesla Robotaxi Week
Theme: TSLA reveals AI & robotaxi push
Strategy: Long TSLA / Short UBER
✅ Earnings Play: MSFT vs AAPL
Theme: MSFT cloud beat, AAPL revenue drop
Strategy: Long MSFT / Short AAPL using 💸earning-signal
All these trades started with thematic awareness → followed by precise signal-based execution.
---
⚙️ Your Homework Checklist (The QS Way)
Before every week or trade, ask:
📰 What is the major theme driving markets this week?
🧠 What sectors or companies are most impacted by this theme?
🔀 Can I find a relative strength/weakness pair to trade?
⏳ What’s the best time frame? (0DTE, weekly, swing?)
📊 What do QS signals say about timing, momentum, and volatility?
---
🤖 Why QS AI Gives You the Edge
Doing this manually would take you 5–10 hours a week.
But with QS AI:
You scan the entire news cycle in 10 seconds
Get real-time themes and reactions
Pair it with high-quality trade setups
Prepare your game plan before the market opens
This is how we prepare smarter, not harder.
No more chasing arrows.
No more gambling.
Just clean, thematic, risk-aware, high-conviction trades.
---
🏁 Final Thought
There are no guarantees in trading.
But there is a smarter way to prepare.
Thematic investing + QS AI gives you the best shape to step into the market and fight with confidence.
Follow where the world is going — one theme at a time.
That’s how we trade with QS. That’s how we print. 🧠💥💰

Select Your Trading Time
There’s an old saying:
“Plan your trade, and trade your plan.”
But I want to add something even more important:
“Pick your time to trade.”
---
💰 The Market Is Not Your ATM
Everyone enters trading with one goal: make money.
Some even think of the market as an ATM — pull the handle, cash comes out.
But the truth is:
❌ The market doesn’t care about your goals
❌ It won’t move just because you need to make money today
This is a brutal game. And you don’t control the clock.
---
⚠️ When You Force a Trade...
Too many traders say:
“I have to make money today.”
“I need to hit $X this week.”
“I just took a loss, I must come back now.”
That kind of thinking leads to:
Bad entries
Overtrading
Emotional decisions
Big losses
❗ Trading success doesn’t come from forcing outcomes — it comes from waiting for the right moments.
---
🧠 What Happens on Low-Volatility Days
Let’s take today as an example.
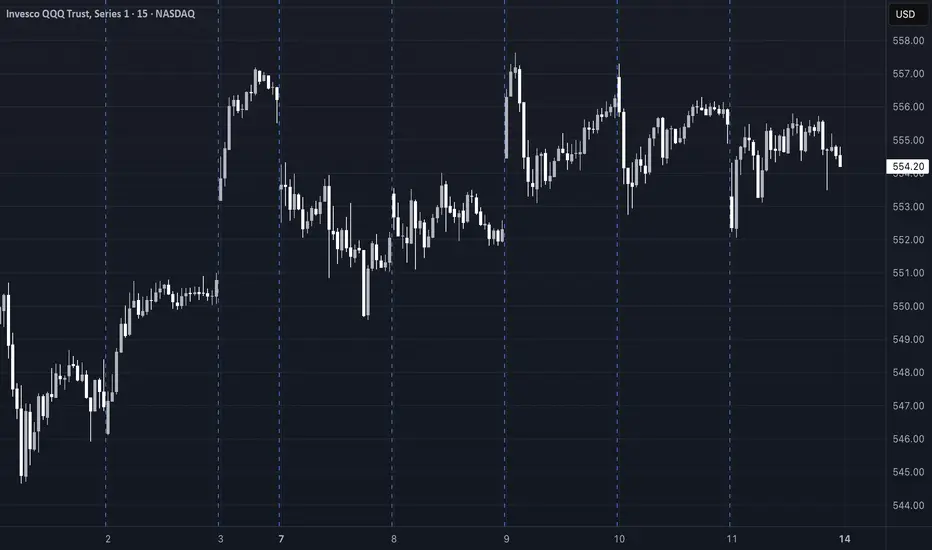
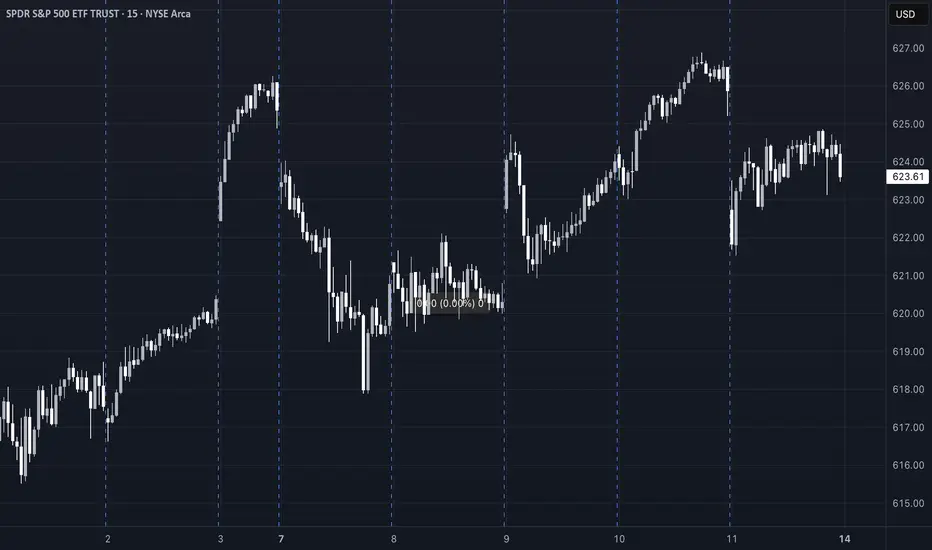
SPY moved in a 2-point range all day.
No momentum, no trend, just chop.
Some traders:
Ran one QS signal after another
Forced trades just to feel busy
Got chopped up by fast reversals
Then blamed the signals
But here’s the truth:
AI or not , you can’t expect any long-volatility trade to work when the market is dead still.
The only winners on days like today? Market makers and options sellers.
---
❓ Why Trade at All on a Day Like This?
If the market isn’t offering opportunity,
Why force it? Why chase trades? Why burn your energy?
The smarter move is:
Sit out
Observe
Wait for better setups
Preserve your mental and financial capital
---
🔄 Recovery? Yes — But on Your Terms
Some traders lose money and say:
“I need to make it back today.”
That’s emotional revenge trading.
What if the market doesn’t give you a clean opportunity today?
Are you still going to go all-in, out of frustration?
❌ That’s not a strategy. That’s gambling.
---
📍 QS Signals Are a Map — Not a Magic Button
QS AI signals help you find opportunities — but even the best map won’t help if:
You're in the wrong city (bad market environment)
You’re rushing without checking road conditions (volatility, news, timing)
Even with QS, you don’t have to trade every day, every hour.
---
✅ What You Should Do
Be patient
Respect market conditions
Take a break on slow or tricky days
Come back when the odds are in your favor
---
🧘♂️ Final Words
You don’t have to win every day.
You don’t have to trade every day.
You don’t even have to be active to be successful.
🎯 Trade less. Trade smarter. Select your time wisely.
That’s how real traders survive and thrive in this game.
How We’ll Trade Earnings This Season Earnings season is almost here — and if you're with QS, you’re already holding the most powerful edge in the market.
Let me walk you through how QS trades earnings, why we built 💸earning-signal, and how you can use it most effectively this quarter.
---
📜 A Little History: The Birth of 💸earning-signal
When QS launched in early April, we started with just two short-term signals:
⏰0dte
📅weekly-options
Both focused on short-term options trades.
Then came TSLA earnings in late April. That’s when we launched our very first 💸earning-signal — and nailed the prediction.
Since then?
We’ve had one of the best earnings win streaks on the internet. Period.
📌 Don’t take my word for it — check:
#✅signal-recap for the track record
#🤑profits and #🤩member-testimonials for real wins from members
---
🤖 Why We Built a Separate Earnings Signal
Earnings are not regular trading days. The dynamics are completely different.
On normal days, a stock might move <1%
On earnings? 10–20% swings are common
This is what we call a “pivot event” — and it requires a different engine to predict.
That’s why we separated:
📅 #weekly-options → normal day-to-day setups
💸 #earning-signal → high-volatility earnings plays
---
🧠 How a Human Would Trade Earnings...
If you wanted to manually trade an earnings report, you’d need to analyze:
Past earnings reactions
Analyst expectations
Earnings call language
Financial statement surprises
Options IV & skew
Post-earnings stock behavior
This would take hours (or days) — and most retail traders don’t have time.
---
⚙️ How QS AI Does It Instead
We built 💸earning-signal to do all that work for you — and more.
✅ It pulls in all the data above
✅ Runs it through 5 top LLM models (each acts as an independent analyst)
✅ Aggregates their insights + calculates probability-weighted direction & strategy
✅ Uses fine-tuning to learn from its past prediction success/failures
This means: faster decisions, deeper insights, and better accuracy — every week.
We don’t just run predictions. We let the AI learn from past mistakes and self-improve each quarter.
---
💥 Results Speak for Themselves
Last season, we nailed:
TSLA
MSFT (10x–20x winners!)
NVDA
AAPL
And many more...
All based on this unique AI-driven earnings analysis stack.
This season?
We’re going harder, faster, and even smarter. 📈
🎯 The goal is clear:
Make 💸earning-signal the #1 earnings prediction system in the world.
---
🧩 Final Notes
Earnings are 10x harder to trade than regular days
But with QS, you’re equipped with 500x the speed and insight of an average trader
Upgrade if you haven’t yet: #💰upgrade-instructions
Earnings season kicks off next week
Let’s get it.
Let’s win big.
Let’s make season 2 of 💸earning-signal our most legendary yet. 🚀💸

SPX GEO+ Cycle Update: "SPX: April Low Called, Target 8000+"SPX GEO+ Cycle Update: April Low Called Precisely (Next Target: 8000)
On January 5th, 2025, when SPX was trading at 5942, I published an analysis in Italian using my GEO+ Cycle methodology that made two specific projections:
📉 A low around 5000 in April 2025
📈 Then an advance targeting 8000 by 2026
Update: April delivered exactly as projected.
The geometric patterns suggested April would mark a significant turning point, and the market found strong support right in the anticipated zone and timeframe.
About GEO+ Cycles:
After 15 years studying market geometry, I've developed a framework that identifies multi-decade structural patterns. These aren't traditional technical indicators—they're mathematical relationships that help project major turning points with remarkable precision.
Current Phase:
We're now in the advancing phase of this cycle. Based on geometric projections, the target window for 8000 remains January 2026.
Important Context:
This represents cycle analysis for educational purposes, not trading advice. The methodology focuses on identifying major structural turning points rather than short-term movements.
What's Next:
I'll continue tracking this cycle's development and provide updates as we approach key geometric levels.
For those interested in learning more about geometric market analysis, feel free to follow for updates on this and other cycle progressions.
The mathematics of market geometry continue to unfold...
Note: Originally published in Italian, now sharing these insights with the global TradingView community.

Macroeconomic analysis of the American marketHello investor friends,
today I bring an update on the macro economic state of the American economy which generally moves markets around the world.
From the graph we can see the S&P 500 index on which 4 lines have been superimposed which coincide with:
- FED interest rate
- FED balance sheet
- US inflation rate
- US unemployment rate
The vertical line on the graph coincides with the date of the last update I made 5 months ago.
The central bank decides interest rates and the injection of money with the aim of keeping inflation low and avoiding too much unemployment.
At the moment we have:
- Unemployment rate at 4% (remained unchanged)
- Inflation at 2.4% (decreased compared to 5 months ago)
- The balance / release of printed money (continues to fall)
- The interest rate remained unchanged (current 4.33%)
Compared to 5 months ago the situation seems to have improved and is quite stable. The FED has decided to keep rates unchanged due to political issues as it would like to see clearly before making cuts.
In general we can say that the situation seems quite good as, unemployment is low, inflation is at optimal levels, we see that the budget/money injection is decreasing and therefore leads to maintaining regular inflation and finally the interest rates being stable maintain a low level of unemployment.
Given these factors we see that since the last update 5 months ago (i.e. in February), in the following weeks there was a collapse due to Trump's policies but that it was certainly an excellent opportunity to increase positions given that the macroeconomic situation was positive as it currently is.
From today we could certainly expect further declines due to other monetary policies or other news, but as long as the macro situation is positive we have no reason to worry.
👍 Like if you want more macro updates in the future
🙋♂️ Follow me so you don't miss my future analyses
⚠️ Disclaimer: This post is for informational purposes only and does not constitute financial advice. Always do your research before making investment decisions.
SP:SPX FRED:SP500 VANTAGE:SP500 AMEX:SPY VANTAGE:DJ30 AMEX:DIA CME_MINI:NQ1! FX:NAS100 NASDAQ:QQQ FX:EUSTX50 FOREXCOM:GER40 FX:AUS200

XRP - This is one of many great opportunitiesXRP is reaching a solid level of $2.1.
I believe this level will attract investors for the following reasons :
Technicals :
After breaking the main resistance trendline, XRP is now reaching a solid support level presented in green.
Price action :
- In accumulating since Jan '25
- Resisted to last market dumps
Beyond technicals :
- Very strong community
- Real services and strong team
Market sentiment :
The investors are now looking for a strong asset to invest in. They may switch their alts to any coin that shows strenght. For now, XRP is on the top list.
Recap :
- Risks : bad news from the team , whales dumping , ...
- Main Target : $4
- Reward : near 100%
BITSTAMP:XRPUSD COINBASE:XRPUSD BYBIT:XRPUSDT.P CRYPTOCAP:XRP KUCOIN:XRPUSDT