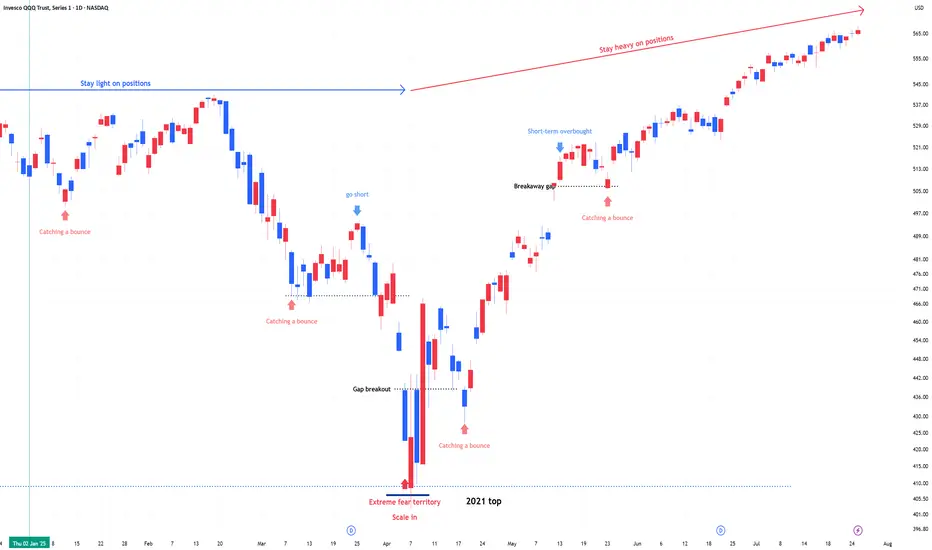
QQQ : Stay Heavy on Positions QQQ, QLD, TQQQ : Stay Heavy on Positions
Amid record-high markets, fear-hedging sentiment is slowly transitioning into renewed risk-taking.
When entering an underweight zone, I rotate out of QLD or TQQQ into QQQ and reduce overall exposure.
Beyond Technical Analysis
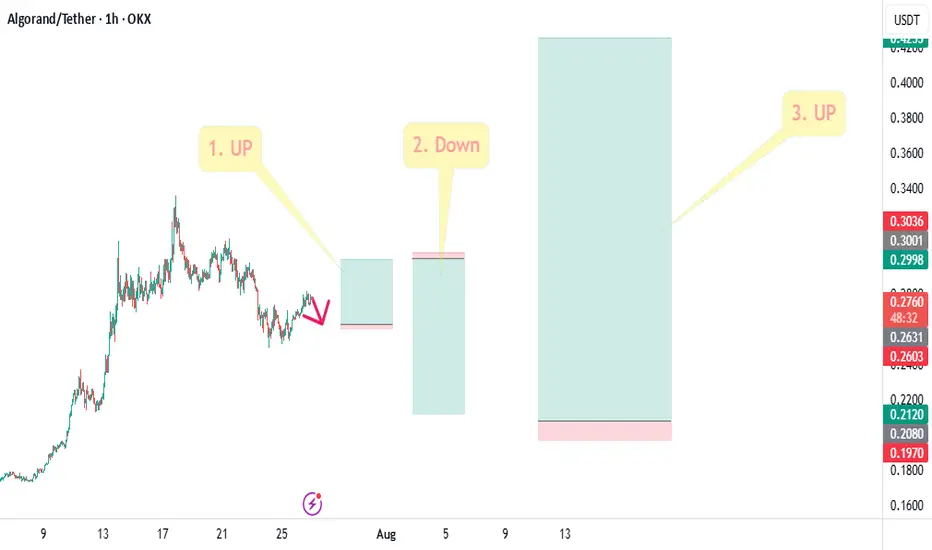
#ALGO Moves of 3 trades in a single chart.#ALGO Moves of 3 trades in a single chart.
In this, the first trade represents a long position on a short-term time frame. Then, a short position can be opened for the retracement. After that, the final third move could be an upside move of more than 100%.
Join Us For All Updates.
@Namaste@
Gold price continues to decrease, keep the rate unchanged✍️ NOVA hello everyone, Let's comment on gold price next week from 07/28/2025 - 08/1/2025
⭐️GOLDEN INFORMATION:
Gold (XAU/USD) looks set to close the week lower, pressured by upbeat U.S. economic data and progress in trade negotiations, which have reduced demand for safe-haven assets. Despite declining U.S. Treasury yields, the U.S. Dollar regained some ground. At the time of writing, XAU/USD is trading around $3,336, down nearly 1%.
Looking ahead, the Federal Reserve is widely expected to keep interest rates steady at 4.25%–4.50% for the fifth time this year. Recent data supports this stance, with Initial Jobless Claims falling for the fourth straight week—signaling a resilient labor market—while Friday’s sharp drop in Durable Goods Orders, driven by weaker aircraft demand, adds a mixed tone to the outlook.
⭐️Personal comments NOVA:
Gold prices continue to fall as interest rates remain unchanged almost this week. Along with the H4 time frame, prices continue to break important support and continue to follow a downward trend.
🔥 Technically:
Based on the resistance and support areas of the gold price according to the H4 frame, NOVA identifies the important key areas as follows:
Resistance: $3350, $3428
Support: $3312, $3280, $3246
🔥 NOTE:
Note: Nova wishes traders to manage their capital well
- take the number of lots that match your capital
- Takeprofit equal to 4-6% of capital account
- Stoplose equal to 2-3% of capital account
- The winner is the one who sticks with the market the longest

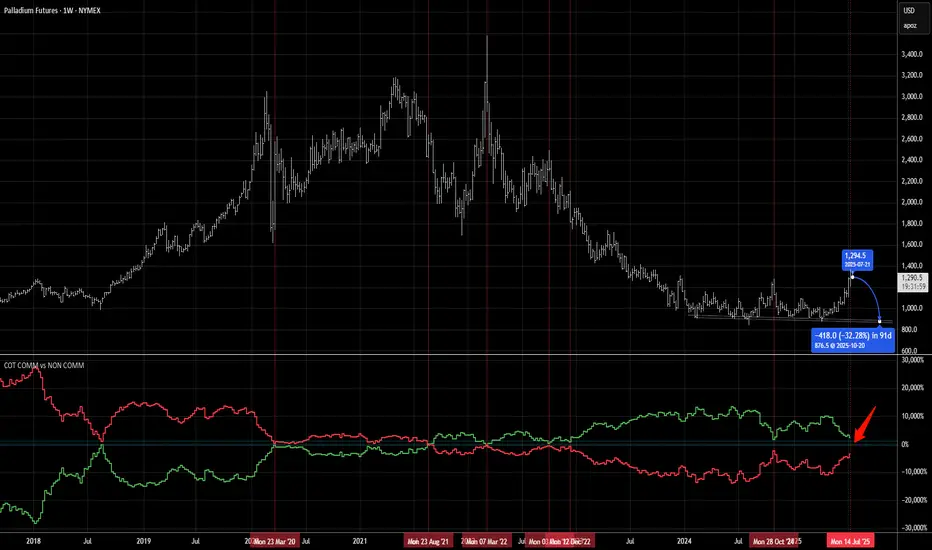
Palladium Crash Incoming; 30%+ Drop ExpectedPalladium is indeed a very small market and hence exhibits very unique and highly predictable COT patterns. When the producers begin to heavily sell after large price rallies, XPD is destined for a fall back down into its intermediate term supply/demand zone. Which in this case represents the $850-$900 range. So a nice 30%+ down swing over the course of several months can be predicted based on previous builds in the NYMEX COT report.
There is absolutely ZERO material reason for the PGMs to have staged such a large rally these last few months other then as a liquidity fueled move coupled with massive price divergence with gold. The PGM market could not have worse demand fundamentals, especially for Palladium which is mostly used for automotive use as catalytic converters in gasoline powered vehicles (ICE). With the largest customer of the metal being China who is in a secular economic slowdown, then the US/EU where vehicle prices have exploded. The market is well supplied especially as EVs take over in dominance across Asia and emerging more in western markets which require no such catalytic functions.
Market Call: We are scaling into short positions on XPD anticipating a market convergence back to its normally supplied price level of $875/oz.
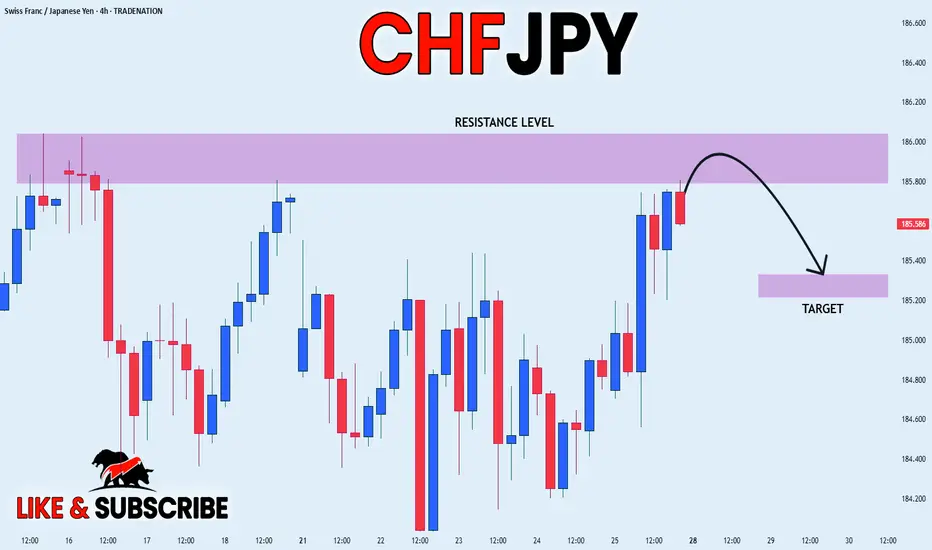
CHF_JPY RISKY SHORT|
✅CHF_JPY is going up now
But a strong resistance level is ahead at 186.036
Thus I am expecting a pullback
And a move down towards the target of 185.329
SHORT🔥
✅Like and subscribe to never miss a new idea!✅
Disclosure: I am part of Trade Nation's Influencer program and receive a monthly fee for using their TradingView charts in my analysis.
SILVER SUPPORT AHEAD|LONG|
✅SILVER has been falling recently
And Silver seems locally oversold
So as the pair is approaching
A horizontal support of 37.80$
Price growth is to be expected
LONG🚀
✅Like and subscribe to never miss a new idea!✅
Disclosure: I am part of Trade Nation's Influencer program and receive a monthly fee for using their TradingView charts in my analysis.

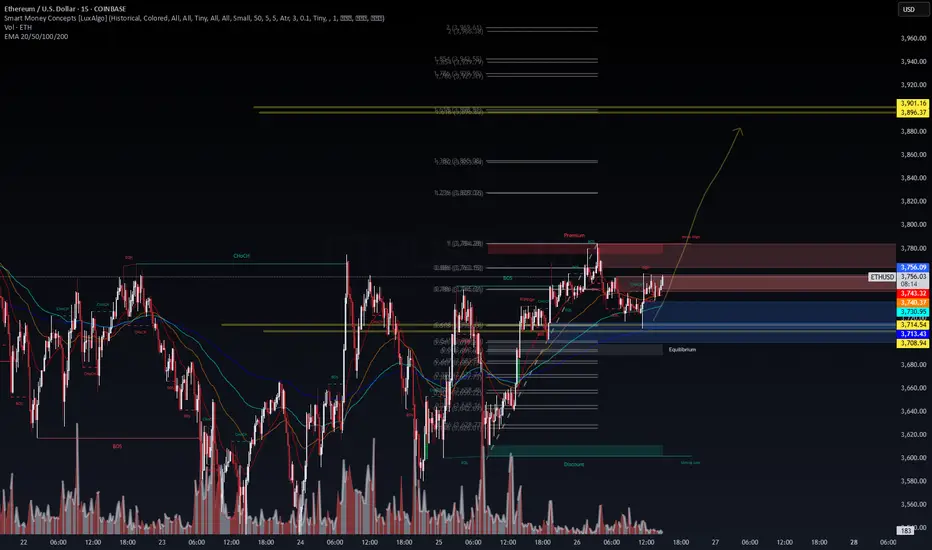
ETH/USD – Macro Wave Map to $10,000? ETH/USD – Macro Wave Map to $10,000? 🚀🔥
Ethereum has broken out of its prolonged corrective structure, moving decisively above the equilibrium zone (~$3,500) and signaling the start of a potential macro impulsive wave (Elliott Wave 3 of 5).
Key Observations (Weekly Chart)
Wave Structure: The corrective (W)-(X)-(Y)-(Z) phase is complete, with ETH now forming the early stages of a wave (3) targeting $8,500–$9,000.
Equilibrium Flip: Price reclaimed the premium zone (~$3,500), indicating smart money accumulation.
Macro Target: If wave (3) plays out fully, wave (5) could extend toward $10,000+ by 2026.
Volume Spike: Sustained institutional demand confirms the bullish pivot.
Levels to Watch
Support (Re-entry Zone): $3,200 – $3,500 (previous resistance, now strong support) 🛡️
Primary Targets: $5,000 – $6,800 (wave 3 mid-range) 🎯
Extended Targets: $8,500 – $10,000 (wave 5 completion) 🏆
VolanX Macro Signal
Bias: Bullish as long as ETH stays above $3,200.
Risk Marker: A drop below $2,900 (200-week EMA) would invalidate this impulsive scenario.
Accumulation Strategy: DCA between $3,200 – $3,600 targeting $5,000+ in 2026.
VolanX View:
Ethereum’s current structure is primed for a multi-year expansion cycle, with smart money targeting untouched liquidity above $5K and potentially $10K. The roadmap remains bullish as long as we hold the reclaimed base zones.

CAD_JPY WILL GO UP|LONG|
✅CAD_JPY will soon retest a key support level of 107.500
So I think that the pair will make a rebound
And go up to retest the supply level above at 108.100
LONG🚀
✅Like and subscribe to never miss a new idea!✅
Disclosure: I am part of Trade Nation's Influencer program and receive a monthly fee for using their TradingView charts in my analysis.

#QS - 4HR [Will the last boost last or will it bust? With a new Volkswagen investment and partnership. Quantum Scape’s earnings were far from stellar with a 26% decrease in income compared to same time last year. They have, nevertheless, made advancements with their very promising lithium-Metal battery technology.
With fundamentals aside, I am curious to gauge how long-term investors have priced-in the company's stock price.
Technically, I see price moving to present yet another opportunity by EOY if not sooner. My count shows important levels to watch.
Go #QuantumScape, Go!!!
Check out my other chart ideas @CaxhPrince everywhere.

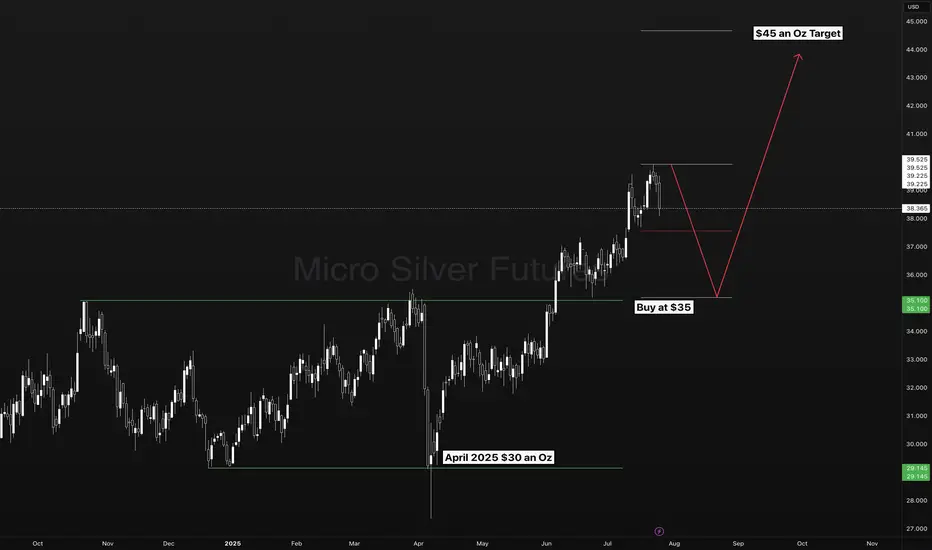
Silver - The Long Term SetupSilver on the longer term may be setting up for a trend continuation opportunity from $35 to $45 dollars an Oz.
Do you Trade FOREXCOM:XAGUSD ?
Do you Trade FOREXCOM:XAUUSD ?
HAPPY BIRTHDAY Ethereum! Now let's go Looks like the move is about to happen right now. Target 10K !
EURNZD ShortAfter a recent Market Structure Shift (MSS) signaling a bearish direction, I'm looking to short at 1.95692. The supply zone aligns perfectly with the 61.8% retracement level, and there's a potential liquidity/inducement level forming, adding confluence to the trade.

ETH to $3700 Before a Major Bounce?Ethereum has been showing signs of exhaustion after its recent rally. I'm watching the $3700 level closely — it's a key support zone that has acted as both resistance and support in the past.
🟦 If ETH pulls back to this area, I expect it to find strong buying interest, potentially leading to a significant bounce and continuation of the bullish trend.
📌 Scenario I'm Watching:
🔻 Pullback to the $3700 support zone
📉 Shakeout or stop hunt below previous lows
💚 Followed by a strong bullish reversal — possible move toward $4000+
Why $3700?
Confluence of previous highs/lows
Psychological round number
Potential liquidity pocket
Not Financial Advice!
This is a scenario I'm tracking, not a guarantee. As always, wait for confirmation (e.g. bullish engulfing, RSI divergence, volume spike) before jumping in.
📉 If $3700 fails decisively, I'll reassess — next support likely around $3550–3600.

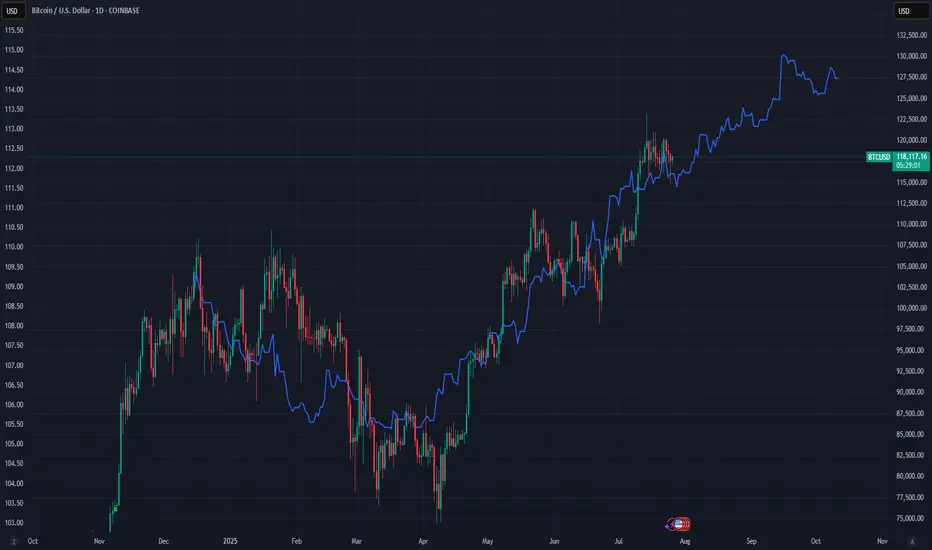
Bitcoin vs Global M2: Can Liquidity Predict the future?This chart compares Bitcoin’s price (daily) with a Global M2 indicator that includes the monetary supply of major economies like the U.S., Eurozone, China, and Japan.
It’s not a perfect global measure — but it gives us a reliable macro signal of what global liquidity is doing.
And when it comes to Bitcoin, liquidity is everything.
Why this matters:
Bitcoin is often seen as volatile or unpredictable. But when we zoom out and overlay it with liquidity flows (like M2), a powerful pattern emerges:
Bitcoin tends to follow global M2 with a ~10-week lag.
When M2 rises, Bitcoin often rallies weeks later. When M2 contracts, Bitcoin loses momentum.
This makes M2 a powerful leading indicator — not for predicting exact price levels, but for catching the direction of trend and regime shifts.
What this chart tells us:
M2 leads, Bitcoin follows.
The curves won’t align perfectly — but the macro structure is there.
Big expansions in M2 create a friendlier environment for risk assets like BTC.
This is the same logic used by macro strategists like Raoul Pal: liquidity drives everything.
Important disclaimer:
This doesn’t mean M2 tells you where price will be on a specific date. But it can help identify turning points — and confirm whether we’re in a reflationary vs contractionary environment.
Think of it as a weather forecast, not a GPS pin.
In other words:
This chart doesn't show the price. It shows the future.
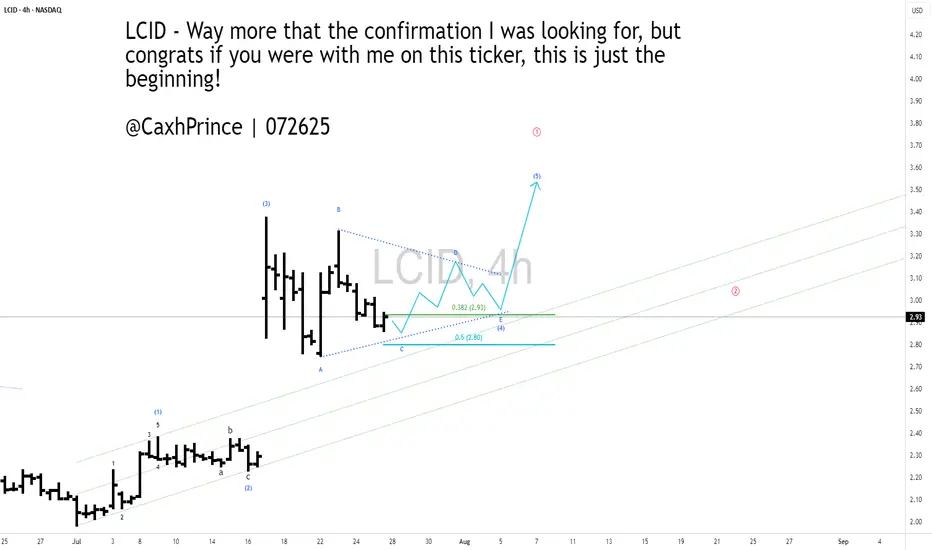
#LCID - 4HR [ A potential bullish view]Lucid blasted off last week with the collaboration of Uber and Robo-taxis. I think that blast infused more investors to the stock and I think it may never come back to take out its lows. If it does, I would load up more on it. I like their designs and the fact that they are now compatible with TESLA's Super Chargers make them even more attractive.
In my count here, I am sensing the current correction could form a triangular pattern for another high before one last correction for ABC down.
Go LCID, Go!!!
Check out my other chart ideas @CaxhPrince everywhere.

A 4HR Bullish view on #Lucid Motors ($LCID)Lucid blasted off last week with the collaboration of Uber and Robo-taxis. I think that blast infused more investors to the stock and I think it may never come back to take out its lows. If it does, I would load up more on it. I like their designs and the fact that they are now compatible with TESLA's Super Chargers make them even more attractive.
In my count here, I am sensing the current correction could form a triangular pattern for another high before one last correction for ABC down.
Go LCID, Go!!!
Check out my other chart ideas @CaxhPrince everywhere.
EUR_JPY WILL GROW|LONG|
✅EUR_JPY will keep growing
Because the pair is in the uptrend
And recently broke the key level of 173.200
So we will be expecting
Bullish continuation
LONG🚀
✅Like and subscribe to never miss a new idea!✅
Disclosure: I am part of Trade Nation's Influencer program and receive a monthly fee for using their TradingView charts in my analysis.

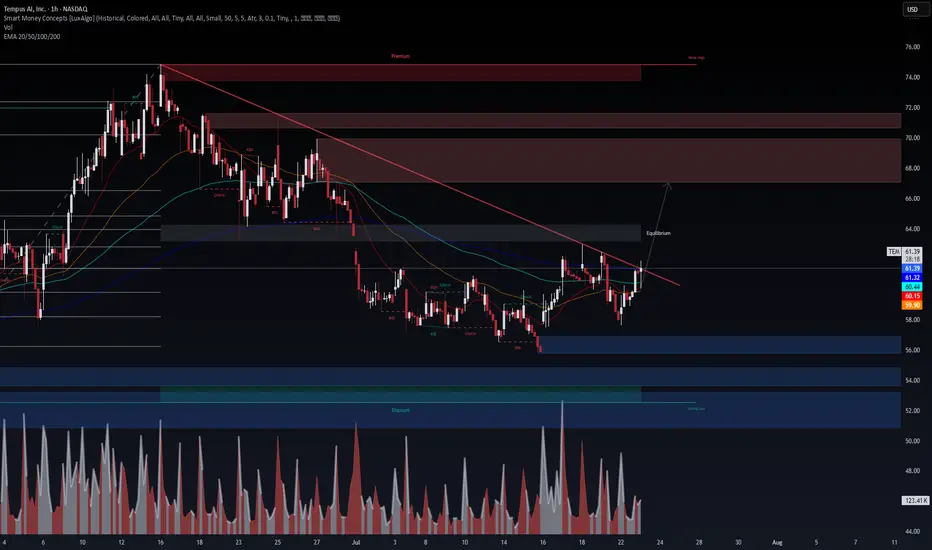
$TEM – Breakout Imminent After Accumulation? NASDAQ:TEM – Breakout Imminent After Accumulation? 📈
Tempus ( NASDAQ:TEM ) is flashing strong bullish signals backed by smart money and confirmed option flow.
🔹 Technical Picture (1H)
Trendline just broken to the upside
Clean break of structure (BOS) after sweep of June/July lows
Volume spike + EMA realignment confirms momentum shift
Targeting the $66–$70 equilibrium zone short-term
High timeframe liquidity sits above $74 — a magnet if momentum continues
🔹 Options Flow (July 23 @ 6:54 AM)
$56K call sweep for Aug 1 $66C (To Open)
Smart money positioning for a rapid move higher — not retail-driven
🔹 VolanX Bias: Bullish
Long trigger confirmed on trendline break and BOS
Risk: < $59.50
PT1: $66
PT2: $70
PT3: $74+ (if volume sustains)
This is now on VolanX watchlist as a potential stealth breakout fueled by institutional flow.
⚠️ For educational purposes. Not financial advice. VolanX Protocol active.
#TEM #Breakout #OptionsFlow #SmartMoney #VolanX #TradingView
Smart Robbery Plan: LINK/USDT Long Setup | Swing/Day Trade Idea🚨CHAINLINK HEIST PLAN 🚨 | LINK/USDT Market Robbery (Thief Trader Style) 💰🔐
🌍 Hola! Bonjour! Hallo! Marhaba! What’s up, Money Makers & Market Robbers?! 🕶️💵
Get ready to raid the LINK/USDT vault with Thief Trader’s high-precision strategy based on 🔥 Technical & Fundamental fusion 🔥.
This is not your regular setup. This is a robbery roadmap. Designed for swing & day traders, and spiced with smart DCA entries, risk control, and a bold vision. Let's get into the game plan before the market alarms go off! 🚓📉📈
🎯 Master Plan – LINK/USDT | Bullish Setup
Entry:
📌 “The vault is open – grab the loot!”
Start entering long anywhere within the nearest price pullback zone. Use 15m to 30m TFs for sniper-style limit entries.
🛠️ Deploy DCA-style multiple limit orders (layered strategy), preferably around recent swing lows or major liquidity zones.
Stop Loss:
🔐 Place SL just below the 4H swing low wick (Currently at $16.50), adjusting for your risk, lot size, and how many limit orders you're stacking.
Take Profit:
🎯 Main TP target: $21.50
⛔ Or bail early if momentum weakens. Your profit, your decision.
⚡️Scalper’s Memo:
Only scalp on the bullish side – stay with the smart money.
Have deep pockets? Jump in now.
On a budget? Join swing traders and follow the full heist plan.
📉 Use trailing SL to secure profits during volatile rallies.
🔍 Fundamental & Sentiment Snapshot:
LINK is gaining bullish traction due to a combo of strong sentiment, favorable macro outlook, and on-chain flows aligning.
📊 Keep eyes on COT reports, intermarket data, and liquidity metrics.
🧠 Sentiment leans bullish while late bears are trapped in the supply zones above.
🛑 Risk & News Management Alert:
🚨 News releases can spike volatility and mess with clean entries.
📵 Avoid placing trades during high-impact events.
📍 Use trailing stop-loss to protect your running profits and preserve capital.
💖Support the Plan, Join the Heist:
Love the trade idea? 💥Hit the BOOST💥 button and show some love to the strategy that lets traders "rob the market" with confidence.
Every like helps build the strongest heist crew on TradingView.
✅ Stay sharp. Stay patient. Stay profitable.
👤 Thief Trader signing out… until the next raid. 🐱👤💰🚀
#LINK #LINKUSDT #CryptoTrading #ThiefTrader #SwingTrade #DayTrade #DCA #BullishSetup #TradingPlan #TA #RobTheMarket #ChainlinkHeist #SmartMoneyMoves

MKR ANALYSIS🔮 #MKR Analysis
🌟🚀 As we said earlier #MKR moved around 48%. Right now #MKR is trading in an Ascending Triangle Pattern and here we can see that #MKR moving again towards its neckline. We see see more bullish move in upcoming days
🔖 Current Price: $2260
⏳ Target Price: $2664
⁉️ What to do?
- We have marked crucial levels in the chart . We can trade according to the chart and make some profits. 🚀
#MKR #Cryptocurrency #Breakout #DYOR


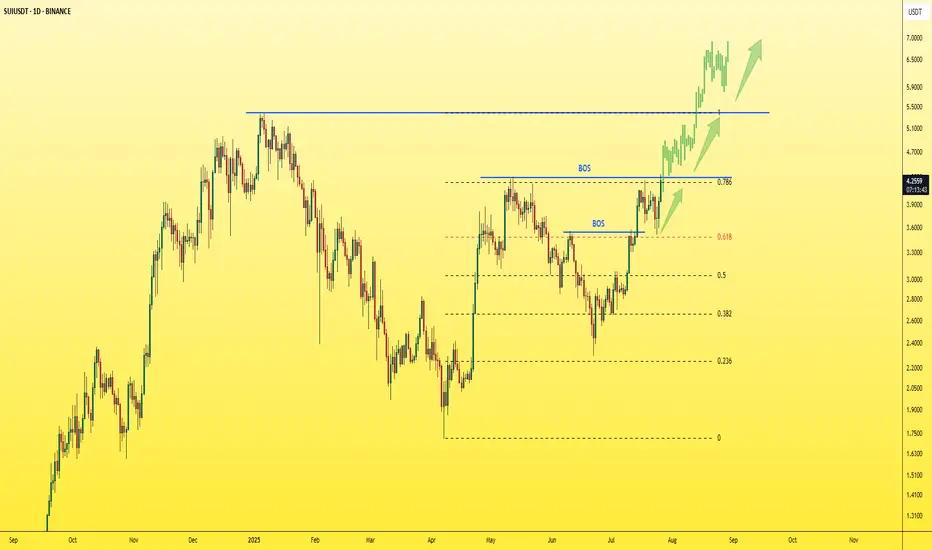
SUI - Just one step away from the explosion!The last candle on the daily chart just confirmed a BOS (Break of Structure) — a clear and strong sign of bullish continuation for the asset.
✅ This is a textbook entry for a long position.
🎯 Next target: $5 — and so far, no bearish signs in sight.
Best regards,
Ceciliones 🎯
TEM – Bullish Continuation to $74+ | Institutional Catalyst fromTEM – Bullish Setup Targeting $74+ | Strong Institutional Backing
VolanX DSS, WaverVanir AI, and SMC confluence confirm a STRONG BUY signal for TEM, with a 15–20% upside potential over the next 30 days.
Key Highlights
AI Forecast:
Current Price: $64.49
30-Day Target: $74.56 (+15.6%)
Model Confidence: Strong Buy
Technical Confluence:
Price has reclaimed equilibrium and is holding above EMA 20/50/100.
Fib levels and channel support point to an upside breakout towards $74–75.
Breakout of $66.3 (0.618 fib) would confirm bullish continuation.
Institutional Catalysts:
Recent Russell 3000E inclusion and increased institutional ownership.
Strong partnerships (AstraZeneca, Pathos AI) and expanding AI-driven healthcare initiatives.
Upgraded 2025 financial outlook.
Trade Plan
Entry: $64.50 (current levels)
Stop Loss: $56.96 (below EMA 100)
Target 1: $65.78 (partial)
Target 2: $74.56 (full)
Risk/Reward: 1.34:1
VolanX Protocol Insight:
Both the AI forecast and technical structure suggest continuation of the bullish channel. A clean breakout above $66.3 opens the door to $74+, with a potential extension towards $80.
