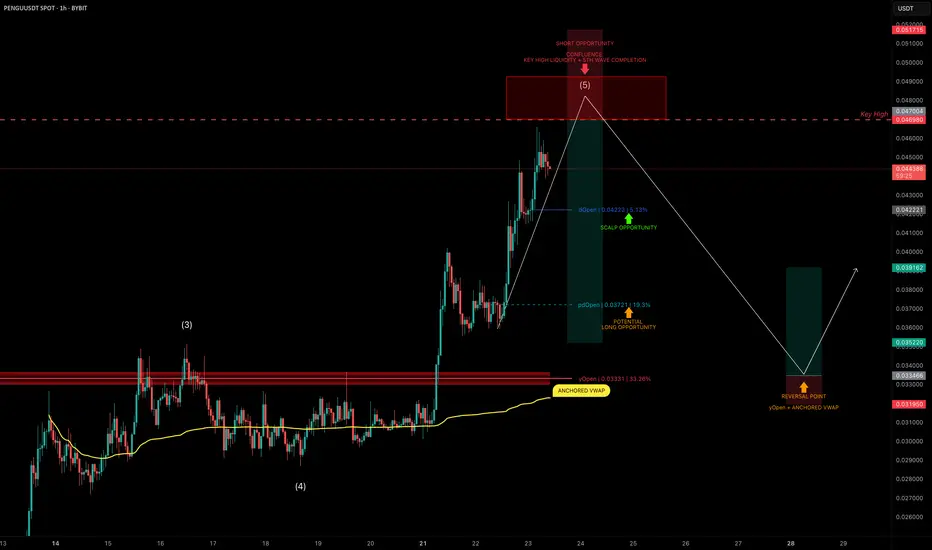
PENGU Topping Out? Targeting 30% Downside After Liquidity SweepPENGU has had an explosive run, but it now looks to be nearing completion of wave 5 of its current Elliott impulse.
We’re approaching a key high at $0.04698, a likely liquidity grab zone — and potentially a great area to position for a short trade.
🧩 Short Setup Overview
➡️ Wave 5 Completion Incoming:
Price is showing signs of exhaustion as it approaches $0.04698, where liquidity is likely stacked above the previous high.
➡️ SFP Trigger Zone:
Watch for a swing failure pattern (SFP) at $0.04698 — confirmation for a potential short entry.
➡️ Psychological Resistance:
The $0.05 level also sits just above — a classic psychological barrier that may get tapped or wicked into.
🔴 Short Trade Setup
Entry: After a confirmed SFP at $0.04698–$0.05
Target (TP): Yearly Open (yOpen) — potential move of ~30%
Stop-loss: Above post-SFP high
R:R: Excellent asymmetry if setup confirms
🛠 Indicator Note
In this analysis I'm using my own indicator called "DriftLine - Pivot Open Zones ", which I recently published.
✅ It helps highlight key open levels, support/resistance zones, and price structure shifts — all critical for confluence-based trade planning.
Feel free to check it out — you can use it for free by heading to my profile under the “Scripts” tab.
💡 Educational Insight: How to Trade Wave 5 Liquidity Sweeps
Wave 5 tops often trap late longs, especially when paired with psychological levels and key highs.
➡️ Patience is key — wait for a rejection pattern or SFP before entering.
➡️ Liquidity sweeps first — then the move.
Final Thoughts
PENGU is pushing toward $0.04698–$0.05, but this may be its final move up before correction.
With the yearly open as a logical target, and clear confluence via DriftLine, this setup offers a clean short opportunity — if confirmation comes.
Stay sharp, let price lead, and trade the reaction — not the prediction.
_________________________________
💬 If you found this helpful, drop a like and comment!
Want breakdowns of other charts? Leave your requests below.
Beyond Technical Analysis
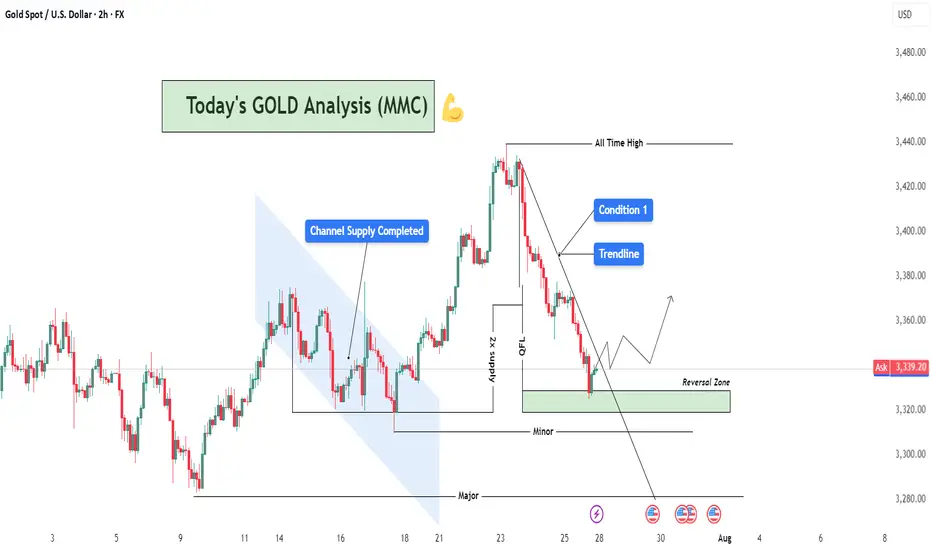
XAUUSD Analysis : Reversal Zone & Trendline Break Setup 🧠 Market Breakdown (Based on MMC Concepts)
Gold (XAU/USD) recently touched an All-Time High, followed by a sharp correction respecting a clean descending trendline — confirming strong selling pressure in the short term.
After price completed a Channel Supply zone (highlighted), it dropped significantly and created a 2x Supply Structure along with a QFL (Quasimodo Failure Level) — a strong indication of liquidity engineering by smart money.
Now, price has entered the Major Reversal Zone, which aligns with a key minor structural demand level. The reaction here becomes highly important, as it could mark the beginning of a new bullish leg.
📌 Technical Conditions
Trendline (Condition 1): Still active; breakout confirmation required for bullish entry.
Reversal Zone (Demand Area): Price currently reacting; signs of rejection forming.
Smart Money Behavior: Liquidity sweep + QFL zone = potential institutional accumulation.
Momentum Watch: Look for bullish engulfing or strong pin bar as confirmation.
🎯 Price Levels to Watch
Upside Targets:
🔹 TP1: 3,360 – 3,380
🔹 TP2: 3,420 – 3,440
Invalidation Zone:
🔻 Break and close below 3,300 = bearish continuation likely.
💡 Conclusion
Gold is approaching a decision point. If this reversal zone holds and we break the trendline, we could see a strong rally back toward previous supply zones. However, failure to hold could bring price lower for further liquidity grabs.
Stay patient. Let price confirm.
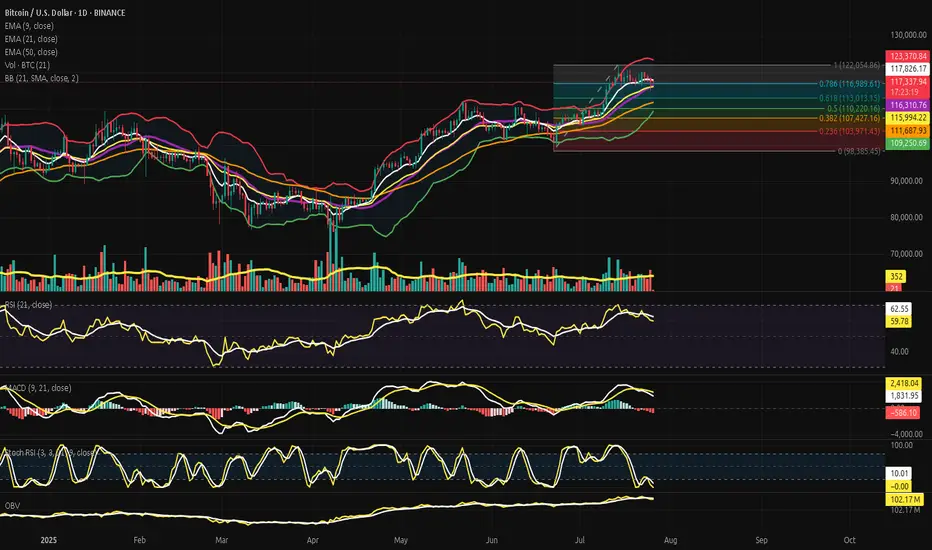
BITCOIN RESULTS Bitcoin has respected the analysis and held very well it’s been following the trend and can partial close some positions and wait for a nice pullback to buy the dip
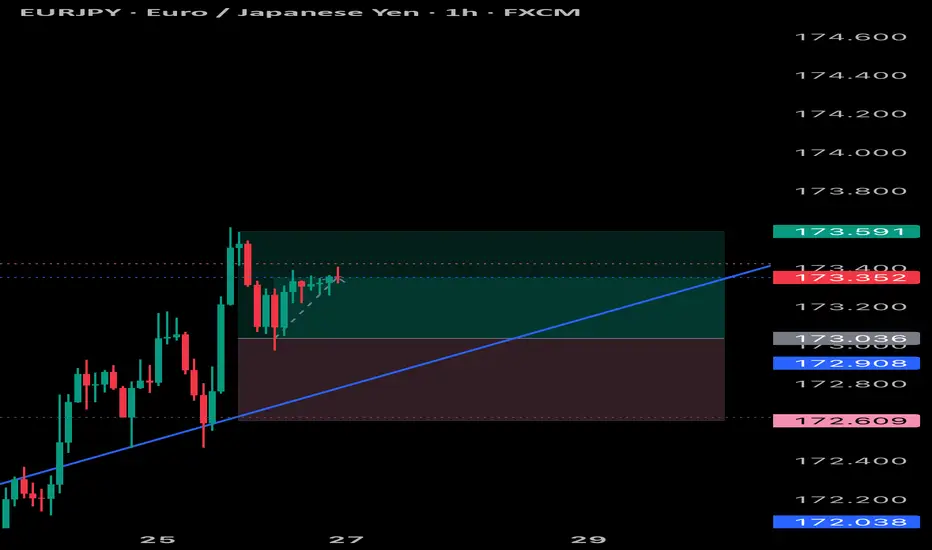
EURJPY LOOKING GOOD Eurjpy has been behaving as expected and can continue to the up side and complete its pattern
Bitcoin Beneath the Arc of Silence - Structural Faith, Tactical?⊢
⟁ BTC/USD - BINANCE - (CHART: 1D) - (July 26, 2025).
◇ Analysis Price: $117,421.02.
⊣
⨀ I. Temporal Axis - Strategic Interval - (1D):
▦ EMA9 - ($117,842.79):
∴ The EMA9)is currently positioned at $117,842.79, slightly above the price ($117,421.02), acting as immediate dynamic resistance;
∴ Price has closed below EMA9 for multiple sessions, indicating a fading short-term momentum arc;
∴ The slope of the EMA9 is flattening, signaling an inflection zone rather than active thrust.
✴️ Conclusion: The short-term control line has been lost tactically; a sign of momentum exhaustion but not structural breakdown.
⊢
▦ EMA21 - ($116,001.77):
∴ EMA21 stands at $116,001.77, serving as an intermediate-range support below current price;
∴ The slope remains positive, providing a second-layer bullish structure after the loss of EMA9;
∴ Price has not tested EMA21 since early July - proximity implies possible gravitational pull.
✴️ Conclusion: EMA21 is the next defense line in a suspended structure, acting as the center of tactical compression.
⊢
▦ EMA50 - ($111,691.19):
∴ EMA50 sits at $111,691.19, aligned closely with the (0.236 Fibonacci) and historical cluster zone;
∴ Price has remained well above this level for over 30 sessions;
∴ The slope is clearly positive, marking macro structural support.
✴️ Conclusion: EMA50 represents the last reliable arc before macro invalidation. Its integrity maintains the long-term bullish thesis.
⊢
▦ Fibonacci Retracement:
∴ Retracement is correctly anchored: 1.0 = $122,054.86 (ATH) / 0.0 = $98,385.45 - (June 22 low);
∴ Price currently oscillates within the 0.618–0.5 zone ($113k–$110k), the classical golden pocket;
∴ The golden pocket aligns closely with EMA21 and the Bollinger mean, forming a triple confluence zone.
✴️ Conclusion: Price is inside the Fibonacci heart of reaccumulation - ideal for breakout setups or breakdown invalidation.
⊢
▦ Bollinger Bands (21, 2.0):
∴ The upper band is at $123,377.19, while the middle band rests at $116,314.72;
∴ Price is between the middle and upper bands, consolidating after rejection from the upper line;
∴ The bands are narrowing, indicating a volatility contraction cycle.
✴️ Conclusion: Bollinger geometry confirms volatility suppression, aligning with RSI and MACD flattening - a signal of impending release.
⊢
▦ RSI (21) + EMA9:
∴ RSI is at (59.99), slightly under its EMA9 - (62.59), showing momentum erosion without collapse;
∴ The RSI has declined from the high 70s in late June, signaling tactical cooling;
∴ Remaining above 50 preserves structural bullish bias.
✴️ Conclusion: RSI is in tactical descent, but not structurally bearish - neutral-to-bullish compression.
⊢
▦ MACD (9,21):
∴ MACD line is below signal line, currently at (1,841.01) vs (2,419.86), confirming a bearish cross;
∴ Histogram prints red for several sessions, with fading amplitude;
∴ Despite the crossover, MACD remains in positive territory, indicating soft correction, not trend reversal.
✴️ Conclusion: MACD confirms a tactical retracement, aligned with RSI weakness, yet within bullish context.
⊢
▦ Stochastic RSI (3, 3, 21, 9):
∴ Current value is 0.00, denoting extreme oversold conditions;
∴ Multiple sessions have closed at this level without relief;
∴ Historically, flatlines at 0.00 often precede upward jolts.
✴️ Conclusion: Stoch RSI indicates exhaustion of momentum - potential for rebound or failed bounce.
⊢
▦ Volume + EMA21:
∴ Volume on current sessions is below the 21-period EMA, confirming absence of strong sell-side dominance;
∴ No abnormal spikes or climaxes are visible - neither panic nor breakout yet;
∴ Volume profile aligns with Bollinger contraction.
✴️ Conclusion: Quiet volume supports the thesis of controlled tactical consolidation, not distribution.
⊢
▦ OBV + EMA9:
∴ OBV stands at 102.17M, flatlined with EMA9;
∴ No divergence detected relative to price;
∴ Momentum of accumulation remains static but not deteriorating.
✴️ Conclusion: OBV is in neutral stance, neither confirming breakout nor selloff - favors tactical patience.
⊢
🜎 Strategic Insight - Technical Oracle:
∴ Bitcoin is suspended in a compressed volatility range beneath its local high, resting upon layered support zones defined by EMA21, Bollinger median, and the Fibonacci golden pocket (0.618–0.5);
∴ Momentum indicators (RSI, MACD, Stoch RSI) are all in tactical decline, yet no structure has been broken - price still floats above all macro EMA's (21, 50) with OBV unshaken;
∴ The short-term weakness is absorbed within a higher-order structural integrity, suggesting latent potential awaiting a fundamental catalyst.
✴️ Conclusion: The oracle observes a coiled market, technically restrained but not structurally broken - an archetype of Strategic Suspension Beneath the Arc of Silence.
⊢
∫ II. On-Chain Intelligence - (Source: CryptoQuant):
▦ Exchange Netflow Total + 9EMA - (All Exchanges):
∴ The current netflow is (-864.6 BTC), remaining firmly below its EMA9 baseline;
∴ The 9-day moving average of netflows is flat-to-negative, signaling persistent withdrawal pressure from exchanges;
∴ Sustained negative netflows in conjunction with a stable price floor indicate non-speculative cold storage behavior.
✴️ Conclusion: Netflow structure is bearish for exchanges, but bullish for long-term price, as BTC flows into private custody.
⊢
▦ Miner to Exchange Flow + 9EMA - (All Miners):
∴ Current flow from miners hovers near 1.2K BTC/day, well below the EMA9 which trends above 3K;
∴ The flow has not pierced its EMA9 in recent weeks, despite BTC testing local highs - a strong non-distribution signal;
∴ The divergence between low miner outflows and high price resilience confirms supply-side discipline.
✴️ Conclusion: Miner flows remain suppressed beneath EMA9 - a structurally bullish posture amid local consolidation.
⊢
▦ Funding Rate + 9EMA - (All Exchanges):
∴ The funding rate is (+0.012), sitting above its EMA9, indicating a minor long bias across derivatives markets;
∴ There is no spike or deviation suggesting leveraged imbalance - the slope of the EMA9 remains shallow;
∴ Funding above EMA9, with RSI and MACD fading, implies a passively bullish positioning without euphoria.
✴️ Conclusion: Funding is technically constructive, aligned with healthy sentiment - not overheated, nor bearish.
⊢
▦ Spent Output Profit Ratio - (SOPR) + 9EMA - (Adjusted):
∴ The SOPR stands at 1.016, maintaining a position above its 9-day EMA;
∴ No dip below 1.0 has occurred in recent sessions, showing that BTC is being transacted in profit;
∴ EMA(9) acts as a median around 1.0 - a psychological pivot between profit realization and capitulation.
✴️ Conclusion: SOPR above EMA9 confirms a healthy trend, with profits being realized in harmony - not desperation.
⊢
🜎 Strategic Insight - On-Chain Oracle:
∴ All four on-chain pillars - Exchange Netflow, Miner Flow, Funding, SOPR - operate in favor of structural continuation, with none indicating exhaustion or distribution;
∴ The alignment of each indicator above or below EMA9 in the appropriate direction (accumulation vs euphoria) forms a cohesive bullish framework;
∴ The lack of pressure from miners, and the smooth funding environment, give room for technical consolidation to mature without triggering panic.
✴️ Conclusion: The oracle discerns a hidden current of strength, buried beneath the tactical mist. Structural forces remain aligned with continuation - though the flame is dimmed, it is not extinguished.
⊢
⧉ III. Contextvs Macro-Geopoliticvs - (July 25, 2025):
▦ 10:00 AM - Core Capital Goods Orders - (Durable Goods excl. Defense & Aircraft):
∴ The index, a proxy for business investment, contracted by (-0.7%) in June - the sharpest monthly decline of the year;
∴ This marks a decisive loss of momentum in private-sector expansion;
∴ While shipments rose slightly (+0.4%), the delta is attributed to inflation, not demand.
✴️ Conclusion: The business sector shows signs of hesitation, reinforcing the case for policy accommodation.
⊢
▦ 14:30 PM - Trump's Visit to the Federal Reserve - (Rare Executive Intervention):
∴ President Trump visited Powell directly, urging him to cut interest rates to "save the American engine";
∴ Powell responded with a carefully chosen phrase: “The country is doing really well” - read by markets as passive affirmation;
∴ This act marks a rare intrusion into Fed independence, adding political volatility to monetary policy expectations.
✴️ Conclusion: The Fed is now politically cornered, caught between inflation resilience and political coercion.
⊢
▦ 16:00 PM - Market Response & Euphoria Spike:
∴ U.S. indices - S&P 500, Nasdaq, Dow Jones - all reached all-time highs on the back of Powell's phrase and Trump’s pressure;
∴ Approximately 80% of S&P companies beat earnings expectations, providing fuel to the narrative;
∴ Market interpreted silence as assent, reactivating the “Fed put” theory.
✴️ Conclusion: Markets responded as if Powell had already signaled rate cuts, despite no formal commitment.
⊢
▦ 18:00 PM - Rate Cut Probability Assessment - (CME/FedWatch):
∴ Probability of a rate cut in September rose to (61.8%), precisely echoing the Fibonacci retracement now governing Bitcoin price;
∴ This alignment signals macro-on-chain-temporal resonance;
∴ Powell reiterates data dependency - no promises, but full optionality.
✴️ Conclusion: The macro veil is thin - policy pivot is anticipated, but not yet manifest. Tactical patience is vital.
⊢
🜎 Strategic Insight - Macro Oracle:
∴ Economic data weakens subtly;
∴ Political pressure intensifies;
∴ Market euphoria resurfaces on whispers, not substance.
∴ The silence of Powell is being interpreted, not spoken - a dangerous act of collective projection.
✴️ Conclusion: The Fed speaks in veils - and markets trade in illusions. The macro climate is now psychologically unstable, but not yet structurally broken.
⊢
𓂀 Stoic-Structural Interpretation:
▦ Structurally Bullish - Tactically Suspended:
∴ Price action remains well supported above all macro EMA's (21, 50), the OBV is intact, and no distribution signals are present;
∴ Momentum indicators (RSI, MACD, Stoch RSI) confirm a tactical cooldown, not collapse;
∴ On-chain fundamentals (Netflows, Miner Behavior, SOPR, Funding) remain constructively aligned.
✴️ Conclusion: Structurally, the market preserves a bullish foundation, while tactically locked in volatility suppression and directional indecision.
⊢
▦ Tactical Range Caution:
∴ Resistance: $123,377.19 (Upper BB), then $126,000 (local expansion);
∴ Pivot: $117,800 (EMA9) / $116,000 (EMA21);
∴ Support: $113,013.15 (Fibonacci 0.618), $111,691.19 (EMA50), then $107,400 (macro reversal threshold).
✴️ Conclusion: Tactical range is compressed within a ($116K-$123K) gate. Below $111K triggers macro risk.
⊢
◩ Codicillus Silentii - Strategic Note:
∴ In the breath between policy and projection, the markets chant futures yet unspoken.
BTC rests not in fear, nor in hope - but in silence.
✴️ Final Seal: The arc is intact. The veil has not fallen. Patience is power.
⊢
⧉
· Cryptorvm Dominvs · MAGISTER ARCANVM · Vox Primordialis ·
⚜️ ⌬ - Silence precedes the next force. Structure is sacred - ⌬ ⚜️
⧉
⊢
BTC Consolidates Below 119,300 Over the Weekend💎 BTC WEEKEND PLAN UPDATE (26/07)
NOTABLE BTC NEWS
The cryptocurrency market is attempting to stabilize after a wave of sell-offs during Friday’s Asian session, when Bitcoin (BTC) dropped to an intraday low of $114,723. A recovery trend is gradually strengthening, with BTC trading at $115,868 at the time of writing, indicating that buying interest at lower levels may increase in upcoming sessions.
TECHNICAL ANALYSIS PERSPECTIVE
Symmetrical Triangle Pattern
BTC is currently fluctuating within a symmetrical triangle pattern, with converging upper and lower trendlines. This pattern typically signals a strong consolidation phase before a decisive breakout.
Scenario unfolded as planned:
• The price failed to break the resistance zone around $120,000 (previously forecasted as a likely failed breakout zone).
• BTC then dropped sharply to the support zone around $115,000, touching the lower trendline and the potential breakout zone.
• At this level, the price rebounded as expected, indicating strong buying pressure at support.
MA lines supporting the trend:
• The price is currently moving around the 200-day MA (red line), showing that the dynamic support is working effectively.
• The 50-day MA (yellow line) is acting as short-term resistance. If broken, it could support the recovery momentum.
Two potential upcoming scenarios:
🔼 If BTC breaks above the $119,500 – $120,000 zone with strong volume, it may continue to test higher levels around $123,000 – $125,000.
🔽 Conversely, if it faces strong rejection around $119K and turns downward, BTC may retest the support zone at $114,000 – $115,000 once again.
Stay tuned to the channel for the latest and continuous updates on XAUUSD, CURRENCIES, and BTC.

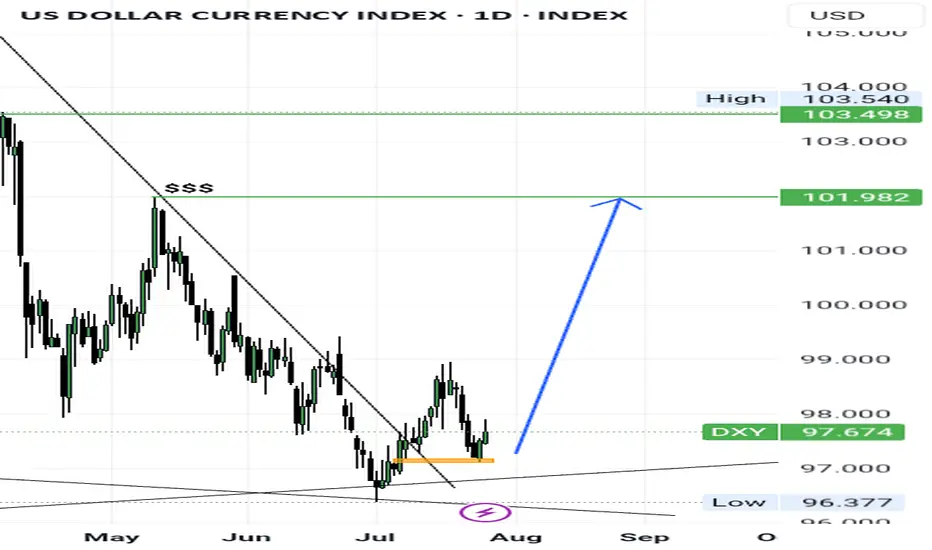
Dollar indexDollar index in deep discount
Looking for higher prices this month
This my idea not a signal
#ICT
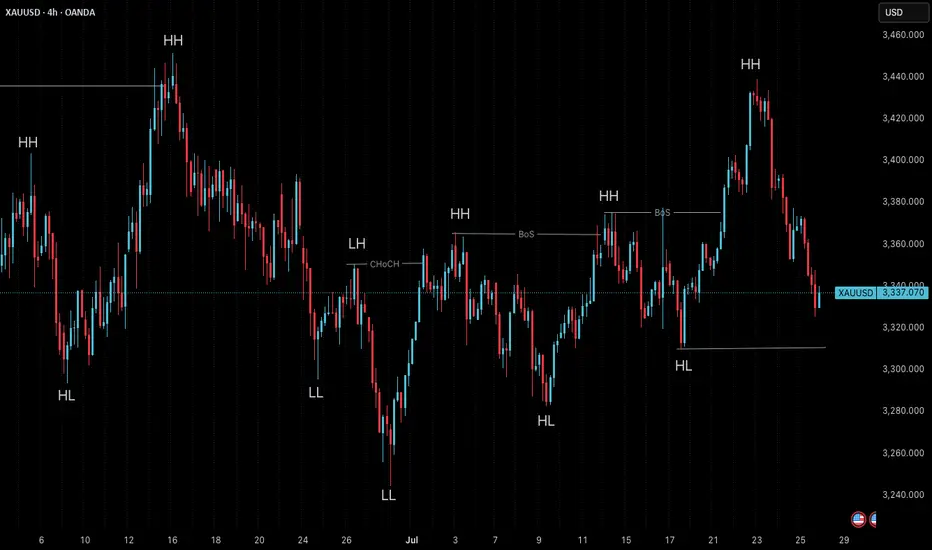
Market Structure is Not Strategy — It’s Your Starting Point“The chart doesn’t hide anything. But your mind does.”
Before any indicator, setup, or signal… comes structure.
🔍 What is Market Structure?
At its core, market structure is the sequence of higher highs (HH) and higher lows (HL) in an uptrend, or lower lows (LL) and lower highs (LH) in a downtrend.
It is the skeleton of price .
Everything else — entries, zones, signals — is just clothing.
If you can’t see the skeleton, you’re reacting to noise.
🎯 Why It Matters:
It’s not a signal. It’s context .
It tells you whether you’re trading with the market or against it .
It defines where your patience begins — not where your entry is.
Market structure helps you let go of the urge to chase. It brings order to the chaos.
🧩 Key Components to Track:
Break of Structure (BoS): Confirms trend continuation
Change of Character (ChoCH): Signals a potential reversal
Swing Points: Define the intent behind price moves
Liquidity Sweeps: Often mask real structure beneath short-term traps
🛑 Common Mistake:
Most traders jump straight to the setup without asking the most important question:
“Where am I in the structure?”
They try to buy a pullback — in a downtrend.
They try to fade a move — right before continuation.
They chase candles — instead of waiting for alignment.
That’s not strategy. That’s stress.
🛠 Tip to Practice:
Use this simple framework to build clarity:
Start from the H4 chart — this gives you the broader directional bias
Drop to M15 — here’s where structure begins to form tradeable setups
Finally zoom into M1 — this is where confirmation happens before entry
Ask yourself:
Where did the last BoS or ChoCH happen on each timeframe?
Is M15 aligning with H4 intent — or contradicting it?
Did you enter after M1 confirmation , or based on impulse?
You don’t need to predict price. You need to align with it.
🪞 Final Thought:
Structure isn’t strategy.
It’s the mirror that shows what’s real before your bias speaks.
When you master structure, you stop forcing trades — and start flowing with them.
💬 Want more like this?
If this post resonated with you — drop a comment below.
Let me know what you'd like to dive deeper into — price action, gold setups, market structure, or the psychology behind your trades.
I’ll build future tutorials based on what matters to you.
📘 Shared by @ChartIsMirror
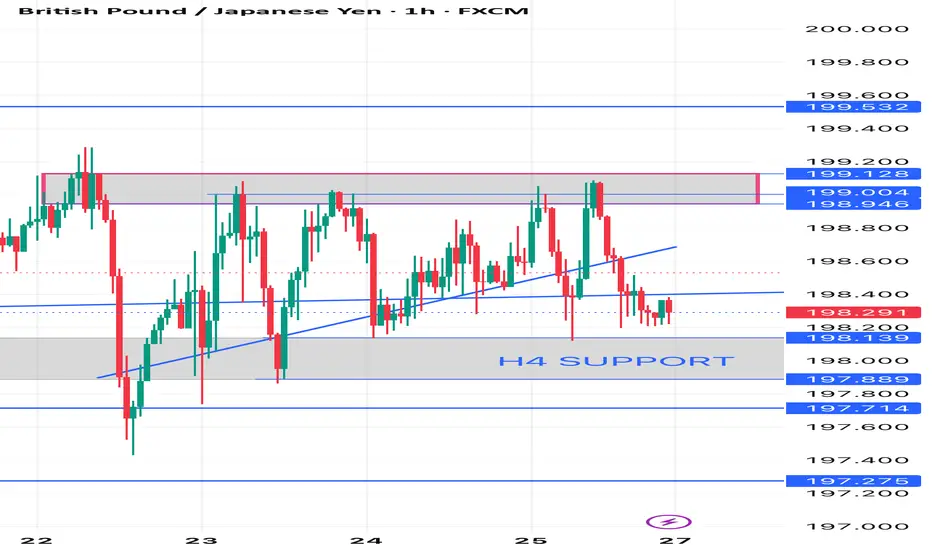
GBPJPY Daily chart analyses
Advanced Price Analysis with Timeframes
1. Key Observations from the Provided Data (H4 Chart)
Current Price197.800 testing the H4 SUPPORTlevel at 198.000
- Trend Downtrend (Lower Highs & Lower Lows).
- *Recent Structure
- Resistance ~199.600 (rejected multiple times).
- **Support -198.000 (critical level).
- If 198.000 breaks next support is 197.500–197.000
*a) Higher Timeframe (Daily/D1)
- If the **daily trend is bearish**, the H4 downtrend is likely to continue.
- If the **daily trend is bullish**, the H4 drop could be a retracement before a bounce.
- **Key Confirmation Needed**:
- Check if **198.000 aligns with a daily support level** (e.g., Fibonacci, moving averages).
**b) Lower Timeframe (H1/M15)
- **Breakdown Scenario**: If price stays below **198.000** with strong bearish candles, expect a drop to **197.500 → 197.000**.
- **Rebound Scenario**: If price holds **198.000** and forms a bullish reversal pattern (e.g., hammer, double bottom), a bounce to **198.600–199.000** is possible.
---
*3. Key Levels to Watch
| **Level** | **Importance** | **Scenario** |
|-----------------|-------------------------|--------------|
| **199.600** | Strong Resistance | Only break = Trend reversal |
| **198.600** | Minor Resistance | Re-test if bounce occurs |
| **198.000** | **H4 SUPPORT (Critical)** | Hold = Bounce / Break = Drop |
| **197.500** | Next Support | Target if 198 breaks |
| **197.000** | Psychological Support | Strong demand zone |
---
4. Trading Strategy Suggestions**
- **Bearish Bias (Down)**:
- Short if **198.000 breaks** with confirmation (e.g., closing below + high volume).
- Target: **197.500 → 197.000**.
- Stop Loss: **Above 198.300**.
- **Bullish Bias (Up)**:
- Long if **price bounces from 198.000** with a bullish pattern.
- Target: **198.600 → 199.000**.
- Stop Loss: **Below 197.800**.
---
5. Final Verdict**
- **Higher Probability**: **Downside** (unless 198.000 holds strongly).
- **Reversal Signal Needed**: Bullish engulfing, RSI divergence, or volume surge.
**Recommendation**: Wait for **confirmation at 198.000** before taking a trade.
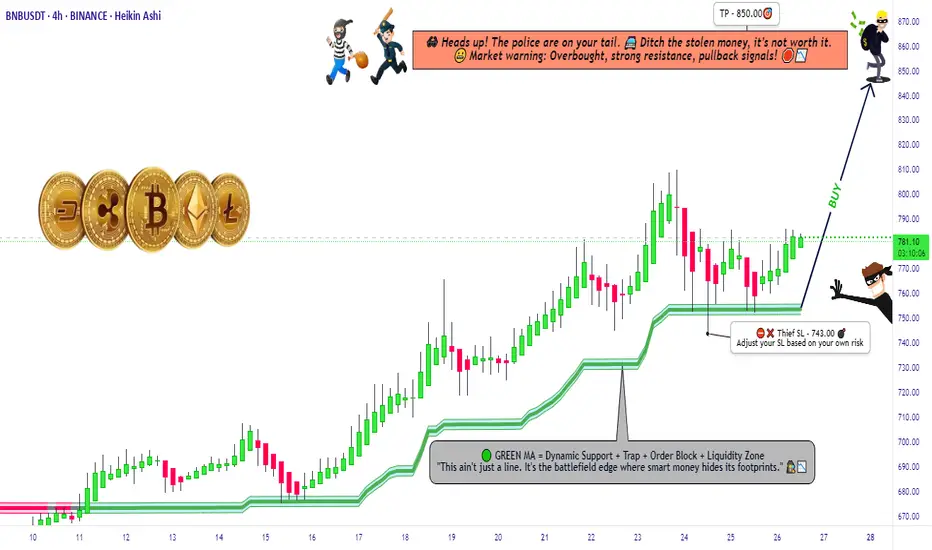
"BNB Primed for a Pump – Thief Trading Mode Activated!"🚨 BNB/USDT HEIST PLAN – SWIPE THE BULLISH LOOT BEFORE COPS ARRIVE! 🚨
🌟 Attention, Money Makers & Market Robbers! 🌟
(Hola! Oi! Bonjour! Hallo! Marhaba!)
The BNB/USDT vault is CRACKED OPEN—time to execute the ultimate heist! 🏦💰 Based on 🔥Thief Trading Style Analysis🔥, here’s your lucrative robbery blueprint for the Binance Coin vs. Tether market.
🔐 MASTER PLAN: LONG ENTRY HEIST (HIGH-RISK, HIGH-REWARD)
🎯 TARGET: 850.00 (or escape before the cops show up!)
🚨 POLICE TRAP ZONE: Overbought + Strong Resistance – Bears & cops are lurking!
💎 TAKE PROFIT EARLY & TREAT YOURSELF! (You’ve earned it, outlaw!)
⚔️ ENTRY STRATEGY: SWIPE FAST OR WAIT FOR THE PULLBACK!
🤑 VAULT IS OPEN! Enter any price if you’re bold (instant long).
🕵️♂️ SMART THIEVES: Use buy limit orders near 15M/30M swing lows/highs for a safer heist.
🛑 STOP-LOSS (ESCAPE ROUTE)
Thief SL: 743.00 (4H candle wick – adjust based on your risk tolerance!)
⚠️ WARNING: If the cops (bears) break in, DON’T HESITATE—RUN!
🎯 TARGETS & ESCAPE PATHS
Scalpers: Trail your SL & escape with quick loot! (Only long-side allowed!)
Swing Bandits: Hold strong but watch for police traps!
📡 MARKET INTEL (WHY THIS HEIST WILL WORK)
Bullish momentum in play! (But stay sharp—consolidation & reversals possible.)
Fundamentals, COT Reports, On-Chain Data, & Sentiment all hint at more upside!
🚨 TRADING ALERTS – DON’T GET CAUGHT!
📰 NEWS = VOLATILITY! Avoid new trades during major releases.
🔒 LOCK PROFITS! Use trailing stops to protect your stolen gains.
💥 BOOST THIS HEIST – STRENGTHEN THE SQUAD! 💥
🔥 Hit the LIKE & FOLLOW to support the robbery team!
🚀 More heists coming soon—STAY TUNED, OUTLAWS! 🚀
🎯 Trade Smart. Steal Big. Escape Faster. 🏴☠️
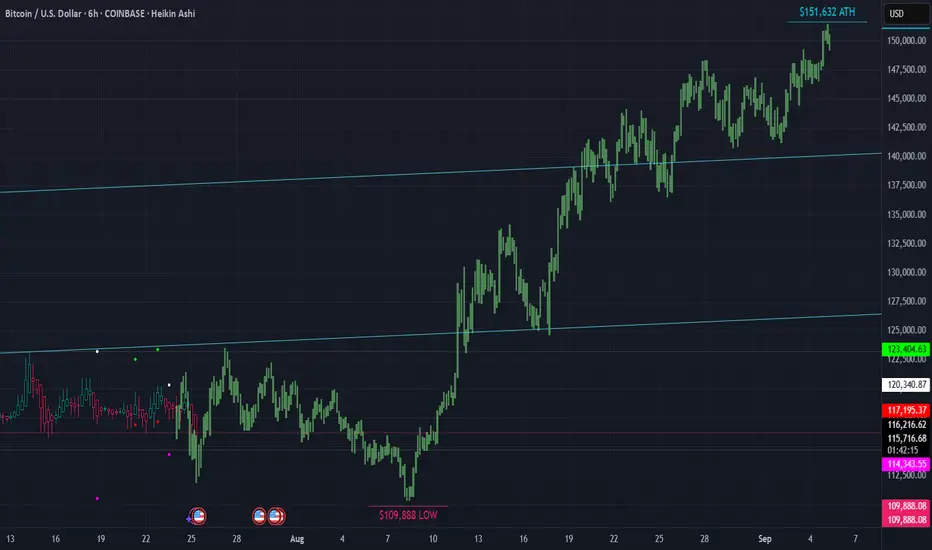
▒₿▒ BITCOIN FORECAST | 6HR ▒₿▒Hello @everyone. Long time. . . I was on a 3 year spiritual journey. I am back now and have many good things in the works. Who took my (non-financial) advice 3 years ago when I called the low of $15K a year in advance? And who believed me that it would go to $150K once we hit that $15K low? Who believes me now? Are you still thinking we've topped? Or do you think we have our $150K target in sight?
Have a look at this 6 HR Forecast. We have a low coming around AUG 8TH at $108K. And the most notable ATH of $151K around SEPT 5TH.
This is it. The playbook years in advance. I have never asked for anything or tried to sell you anything. It's all been done from a position of "paying it forward". Please, if you've taken my advice do the same.
I first bought Bitcoin in 2011. Was part of the MT GOX hack. And have had many ups and downs since then. One thing has never changed. . . And that is that Bitcoin is King. It's an asset class and a hedge against inflation. We're seeing this happen more now than ever. It's only got inflation as the halvings continue. The inflation rate of Bitcoin since/after this last halving is 0.84%. Bitcoin is up over 120-Million percent since 2011. Look at the BTC 6 MONTH candle chart and you'll see what Crypto asset you want to be in. Bitcoin is the only crypto asset.
When I first bought BTC it wasn't possible to purchase on an exchange with a debit card. I had to buy Linden Dollars from "Second Life" (which didn't always work because I had to deal with International Payment Processors due to US restrictions), then convert them to BTC on Mt Gox. Hardware wallets were not a thing. Now you can setup your bank account to auto buy on Coinbase and others. It's easier than ever. Store your coins on a hardware wallet and stay protected from the next FTX or hack.
This is the asset of the future. The "Digital Gold". I've seen the future and it runs on Blockchain and digital/virtual currency. A Super Artificial Intelligence will run and optimize all of our systems. Voting, assets, deeds, ownership and more will all be on a public blockchain ledger.
DEMATERIALIZATION/VIRTUALIZATION
INFORMATION & MEDIA
Music
We had music being played using metal, tin and wax in the 1800's, then mid 1900's we went to Vinyl and later in the late 1900's we went to plastic cassettes. And in 1990 - 2000 we had the CD which used laser optics to play the music. Effectively digitizing it. Then of course the MP3 player which was the next evolution in digitization. But where are we now? We are still in a type of digitization however it's evolved also. We are in a virtualization, where the music is not stored on the device itself, it's stored on servers which host the data to be accessed in the cloud/virtually.
You see the progression?
Metal/Wood > Vinyl/Plastic > Plastic/Digital > Metal/Digital > Virtual
(Or even further simplified on a higher level it would be Thoughts > Things > Digital > Virtual >)
What else has taken this path?
Movies
Metal/Wood - Film Projectors & Metal Reels
Plastic - Video Cassettes
Plastic/Digital - Optical Discs
Metal/Digital - Personal Digital Devices
Virtual - Cloud-Based Streaming
Books & The Written Word
Metal/Wood - The Printing Press
Paper/Plastic - Paperback Books
Plastic/Digital - Digital Archives on Discs
Metal/Digital - Handheld E-readers
Virtual - Cloud Libraries & Audiobooks
Money & Finance
Metal/Wood - Gold & Silver Coins (and even wooden coins)
Plastic - Payment Cards
Plastic/Digital - Secure Chip Cards
Metal/Digital - Mobile & Digital Wallets
Virtual - Digital/Crypto Currencies
This is the natural progression path. Are you the one still listening to cassette tapes while the MP3 player exists? Are you still using a physical thing while the virtual exists? (Nostalgia aside.)
NOW IS THE TIME!
Gold has been virtualized and it's called Bitcoin. While trading at 1,200,000 times more than it was 14 years ago it still has not yet realized it maximum value. In the past Gold and Silver were taken and bank/promissory notes were given in exchange. In fact it became illegal to not exchange your Gold and Silver for Dollars in the US. (1933 with the issuance of Executive Order 6102 by President Franklin D. Roosevelt.) The Dollar has no cap and is no different than Doge in that sense. BTC has a cap and a proof of work concept just like Gold. If you need to pay for things convert your BTC when you need to but holding or planning on making money off any other crypto currency that does not provide a base layer for our new virtualized financial infostructure it will not happen.
BITCOIN IS FINANCIAL LIBERATION FOR YOU, YOUR FAMILY, FRIENDS AND LEGACY.
BTC is up 3,000% in the past five and half years alone.
That's a 5.45 X Multiple per year. 545% growth rate compared to the unlimited and inflationary Dollar. Why not setup a reoccurring dollar cost average automatic purchase? We live in a day of virtualized programable currency, why not convert vapor currency to digital gold with the few clicks?
I am not a financial advisor. I am a Bitcoin Maximalist. Trade at your own risk. Assume your own responsibilities.
I have a big project I'm working on right now but also working on some TV Indicators in the background. I will share them with you all once I'm done testing them.
DISCLAIMER
I AM NOT A FINACIAL ADVISOR, NOR AM I YOURS. THIS IS NOT FINANCIAL ADVICE. MEARLY DOODLINGS ON A MATHMATICALLY DRIVEN GRAPHICAL INTERFACE, TRACKING AN INVISIBLE 256BIT MILITARY-GRADE ENCRYPTED ASSET. . . FOR ENTERTAINMENT/AMUSEMENT PUROSES ONLY. ENJOY!
EUR_CAD LOCAL SHORT|
✅EUR_CAD is going up to retest
A horizontal resistance of 1.6110
Which makes me locally bearish biased
And I think that we will see a pullback
And a move down from the level
Towards the target below at 1.6077
SHORT🔥
✅Like and subscribe to never miss a new idea!✅
Disclosure: I am part of Trade Nation's Influencer program and receive a monthly fee for using their TradingView charts in my analysis.

BTC USD LONG SETUPHI
IN THE LAST FORCAST WE WAS bulish on BTC
after hiting the weekly BISI and giving us a 4 h CISD
i put my entry on market at the open on the 4h CANDLE
sl swing low
target 1/2-1/3

VIRTUAL – Major Confluence ZoneEntry into 3D S/R and Demand Zone (Blue Box)
The current price action is testing a key 3D support/resistance level, which aligns with a historical demand zone.
Multiple diagonal supports converge here, making it a high-probability zone for a reaction.
Accumulation & Reversal Play
The setup suggests that this zone is ideal for building a position.
Expect potential wicks/spikes into the lower blue zone, hunting liquidity before a reversal.
If price holds above ~$1.40 (blue line), look for signs of strength (bullish candles, reclaim of lost support).
Upside Targets
If the zone holds, the first target is the prior local highs ($2.00–2.05).
Further targets are the overhead supply zones (highlighted in red), especially if the momentum persists.
Invalidation
A daily close below $1.40 or sustained trading below the lower blue box invalidates the setup and signals a risk-off environment.

$CRV Equal Lows ShortExtended Range
CRV has been ranging for almost week with no clear direction.
Price has respected resistance above $1.10 multiple times.
Obvious Liquidity Pool
Multiple equal lows are sitting at the $0.90 level, a textbook liquidity magnet.
Market makers are likely to target this area before any substantial move higher.
Short Entry
Short from just above $1.00, stop above the range high.
Target is a sweep of the $0.90 lows.
Next Steps
Watch for signs of absorption or reversal if price wicks below $0.90.
Consider flipping long if strong buyback or deviation forms after the liquidity sweep.
Reasoning
CRV has spent week ranging, building up an obvious set of equal lows. This is classic “liquidity sitting on a platter” for larger players. Short setups are favored while the range top holds, aiming for a stop run below $0.90. After the sweep, be open to a fast reversal or potential swing long if bulls reclaim the level.

Nasdaq100 Bulls ready to drive the price to 23,300 handle With the choch on the market structure and with Key data released on Thursday, reflected strength in the U.S. economy. Stocks rose this Thursday, buoyed by fresh economic data reports and a slew of corporate earnings releases. The tech-heavy Nasdaq Composite has advanced 0.4%, and quarterly earnings reports released this week have exceeded Wall Street’s expectations, fueling investor confidence. I am expecting that by the end of this week or the beginning of next week will see the bulls drive the market to our 23,300 handle. I am with the bulls on this one
Tp1.23,300.

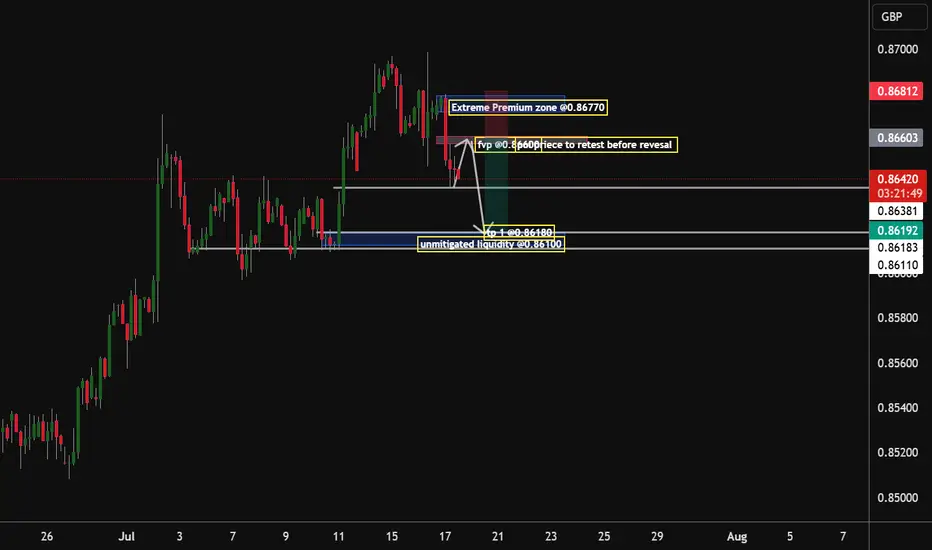
Eur/Gbp Bears to seek the 0.86180 Handle By early next week, my analysis according to the market structure being formed suggests that the institution that drives the market will have to be dovish on this pair, as there is unmitigated liquidity awaiting to be grabbed @ the 0.86100 zone by the end of next week will have to see that zone being mitigated
Tp 1.0.86180
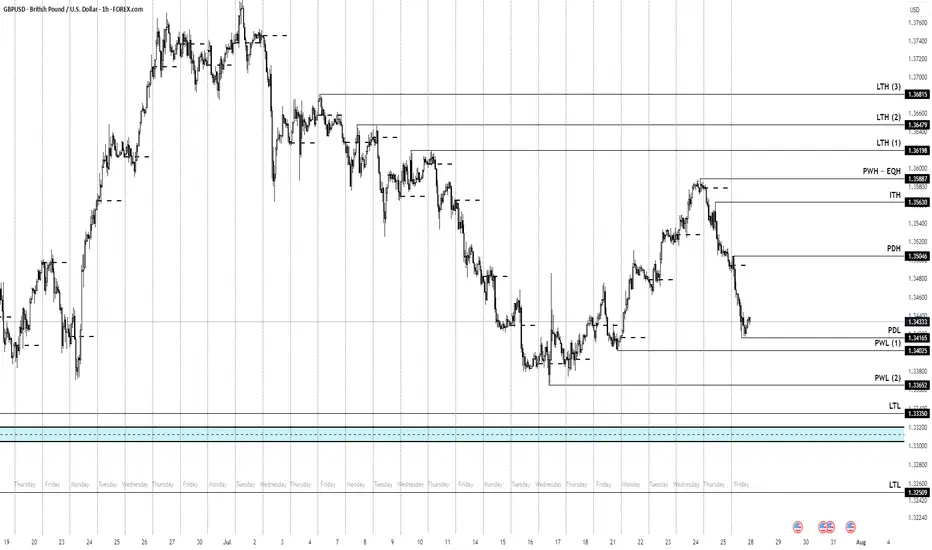
Cable Price Points to keep track off going into NFP/FOMC weekHeading into NFP week we have mixed bias.
Daily sais : BEARISH
Weekly is BULLISH (specially that we closed respecting a +FVG)
Ofc, being an NFP week we trade with care.
Nevertheless i highlighted some key Highs and Lows to keep track of.
BTC LONG SWING ENTRY OFF PREVIOUS LOW AREASWe are looking to make a BTC long entry on previously supported levels using just chart analysis. Looking at a rebound on a daily actual range trade where add on possible reversal and scale out into the a new local high.
In short, buying the gold, adding in the blue, scaling out into the green.
As you can see been a while so playing this small, getting back into the action

Why Bitcoin's Bull Run Hits a WallBitcoin's Bull Run Hits a Wall: A Deep Dive into the $115K Correction, Record Leverage, and the Battle for Market Control
A sudden and violent tremor has shaken the cryptocurrency market to its core. After a period of quiet range-bound trading, Bitcoin has decisively moved from consolidation to a sharp correction, plunging below the critical $116,000 support level and briefly touching $115,000. The abrupt downturn triggered a "bloodbath for crypto longs," liquidating hundreds of thousands of traders and wiping out nearly $600 million in leveraged positions. Yet, as the dust settles, a complex and contradictory picture emerges. While institutional sell-offs and cascading liquidations paint a grim short-term picture, record-high open interest, significant liquidity grabs, and bullish on-chain signals suggest the long-term uptrend may be far from over. This article delves into the anatomy of the crash, the forces that fueled it, and the fierce battle between bearish catalysts and bullish undercurrents that will define Bitcoin's next move.
Part 1: The Anatomy of the Correction - From Sideways to Sell-Off
For weeks, Bitcoin's price action was characterized by consolidation, a phase where an asset trades within a defined range, reflecting market indecisiveness. After a strong upward trend that pushed Bitcoin to new highs above $120,000, this period of sideways movement was seen by many as a healthy pause before the next leg up. However, this placid surface masked building pressure. The transition from this consolidation phase to a full-blown correction was swift and brutal.
A market correction is defined as a rapid price change, often a decline of at least 10% but less severe than a crash, that disrupts an asset's prevailing trend. The recent tumble below $116,000 fits this description perfectly. The sell-off was not a gradual slide but a violent dislocation, breaking through established support levels and triggering a wave of panic.
This dramatic shift was exacerbated by several key factors. On-chain data revealed that a significant institutional player, Galaxy Digital, unleashed a massive sell-off, reportedly moving billions in Bitcoin to exchanges. This sudden injection of supply into the market acted as a powerful catalyst, overwhelming buy-side pressure and initiating the downward price spiral. The market's reaction was immediate, with the price slicing through the psychological support at $116,000 and heading towards the next major liquidity zone around $115,000.
Part 2: The Cascade - A $600 Million Bloodbath for Leveraged Traders
The speed of the price drop had a devastating impact on the derivatives market, a space where traders use borrowed funds to amplify their bets on price movements. The sudden downturn resulted in one of the most significant liquidation events in recent memory, with 213,729 traders liquidated for a total of nearly $600 million over a 24-hour period.
What is a Liquidation?
In crypto futures trading, liquidation is the forced closure of a trader's position by an exchange. This happens when a trader can no longer meet the margin requirements for their leveraged position, meaning their collateral is insufficient to cover their mounting losses. For example, a trader using 20x leverage on a $1,000 position controls $20,000 worth of Bitcoin. However, a mere 5% price move against them can wipe out their entire initial capital, triggering a liquidation.
The recent event was a "bloodbath for crypto longs," meaning traders who had bet on the price of Bitcoin increasing were the primary victims. As the price fell, these long positions became unprofitable, and once they crossed their liquidation price, exchanges automatically sold the collateral on the open market to cover the losses.
This process created a deadly feedback loop known as a liquidation cascade. The first wave of forced selling from liquidated longs added more downward pressure on the price. This, in turn, pushed the price down further, triggering the liquidation of another set of long positions whose liquidation prices were slightly lower. This domino effect—where liquidations cause lower prices, which in turn cause more liquidations—is what transforms a standard price dip into a violent market crash. This automated, rapid chain reaction is a hallmark of the highly leveraged and volatile crypto markets.
Part 3: The Fuel for the Fire - Open Interest Reaches a Record $44 Billion
Underpinning this massive liquidation event was an unprecedented buildup of leverage in the market, best measured by a metric called Open Interest (OI). Open Interest represents the total number of active or unsettled futures contracts in the market. It’s a measure of the total capital and number of positions committed to the derivatives market, distinct from trading volume, which counts both opened and closed positions. An increase in OI signifies that new money and new positions are entering the market, often leading to higher volatility.
In a stunning development, as Bitcoin's price began to plunge, the total Open Interest surged to a new all-time high of $44 billion. This unusual divergence—where price falls while open interest rises—suggested that a significant number of new short positions were being opened to bet against the market, while many longs remained trapped, hoping for a reversal. This created a powder keg of leverage.
Further fueling this was a notable surge on the world's largest crypto exchange. On-chain data showed that traders added 10,000 Bitcoin worth of open interest to the BTCUSDT perpetual contract on Binance alone. This single-day surge in open interest on a key trading pair signaled a massive influx of speculative capital.
High open interest acts as fuel for volatility. With so many leveraged contracts open, any sharp price movement can trigger the kind of cascading liquidations that were just witnessed. The record-breaking $44 billion in open positions meant the market was more susceptible than ever to a violent deleveraging event.
Part 4: The Big Players - A Tale of Two Whales
The recent market turmoil cannot be fully understood without examining the actions of its largest participants: the whales and institutions. Their movements often create the initial waves that retail traders are forced to navigate.
On the bearish side, the primary catalyst for the sell-off appears to be Galaxy Digital. The digital asset financial services firm was observed moving tens of thousands of Bitcoin, worth billions of dollars, to centralized exchanges. These flows were reportedly part of a larger liquidation of holdings from a dormant "Satoshi-era" whale, with Galaxy acting as the intermediary to facilitate the sale. By strategically offloading such a massive amount, even if through over-the-counter (OTC) desks to minimize initial impact, the sheer volume of sell pressure eventually spilled into the public markets, triggering the correction. The firm's subsequent withdrawal of over a billion dollars in stablecoins from exchanges further suggests a large-scale profit-taking or strategic de-risking maneuver.
However, this institutional selling pressure is contrasted by a powerful bullish undercurrent. Even as the market reeled, other large players were making bold, long-term bets. Reports surfaced of a significant whale bet on Bitcoin reaching a staggering $200,000 by the end of the year. This dichotomy highlights the deep division in market sentiment. While some large entities are taking profits or repositioning, others view this correction as a prime accumulation opportunity, demonstrating unwavering conviction in Bitcoin's long-term trajectory.
This clash of titans—the institutional seller and the long-term bullish whale—defines the current market structure. The price is caught in a tug-of-war between immediate, heavy supply and deep-pocketed, long-term demand.
Part 5: Reading the Tea Leaves - A Healthy Reset or the Start of a Bear Market?
While the headlines scream "bloodbath" and "crash," a deeper analysis of market mechanics and on-chain data offers a more nuanced perspective. Several key indicators suggest that this brutal pullback, while painful, may be a healthy reset rather than the beginning of a sustained bear market.
Argument 1: The Pullback Remains Within Normal Volatility Range
Bitcoin is notoriously volatile, and sharp corrections are a historical feature of its bull markets. Drawdowns of 30-40% have been common pit stops during previous bull runs. While a drop from over $120,000 to $115,000 is significant, analysts point out that such moves are not out of character for the asset. Historically, major cycle-ending bear markets have seen drawdowns exceeding 75-80%. In contrast, mid-cycle corrections serve to wipe out excess leverage, shake out weak hands, and build a more sustainable foundation for future growth. This event, though severe for leveraged traders, may fall into the category of a standard, albeit sharp, bull market correction.
Argument 2: A Necessary Liquidity Grab
Sophisticated market analysis suggests the plunge below $115,000 was a textbook liquidity grab. This is a maneuver, often initiated by large players or "smart money," where the price is intentionally pushed to a level where a high concentration of stop-loss and liquidation orders are known to exist. By triggering these sell orders, large buyers can absorb the resulting liquidity to fill their own large positions at more favorable prices before reversing the market direction. The area just below a key psychological level like $115,000 is a prime location for such a maneuver. The rapid dip followed by a stabilization could indicate that this was not a panic-driven crash, but a calculated move to hunt liquidity before the next leg up.
Argument 3: Bullish Signals from Spot Markets and On-Chain Data
While the derivatives market was in turmoil, other indicators flashed bullish signals. One analyst pointed to a strong correlation between surges in Binance's spot trading volume and subsequent price upswings. Recently, Binance's share of the spot market volume surged significantly, a move that has historically preceded rallies. High spot volume indicates genuine buying and selling activity, as opposed to the paper bets of the futures market, and can signal strong underlying demand.
Furthermore, key on-chain metrics suggest the long-term bullish scenario remains intact. Analysts highlighted that Bitcoin's price found support near the "Realized Price" for short-term holders, indicating that recent buyers were not panic-selling in large numbers. Other metrics, such as those showing that major long-term holders are retaining their assets despite record prices, paint a picture of underlying market strength that contrasts with the short-term speculative chaos.
Conclusion: A Market at a Crossroads
The dramatic plunge to $115,000 was a multifaceted event, a perfect storm of institutional profit-taking, extreme leverage, and the brutal mechanics of the crypto derivatives market. For the over-leveraged trader, it was a catastrophe. For the long-term investor, it may have been a fleeting opportunity.
The market now stands at a critical juncture, defined by conflicting forces. On one hand, the specter of institutional selling, exemplified by the Galaxy Digital offload, looms large. The record-high open interest, though slightly diminished after the liquidations, still represents a significant amount of leverage that could fuel further volatility.
On the other hand, the arguments for a bullish continuation are compelling. The idea that the crash was a calculated liquidity grab, the historical precedent for sharp bull market corrections, the strength in spot market volumes, and the conviction of long-term holders all suggest that the core uptrend is resilient. The whale betting on a $200,000 price by year-end serves as a potent symbol of this underlying confidence.
The coming weeks will be crucial in determining which of these forces will prevail. The battle between the short-term pressures of deleveraging and the long-term thesis of accumulation will be fought in the charts and on the blockchain. While the bloodbath for longs served as a stark reminder of the perils of leverage, it may have also been the violent, necessary purge required to cleanse the market and pave the way for a more sustainable ascent.
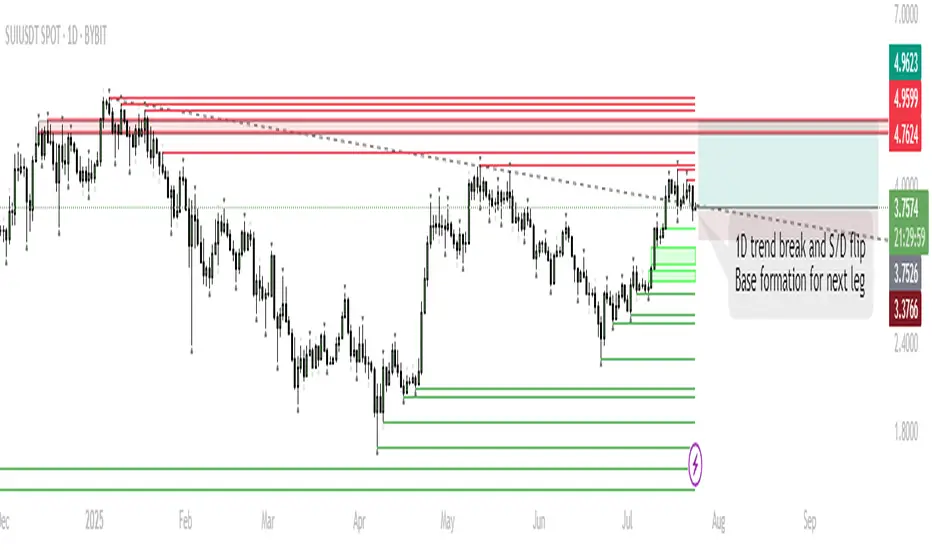
SUI – Base Formation for Next Leg HigherTrend Shift:
SUI has broken the 1D downtrend and is now consolidating above a key supply/demand zone, suggesting accumulation.
Short-Term Range:
Expect ranging/chop as price tests acceptance above broken resistance. This phase could last up to a week.
Trigger for Next Move:
Sustained closes above $4.0 will signal buyers are in control, opening the way for a move higher.
Targets:
If the base holds and SUI establishes above resistance, the next push is toward $5.10–$5.40 (previous highs/ATH zone).
Invalidation:
A sustained move below $3.37 would invalidate the bullish base thesis and open the door for deeper retrace.
SUI has flipped its 1D trend and is now consolidating above a key S/D level. Historically, such consolidations above reclaimed resistance often precede strong trend continuation. While a short-term range is likely as the market digests recent gains, the structure favors an eventual push toward previous highs and potentially new ATHs in August. Patience during this ranging phase is key; the setup remains bullish unless price falls back below $3.37.
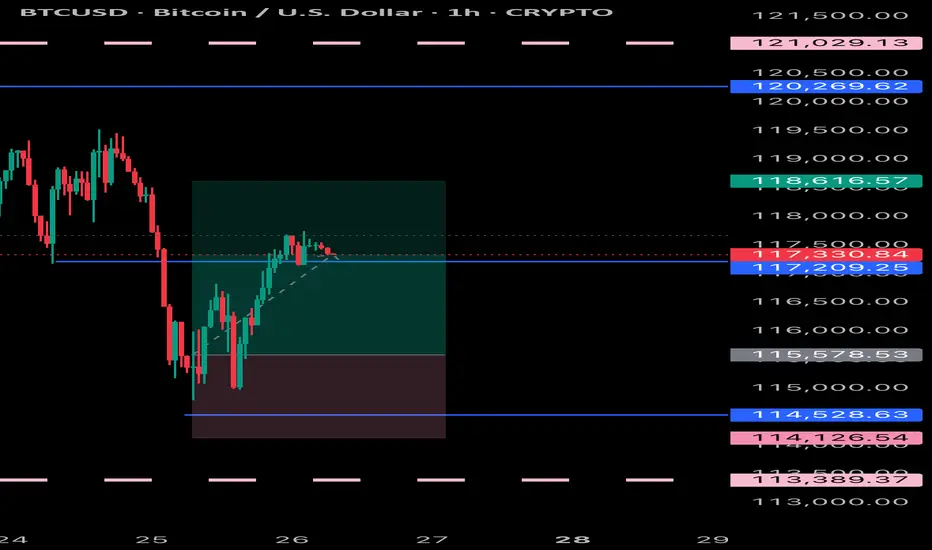
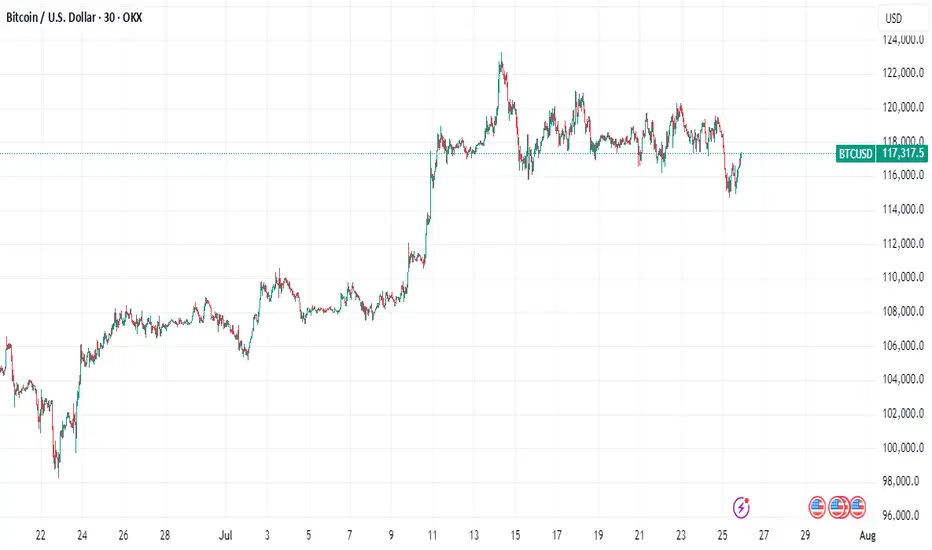
BTC Reloading for Breakout — Watching for 1H MSS Flip
BTC has bounced from local support (green zone) and is challenging the descending trendline.
The price is now testing the red resistance zone and the upper boundary of the 1H MSS (market structure shift) box.
Scenario A (Bullish):
— If BTC cleanly breaks the trendline and flips the 1H MSS box into support (with a strong close above), this is a trigger for a scalp long.
— Target for the move is the upper green box/previous high area near $122,000.
Scenario B (Bearish/Invalidation):
— If price is rejected at the red resistance and falls back below the green support box, risk of deeper pullback toward $116,000 increases.
BTC has shown resilience by quickly reclaiming support after a sweep lower, indicating strong demand. The market looks to be reloading for another push, with liquidity building up just below resistance. The setup favors a breakout if NY Open brings momentum. The flip of the 1H MSS box would confirm bullish intent. However, caution if the breakout fails — structure remains choppy and a failed breakout can trap late buyers.

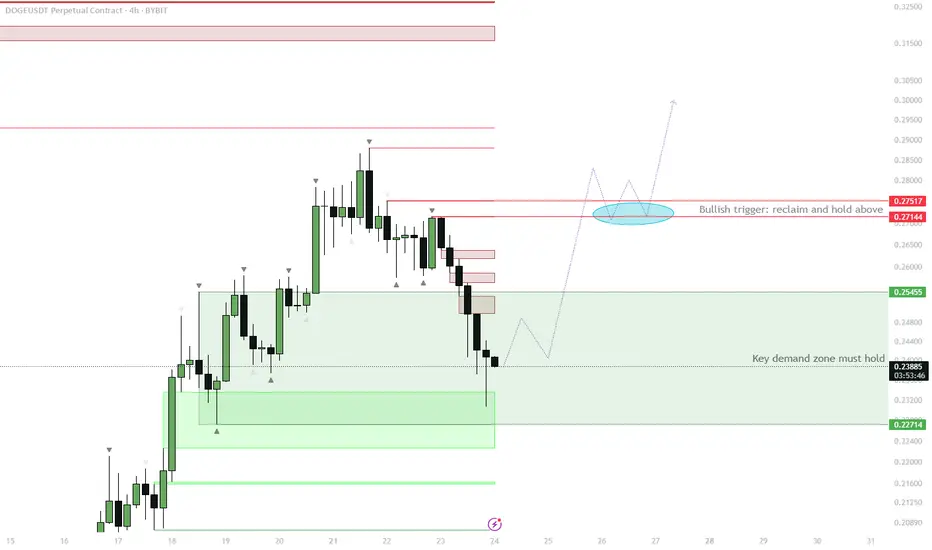
DOGE H4 – Demand Zone Reclaim as Bullish Trigger
Price is currently testing the H4 demand zone (~0.227–0.254).
Watch for price to reclaim the demand zone and close back above 0.254.
If confirmed, expect a move up toward the red resistance cluster at 0.271–0.275.
Consolidation above this area (highlighted in blue) would be a strong signal for continuation.
Invalidation: clean breakdown and acceptance below 0.227 signals failure of demand and deeper retrace.
This setup aims to capitalize on a classic liquidity sweep and demand reclaim. Typically, after taking out the flat open and collecting late shorts/stop losses, strong buying often steps in if demand is genuine. A successful reclaim and consolidation above the previous resistance will set the stage for bullish continuation. If this zone fails to hold, the move is invalidated and lower targets come into play. Waiting for confirmation reduces the risk of a failed bounce.