SBET – Holding the Key Zone for a Potential SqueezeSBET – Holding the Key Zone for a Potential Squeeze 🚀🔥
SBET is sitting at a critical support zone (21.0–21.3), right inside the 0.382 Fibonacci retracement. VolanX signals accumulation as volume cools down, setting up for a possible next leg higher.
Key Levels to Watch
Support: 21.0 – 21.3 (Fib 0.382 + structure base) 🛡️
Breakout Zone: 24.8 – 27.8 (Fib 0.5 – 0.618) ⚡
Targets: 33.0 – 36.0 🎯 | Long-term squeeze zone: 51.5 – 64.0 🏆
VolanX Signal
Bullish Bias: As long as 21 holds, liquidity favors upside.
Volume Clue: High spikes suggest prior distribution is cooling, potentially loading for a run.
Momentum Trigger: Close above 24.8 confirms buyers stepping in.
Risk Management
Stop-Loss: 20.4 (below structure) ⛔
Scale Strategy: Add on confirmation above 24.8 and 27.8 to ride the trend.
Profit Zones: 27.8 (TP1) → 33–36 (TP2) → 51+ (runner target).
Question: Are we seeing a base for another SBET explosion or just a pause before deeper discount?
#SBET #Fibonacci #VolanX #TradingView #BreakoutWatch #LiquidityFlow 🚀📊
SBET – VolanX Probabilistic Targets (1–3 week horizon)
For informational/educational purposes only. Not financial advice.
📈 Bullish Paths
P1: Bounce to 24.8–25.5 (Fib 0.5 / structure reclaim) → 58%
Trigger: 21.0–21.3 holds + momentum close above intraday VWAP.
P2: Extension to 27.8 (0.618) / first supply → 38%
Trigger: Clean acceptance >24.8 with rising volume & improving tape.
P3: Squeeze into 33–36 (0.786–0.886 + supply) → 24%
Trigger: Options/flow flip long (OTM calls clustering) + BOS over 27.8.
P4: Parabolic leg to 51.6–64.2 (1.382–1.786) → 10%
Trigger: Narrative + liquidity vacuum (low float + IV expansion).
(Probabilities are conditional—each higher target assumes confirmation of the one before it.)
📉 Bearish Paths
N1: Slip under 21 → 18.2–19.0 (0.309/discount shelf) → 27%
Trigger: Failure to defend 21 with increasing sell volume.
N2: Deeper flush to 16.6 (0.236) zone → 17%
Trigger: Persistent risk-off / liquidity drain, IV spike without demand.
N3: Capitulation toward 13.1 (0.146) / prior demand → 6%
Trigger: Macro shock or failed financing/newsflow, liquidity gap.
🧠 VolanX Read (today)
Bias slightly bullish as long as 21.0–21.3 holds. The engine scores Path P1 > P2 > N1. Expect chop → impulsive move once 24.8 is cleanly reclaimed or 20.4 is lost.
🛡️ Risk Management
Invalidation (swing): Daily close < 20.4.
Sizing: 0.5–1.0% account risk; micro-cap jump risk.
TP ladder: 24.8 ➜ 27.8 ➜ 33–36 ➜ leave runner for 51+.
Adjust: Move to BE after 24.8 reclaim; trail under last 4h HLs.
Beyond Technical Analysis

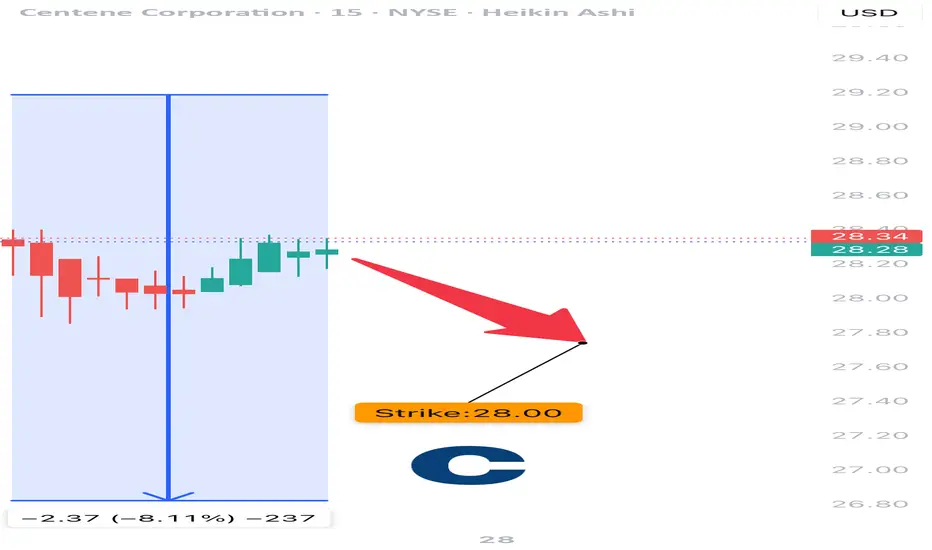
CNC EARNINGS TRADE IDEA – JULY 25, 2025
⚠️ CNC EARNINGS TRADE IDEA – JULY 25, 2025 ⚠️
💊 Healthcare Pressure + Missed Guidance = Bearish Setup for AMC
⸻
📉 Sentiment Snapshot:
• 🚨 Last quarter: Broke 100% beat streak
• 📉 Thin margins + rising medical costs
• 💬 Analyst bias: Neutral to Negative
• 🧮 Fundamentals Score: 4/10
⸻
📊 Technical Breakdown:
• 📍 Price: $26.76 (below 50DMA of $48.12)
• 📉 RSI: 32.4 = Oversold but still trending down
• 🛑 Testing 52W Low @ $26.25
• 🔻 Volume = 2.67x Avg → Heavy Distribution
⸻
🧠 Options Flow Insight:
• 🛡️ Heavy institutional put activity @ $28
• ⚠️ Weak call interest = bearish skew
• 📉 IV crush possible post-earnings
• Options Score: 6/10
⸻
🧬 MACRO CONTEXT:
• Rising sector costs crushing providers
• VIX < 15 = complacent market, sharp reactions possible
⸻
✅ TRADE IDEA:
🎯 CNC $28 PUT (0DTE)
💵 Entry: $0.20
🎯 Profit Target: $0.60 (3x 💥)
🛑 Stop Loss: $0.10
📅 Expiry: Today (July 25, 2025)
📈 Confidence: 70%
⏰ Entry Timing: Before earnings (AMC)
📆 Close trade within 2 hours post-earnings
⸻
📍 RISK REMINDER:
• Theta decay will be brutal if flat
• Watch for volatility and potential IV crush
• Ideal exit zone = stock retests $26 support
⸻
💡 Weak guide = collapse risk.
👍 Like & repost if you’re tracking CNC puts tonight!
#CNC #EarningsPlay #PutOptions #HealthcareStocks #OptionsTrading #0DTE #EarningsTrade #TradingView #SPX #GammaRisk
Gold remains in a bearish trendGold followed our previous analysis closely, rejecting from the strong resistance level at $3430, confirming bearish momentum. This rejection has opened the door for a potential move toward the 3400 level, and further downside is likely.
Gold remains in a bearish trend. A temporary pause or minor consolidation may occur, but the overall direction remains to the downside. This week, markets are watching the outcome of the ES–US agreement closely. If a resolution is reached, it could strengthen the USD and increase risk appetite—potentially pushing gold even lower.
We expect gold to remain under pressure unless major market sentiment shifts. A break below 3400 could accelerate the drop toward 3322.
You May find more details in the chart.
Ps Support with like and comments for better analysis Thanks.

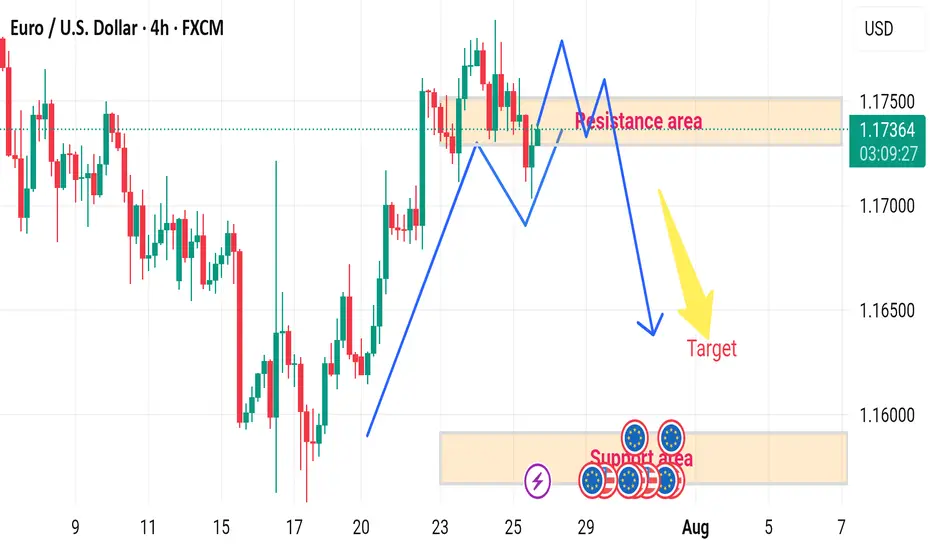
EUR/USD H4 DOWNWARD 🔄 Disrupted EUR/USD 4H Analysis
🟢 Current Context:
Price is currently at 1.17375, slightly below the resistance area (1.17400–1.17500).
Market shows a recent bullish impulse, followed by consolidation within the marked resistance zone.
Projection in the image suggests a double-top pattern forming at resistance, followed by a bearish reversal toward the target demand area (~1.15800–1.16000).
---
⚠️ Disruption Points:
1️⃣ Failed Double Top Scenario
Disruption Hypothesis: Instead of forming a clean double top and reversing, price may break above the resistance zone at 1.17500.
Reasoning: Strong bullish momentum and recent higher highs indicate potential for bullish continuation, invalidating the bearish target.
Disrupted Path: Price could break out → retest the resistance as new support → continue toward 1.18000–1.18300 zone.
2️⃣ Mid-Range Liquidity Trap
The current range may act as a liquidity trap:
Smart money could push the price slightly below support (fake breakdown), attract sellers, then reverse sharply upwards.
This would trap retail sellers targeting the 1.15800 zone.
"NZD/CAD Reversal Play – Ride the Bullish Wave!🦹♂️💰 "THE KIWI-LOONIE HEIST: High-Voltage Forex Robbery Plan (NZD/CAD)" 💰🦹♂️
🌍 Attention all Market Pirates, Thieves & Profit Bandits! 🌍
🔥 Thief Trading Alert – NZD/CAD Bullish Heist Setup! 🔥
The "Kiwi vs Loonie" is setting up for a high-risk, high-reward robbery—and we’re locking in the master plan. Long entry is the play, but this ain’t for the weak hands. Overbought? Consolidation? Reversal trap? Perfect. That’s where we strike.
🎯 THE HEIST BLUEPRINT
🔑 ENTRY ZONE (Breakout & Retest Strategy)
"Wait for the 4H candle to CLOSE ABOVE 0.82600 (MA Breakout + Retest)."
Option 1: Place a BUY STOP above the MA (momentum confirmation).
Option 2: BUY LIMIT near recent swing lows (15M/30M precision).
🚨 Set an ALERT! Don’t miss the breakout—timing is everything.
🛑 STOP LOSS (Escape Route)
SL at 0.82000 (near swing low wick on 4H).
⚠️ Golden Rule: NO ORDERS BEFORE BREAKOUT! Wait for confirmation.
Adjust SL based on your risk, lot size, and multi-order strategy.
🎯 TARGETS (Profit Escape Plan)
Take Profit 1: 0.83300 (First resistance).
Or… Exit Early if the market turns shaky.
Scalpers: Long-only scalp plays! Use trailing SL to lock in gains.
⚡ THIEF TRADER PRO TIPS
✅ Fundamental Backing: Check COT reports, macro trends, intermarket signals.
✅ News Alert: Avoid new trades during high-impact news—protect open positions with trailing stops.
✅ Risk Management: Small lots, multiple entries = smarter heist.
💥 BOOST THE HEIST! (Let’s Get Rich Together) 💥
👉 Smash that 👍 LIKE button to fuel our next robbery plan!
👉 Follow for daily high-voltage setups.
👉 Comment "🚀" if you’re joining the heist!
🤑 NEXT HEIST COMING SOON… STAY TUNED, BANDITS! 🤑
🔥 WHY THIS TRADE? (Thief’s Edge)
Bullish momentum but trapped bears = perfect robbery setup.
Institutional levels + retail traps = our opportunity.
Not financial advice—just a well-planned theft. 😉
⚠️ Warning: Trading = Risk. Only play with funds you can afford to lose.

Is Smart Money Selling Gold? A VSA LookHey Traders,
Let's take a look at the Gold (XAU/USD) 1-hour chart using Volume Spread Analysis (VSA). The price made a strong run-up to a new high around $3,438, but the volume is telling us a story of potential weakness.
Here’s a simple breakdown of what I'm seeing.
The Trap at the Top (Signs of Weakness)
Think of the market as being moved by "smart money" (professionals) and "herd money" (the crowd).
Climax Volume: See that huge volume spike right at the peak on July 23rd? While it looks like strong buying, this is often a classic sign of a Buying Climax. This is where smart money starts selling their positions to the excited crowd who are buying at the top, fearing they'll miss out.
No Real Buyers Left: After the peak, notice how the price tried to push higher a few times but on much lower volume? This is a "No Demand" signal. It’s like a car trying to rev its engine, but it's out of gas. It shows there isn't enough buying power to push the price any higher.
Sellers Take Control: As the price started to fall from the top, look at the volume on the down bars. It got bigger. This tells us that supply (selling pressure) is now in control, and they are pushing the price down with force.
Where Are We Now?
The price has dropped and is now hovering around the $3,330 area. The volume has dried up for now, which means the market is taking a pause and deciding where to go next.
What to Watch For Next
Based on the VSA story, here are two possible scenarios:
Scenario 1 (Bearish 📉): The weakness continues. If we see the price try to rally from here but the volume is very low, it would be another major red flag. It would suggest sellers are still in control, and we could see a break below the recent low of $3,320 for another leg down.
Scenario 2 (Bullish 📈): This is a bear trap. For this to happen, we would need to see a strong sign of buying returning. For example, a sharp drop on massive volume that is quickly bought back up. This would signal that the sellers have been absorbed and smart money is starting to buy again.
Conclusion:
For now, the evidence points more towards weakness. The action at the top suggests that smart money was distributing (selling) their gold.
Key Takeaway: Be cautious of any weak-looking bounces. The sellers appear to have the upper hand until we see a clear sign of strength with high buying volume.
This is not financial advice. This is just my interpretation of the chart using VSA. Always do your own research and manage your risk. Good luck trading!

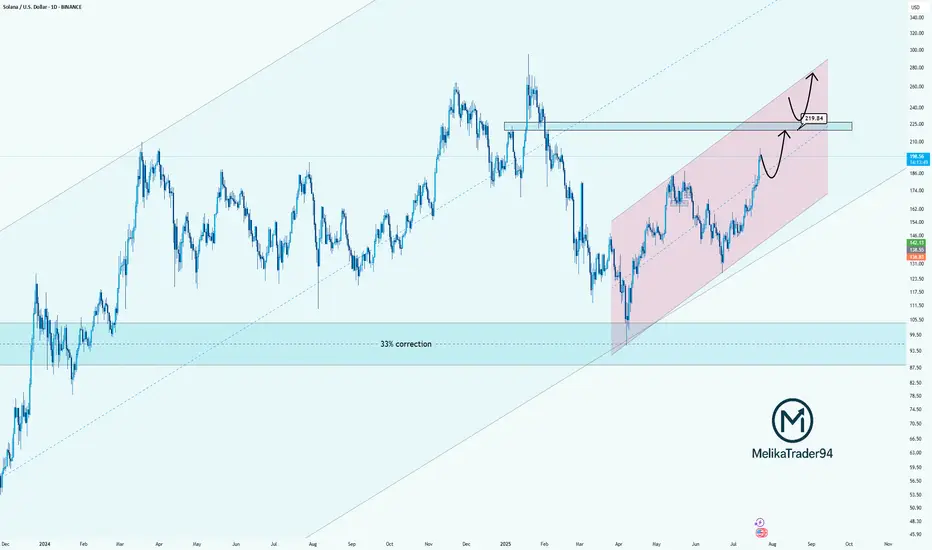
Solana Approaching Key Resistance: watch for $219Hello guys!
Solana has been trending strongly inside a rising parallel channel, recovering steadily after a significant 33% correction. The bullish momentum is clear, and the price is now approaching a key resistance zone near $219.84, which previously acted as a major turning point.
Here’s what I’m watching:
Strong uptrend within the pink channel shows controlled and healthy growth.
$219.84 is a critical decision zone. Price could:
React with a pullback before pushing higher,
Or break through it and flip the level into support for the next bullish leg.
The reaction in this zone will determine the next structure.
Whether we see a temporary correction or continuation to new highs.
SPX 0DTE TRADE IDEA – JULY 25, 2025
⚠️ SPX 0DTE TRADE IDEA – JULY 25, 2025 ⚠️
🔻 Bearish Bias with Weak Volume – Max Pain Looming at 6325
⸻
📊 Quick Market Snapshot:
• 💥 Price below VWAP
• 🧊 Weak Volume
• 📉 Max Pain @ 6325 = downside pressure
• ⚖️ Mixed Options Flow = no clear bullish conviction
⸻
🤖 Model Breakdown:
• Grok/xAI: ❌ No trade – weak momentum
• Claude/Anthropic: ✅ Bearish lean, favors PUTS near highs
• Gemini: 🟡 Slightly bullish bias, BUT agrees on caution
• Llama: ⚪ Neutral → No action
• DeepSeek: ❌ Bearish → No trade
⸻
📌 TRADE IDEA:
🎯 SPX 6365 PUT (0DTE)
💵 Entry Price: $0.90
🎯 Profit Target: $1.80 (💥 2x return)
🛑 Stop Loss: $0.45
📆 Expires: Today
🕒 Exit by: 3:45 PM
📈 Confidence: 65%
⏰ Entry Timing: OPEN
⸻
⚠️ Risk Flags:
• Low volume = fragile conviction
• Possible reversal if SPX breaks above session highs
• Max pain magnet at 6325 could limit gains or induce a bounce
⸻
🧠 Strategy:
Scalp it quick. Get in early. Exit before the gamma games explode into close.
📈 Like this setup? Drop a 🔽 if you’re playing puts today!
#SPX #0DTE #PutOptions #OptionsTrading #MaxPain #SPY #MarketGamma #TradingSetup

NVDA 0DTE TRADE SIGNAL – JULY 25, 2025
⚡ NVDA 0DTE TRADE SIGNAL – JULY 25, 2025 ⚡
🚀 Strong Bullish Momentum – But Friday Expiration = Gamma Trap?
⸻
📊 Market Stats:
• 💰 Call Volume: Strong
• 🔻 Weak Volume Overall
• ⚖️ Call/Put Ratio: Bullish
• 📈 RSI: Overbought but still pushing
• ⏳ Time Decay: Accelerating
• ☠️ Gamma Risk: 🔥 MAX today (0DTE)
⸻
🧠 Model Summary:
• Grok/xAI: 🔒 NO TRADE today – wait for Monday
• Claude: 🛑 Caution – avoid entries today
• DeepSeek: ⏸️ 4/5 Bullish, wait for cleaner setup
• Gemini: 💡 Suggests $180C next week
• Llama: ✅ Bullish bias, but gamma risk = no go for Friday
⸻
📌 TRADE IDEA: Wait for Monday
📍 Strike: $175 Call
📆 Expiry: Today (0DTE)
💵 Entry Price: $0.56
🎯 Target: $0.95
🛑 Stop: $0.30
📈 Confidence: 65%
🕒 Entry Timing: Monday open IF support holds
⸻
⚠️ Key Warning:
Don’t get trapped by 0DTE gamma swings. Momentum says yes, time decay says no…
✅ Best move? Watch NVDA closely, then strike on Monday if volume confirms.
⸻
👍 Like & save if you’re tracking NVDA.
🔁 Repost if you’re waiting for the perfect Monday setup!
#NVDA #OptionsTrading #0DTE #GammaRisk #BullishSetup #TradingView #TechStocks #WeeklyOptions

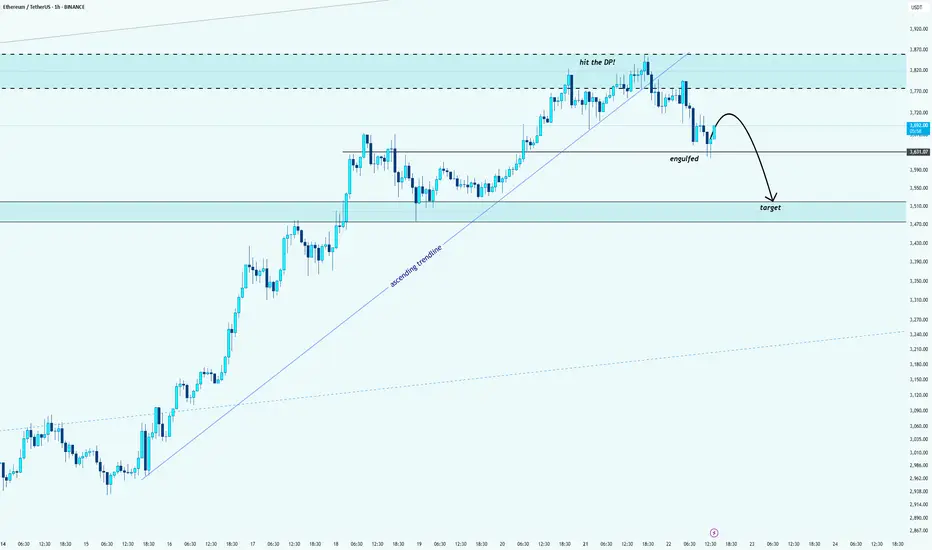
ETH/USDT: Bearish Reversal After Hitting the Decision PointHello guys!
After a strong rally, ETH finally hit the Decision Point (DP) zone marked above. Like what I said:
And we’ve already seen signs of rejection from that level.
🔹 The ascending trendline is broken
🔹 A key support got engulfed
🔹 Price is now forming a bearish structure
The target zone is mapped out around $3,500 – $3,470, where previous demand sits.
We might see a small pullback before continuation, but overall momentum is shifting downward.
Wait for confirmations and protect your capital
META WEEKLY TRADE SETUP – JULY 25, 2025
📈 META WEEKLY TRADE SETUP – JULY 25, 2025 📈
🔥 Institutional Bulls Are In Control — 3.05 C/P Ratio!
🚨 BUT — It’s 0DTE Friday, so don’t get caught in gamma fire.
⸻
🧠 Model Consensus:
✅ All Models = STRONG BULLISH
⚠️ Entry Timing: Monday preferred (due to gamma + time decay)
📉 Volume still weak = caution on conviction
⸻
🔍 META Flow Stats:
• 🟢 Calls: 65,379
• 🔴 Puts: 21,409
• 📊 C/P Ratio: 3.05 = Institutional bulls stepping in hard
⸻
✅ RECOMMENDED TRADE – PLAN FOR MONDAY
🎯 Instrument: META Call Option
🟢 Strike: $720
📅 Expiry: August 1, 2025
💵 Entry Price: $0.97
💰 Profit Target: $1.45
🛑 Stop Loss: $0.49
⚖️ Confidence: 75%
🕒 Entry Timing: Market open Monday
⸻
⚠️ TRADE NOTES:
• Don’t enter on Friday – too much gamma risk
• Wait for volume confirmation Monday morning
• Expect short-duration swing (hold 3–5 days max)
⸻
📊 Smart money is bullish, timing is everything.
👍 Like & Follow if META is on your radar!
#META #OptionsTrading #0DTE #GammaSqueeze #BullishSetup #TradingView #WeeklyOptions #TechStocks

GBP_USD LONG FROM SUPPORT|
✅GBP_USD has been falling recently
And the pair seems locally oversold
So as the pair is approaching
A horizontal support of 1.3399
Price growth is to be expected
LONG🚀
✅Like and subscribe to never miss a new idea!✅
Disclosure: I am part of Trade Nation's Influencer program and receive a monthly fee for using their TradingView charts in my analysis.

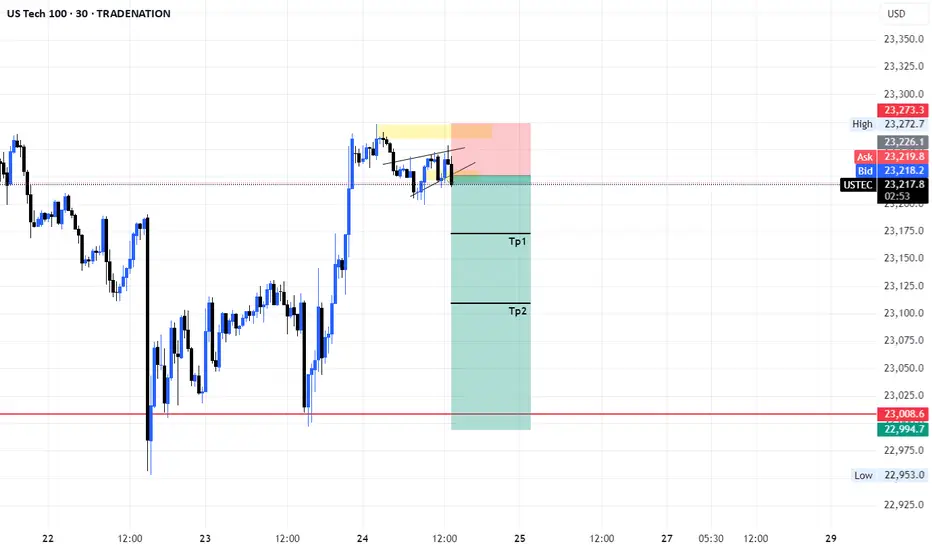
Us100 short position 24/07/2025English : According to our analysis, we anticipate a bearish scenario.
Morocan Darija : kanchofo d'apres l'analyse dyalna antsanaw hboot
ATENTION : I only share my ideas, not signals
Opening (IRA): IBIT Sept 19th 58 Covered Call... for a 56.05 debit.
Comments: Selling the -75 delta call against shares to emulate the delta metrics of a +25 delta short put to take advantage of higher IV on the call side and the built-in defense of the short call.
Metrics:
Buying Power Effect/Break Even: 56.05
Max Profit: 1.95
ROC at Max: 3.48%
50% Max: .98
ROC at 50% Max: 1.74%
Will generally look to take profit at 50% max, add at intervals assuming I can get in at break evens better than what I have on.
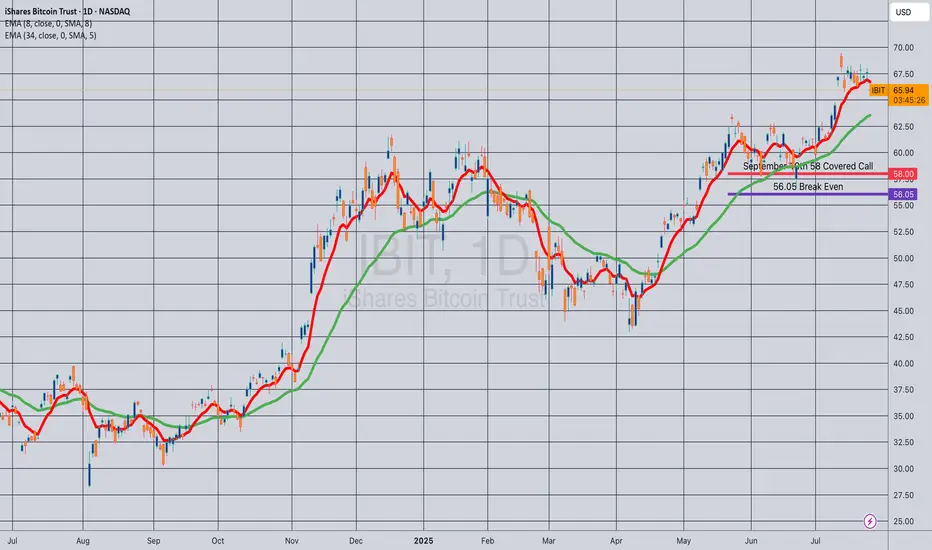
Next Volatility Period: Around August 21
Hello, traders.
Please "Follow" to get the latest information quickly.
Have a nice day today.
-------------------------------------
#TSLA
We need to see if it is rising along the rising channel.
The key is whether it can rise with support near 311.48 to break out of the downtrend line.
The key is whether it can rise along the short-term uptrend line and break through the short-term downtrend line after passing through this volatility period around July 25.
Therefore, we need to see whether it can rise above the 347.21-382.40 range with support near 311.48.
The next volatility period is expected to be around August 21.
-
The important thing is to maintain the price above the M-Signal indicator on the 1M chart.
If not, there is a possibility of a long-term downtrend.
Therefore, if it shows support in the 268.07-311.48 range, it is a time to buy.
-
Thank you for reading to the end.
I hope you have a successful trade.
--------------------------------------------------

5 Lessons from My First 100 TradesAfter executing and reviewing over 100 real trades in crypto, forex, and gold — I found patterns. Bad patterns. Repeating mistakes. And lessons I wish someone had told me earlier.
So I broke them down into 5 key insights that changed how I trade — and might just save you thousands.
📘 Here’s what’s inside:
1️⃣ Smart Profit-Taking:
How I turned 10 R/R into 32 R/R using a dynamic exit plan.
📘Further resource:
Cycle Mastery (HWC/MWC/LWC)
---
Multi-Timeframe Mastery
2️⃣ The Sleep Edge:
70% of my losing trades happened after bad sleep. Here’s why that matters more than emotions.
3️⃣ No More Blind Stop Orders:
Why I stopped using buy/sell stops without real candle confirmation — and what I do instead.
📘 Further reading:
Breakout Trading Mastery
---
Indecision Candle Strategy
4️⃣ Multi-Layered Setups Win:
How structure, S/R, patterns, and timing stack into high-probability entries.
5️⃣ News Trading? Just Don’t.
The data behind why most of my SLs were hit near news time — and how I avoid the trap.
💡 These aren’t theories. These are real lessons from real trades.
If this video helped you or sparked an “aha” moment, give it a boost, commenting your takeaway, and sharing it with a fellow trader.
lets grow together :)

I'm optymist. 1.183-1.185 In front us3 year channel saying that we should to touch it.
Yellow line.
Before us
In my opinion before us is level. 1.18-1.20 before bigger correction until 1.12 even.
Then in few month i see 1.4-1.6

RUT Echoes IWM – The Livermore Playbook?The Russell 2000 (RUT) is painting a structure that mirrors the IWM ETF – a widening accumulation channel, setting up for a potential breakout. The VolanX protocol flags this as a classic Livermore Speculative Chart pattern, where phases of quiet accumulation lead to an explosive markup.
Channel Support: ~2,245 is holding as the battleground for bulls.
Short-Term Projection: Expect a possible ping-pong move between 2,260 – 2,300 before the real momentum ignites.
Breakout Level: Above 2,310, the price could rip toward 2,390–2,400 (Livermore’s “point 10” territory).
VolanX suggests that this structure is not random – IWM and RUT are moving in tandem, with mid-cap risk appetite quietly building. If liquidity inflows continue, this setup could fuel a sharp vertical rally into August.
"Are you seeing the same Livermore-style accumulation in IWM as VolanX does?"
#RUT #IWM #VolanX #Livermore #Accumulation #BreakoutWatch #TradingView

High-Stakes GBP/AUD Short Plan – Grab the Bag & Escape Early!💥🔥GBP/AUD HEIST OPERATION: The Pound vs Aussie Bear Trap Masterplan 🔥💥
(Thief Trader Exclusive TradingView Drop – Smash Boost If You’re Ready To Rob The Market!)
🌍 Hi! Hola! Ola! Bonjour! Hallo! Marhaba! 🌍
Welcome, Money Makers & Market Robbers! 🤑💰✈️
This isn't just analysis — it's a high-stakes forex heist, engineered using Thief Trading Style's elite blend of technical, macro, sentiment, and quantitative insights. We're cracking the GBP/AUD vault with sharp bearish setups targeting a major liquidity zone — aka the Police Barricade Support Area! 🚨🔫
📉 Plan of Attack – Short Entry Setup
This isn’t your typical chart — this is blueprint-grade precision. Here's the GBP/AUD short strategy for Day & Swing Traders:
🚪 ENTRY ZONE
Initiate bearish positions at or near recent highs (wick level).
Use limit orders stacked (layering/DCA style) on the 15m or 30m retest zones for sniper entries.
Look for wicks with rejection — that’s where the fake bullish robbers get trapped!
🛑 STOP LOSS
Place SL just above recent 4H swing highs (2.06100 as a reference).
Adjust according to position size and the number of orders you’re layering.
🎯 TARGET ZONE
Aim for 2.02500, or book partial profits earlier if the heist gets heat.
Escape before the alarms ring! Secure the bag and vanish like a pro.
🔍Fundamental & Sentiment Heist Intel 📚
This bearish pressure on GBP/AUD isn’t random — it’s triggered by a perfect storm:
COT Positioning flips 📊
Aussie strength from commodities & RBA commentary 📈
GBP uncertainty from macro tightening & economic data ⚖️
Sentiment exhaustion at highs + false bullish trap 📉
Consolidation zone breakdown = smart money move! 💼
Wanna go deep? 🧠
Tap into COT, Macro Trends, Intermarket Analysis & Thief’s proprietary scoreboardsss 📡🔗
⚠️ News & Position Management Alert 🚧
📰 Avoid entry around key news drops
🔒 Lock in profits with trailing SL
💼 Secure capital > Chase greed
🔥 SHOW SOME LOVE 🔥
💖 Smash that ❤️ BOOST button — it powers our next big heist!
Together, we rob the market with style, skill, and precision.
See you on the next breakout robbery mission, legends!
Stay dangerous. Stay profitable. Stay Thief. 🐱👤💵🚀

link buy midterm"🌟 Welcome to Golden Candle! 🌟
We're a team of 📈 passionate traders 📉 who love sharing our 🔍 technical analysis insights 🔎 with the TradingView community. 🌎
Our goal is to provide 💡 valuable perspectives 💡 on market trends and patterns, but 🚫 please note that our analyses are not intended as buy or sell recommendations. 🚫
Instead, they reflect our own 💭 personal attitudes and thoughts. 💭
Follow along and 📚 learn 📚 from our analyses! 📊💡"

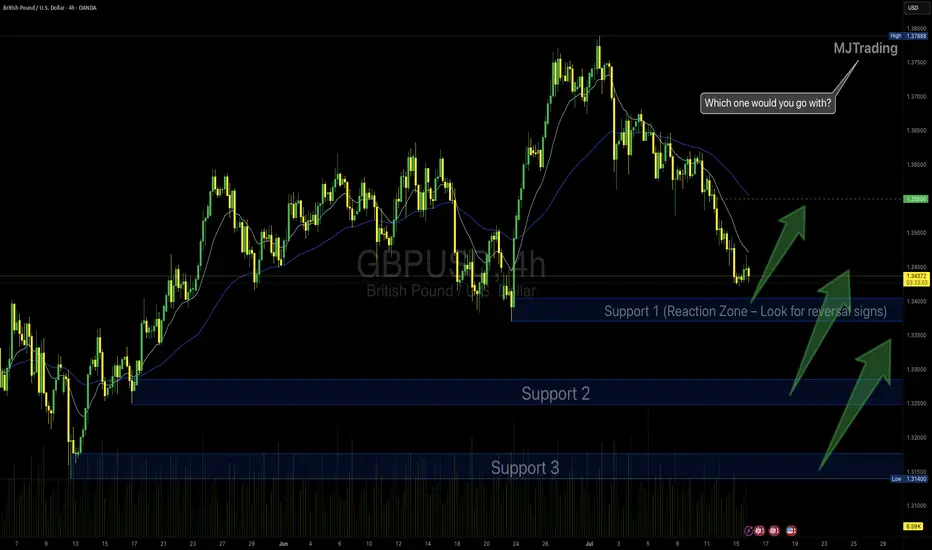
GBPUSD Idea – Demand Zones & Potential Reversal Play🧠 MJTrading:
After a steady downtrend, GBPUSD is now approaching a strong 4H demand zone (Support 1), where we previously saw explosive bullish reactions.
Price is also extended from both EMAs, showing potential for a technical pullback or full reversal.
💡Scenarios to consider:
🔹 If Support 1 holds → we may see a bounce toward 1.3500+
🔹 If broken → Support 2 & 3 offer deeper liquidity and high-probability demand zones
👀 Watch for:
Bullish reversal candles (engulfing / hammer)
Bullish divergence on lower timeframes
Volume spikes on reaction
⚠️ Invalidation:
If Support 3 breaks with strong momentum, we might enter a bearish continuation phase.
#GBPUSD #Forex #ChartDesigner #SmartMoney #PriceAction #MJTrading #ForexSetup #TrendReversal #SupportZones