BTCUSDT - going to 113866.19$My analysis is based on numerology, all the numbers you see on the chart are from the same place. There is a certain numerological symbolism, which tells me that the price has already put the bottom 49(13) and will make a reversal from the zone 52260+- and then will fly strongly upwards with the target first 89k bucks, and after 113k. It's time to look for a good entry point.
Beyond Technical Analysis

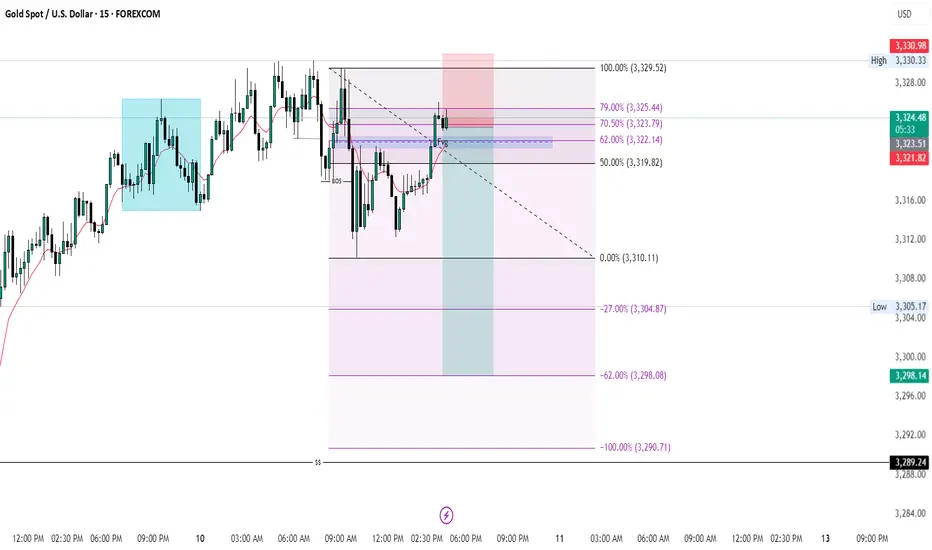
XAUUSD SELLWe had a market structure shift (MSS) followed by a break of structure (BOS), then a second BOS that triggered a retracement into the Fibonacci Optimal Trade Entry (OTE) level, forming a swing high — an ideal setup to go short.
AUDCAD Holding at Support – Possible Move UpAUDCAD seems to be sitting on a strong support level. From this point, I think the price could start moving up. If buyers come in, we might see the market go higher in the next few days.

AUD_CAD WILL KEEP GROWING|LONG|
✅AUD_CAD is going up
Now and the pair made a bullish
Breakout of the key horizontal
Level of 0.8980 and the breakout
Is confirmed so we are bullish
Biased and we will be expecting
A further bullish move up
LONG🚀
✅Like and subscribe to never miss a new idea!✅
Disclosure: I am part of Trade Nation's Influencer program and receive a monthly fee for using their TradingView charts in my analysis.

XAUUSD ShortMarket Structure
• Price has formed a clear lower high structure following the peak near 3360–3365.
• Subsequent highs (highlighted in blue circles) show consistent failure to break previous highs, indicating bearish momentum.
• The price is currently reacting from a well-defined supply zone (red box near 3325–3330), where selling pressure previously emerged.
Key Resistance Zones
• 3325–3330: This supply zone has held strong multiple times. Price failed to break above this area during the latest retest.
• 3340–3345: Previous support turned resistance, also aligns with a prior lower high.
• 3360–3365: Major resistance and recent swing high (bearish market invalidation point).
Support Zones to Target
• 3305.475: Minor support; price could consolidate here before further drop.
• 3280–3285: Key demand zone where price previously bounced.
• 3263.855: Major support level and likely final target in the short term if bearish move continues.
Confluences Supporting a Sell
• Series of lower highs (bearish structure).
• Strong supply zone rejection.
• Bearish engulfing candles around resistance.
• Clean liquidity sweep above prior highs followed by sharp rejections.
• Arrow on chart suggesting bearish projection.
Risk Consideration
• A break and strong close above 3335 would invalidate this bearish setup.
• Watch out for possible whipsaw behavior around 3305 zone before continuation.

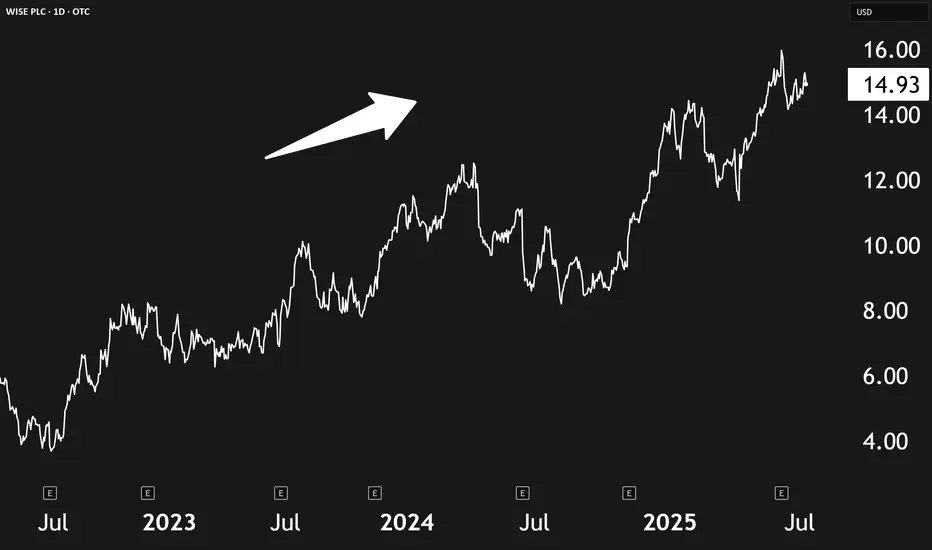
Wise Is Poised To Capture A Multi-Trillion Dollar OpportunityA few months back, we highlighted key investment trends for the next decade—among them, cross-border finance and fintech disruption. Now, Wise plc OTC:WIZEY , a British fintech leader, is showing strong alignment with both themes, and it may soon benefit from even more investor attention as it plans to move its listing from the UK to the U.S.
🌍 What Wise Does
Wise offers low-cost, tech-driven cross-border payment services. Rather than sending money physically across borders, it uses a network of local money transfer entities to settle transactions locally. This allows the company to avoid high bank fees and offer fast, affordable currency exchanges. Currently, 65% of its international payments are settled instantly, and 95% are completed within 24 hours.
Its infrastructure, built over the past decade, gives Wise a strong moat—few competitors can replicate its speed and pricing. The company also offers personal and business multi-currency accounts, a debit card, and an investing feature called "Wise Assets." Additionally, Wise licenses its payment rails to institutions like Morgan Stanley and Monzo, creating another layer of growth potential.
📈 Financials & Growth
Wise has seen explosive growth:
- Revenue has more than tripled since 2021.
- Profits are up 7.2x during the same period.
- Active users, transfers, and customer balances are all climbing steadily.
Management expects mid-teens growth in both revenue and profits, though we see this as conservative given Wise’s network effects.
💰 Valuation & U.S. Relisting Potential
Currently valued at ~$17.8 billion with a P/E of ~24.7x, Wise trades more cheaply than many U.S. fintech peers. If EBIT projections hold—$900M in 2026 and $1.1B in 2027—the multiple could compress to ~17x, making it even more attractive.
Relisting in the U.S. could spark multiple expansion as it gains visibility and liquidity among U.S. investors. Wise trades at about 5x sales today; even a modest bump closer to 10x could signal major upside.
⚠️ Risks to Watch
Low U.S. liquidity: Shares currently trade over-the-counter under WIZEY, which comes with low volume and potential slippage.
Emerging competitors: Rivals like Remitly (RELY) are growing.
Security risks: Any breaches, like the one it faced years ago, could damage trust.
✅ Final Take
Wise stands out as a rare combination of profitability, growth, and competitive edge in a massive, underpenetrated market. With a planned U.S. relisting and strong financials, it’s well-positioned for continued upside.
Rating: Strong Buy
ServiceNow Is Our Top Tech Compounder PickIn a tech world often driven by hype and speculation, ServiceNow NYSE:NOW stands out as a reliable growth engine—a true compounder. Unlike flashier tech names, ServiceNow delivers steady revenue growth and expanding margins, all while offering mission-critical software to businesses.
📈 What’s a Compounder, Anyway?
Compounders are companies that grow steadily over time by reinvesting profits at high returns. They may not make headlines, but they consistently outperform by:
- Growing demand for their shares
- Reducing share supply (or keeping dilution low)
These are the businesses long-term investors love: predictable, resilient, and scalable.
🧩 Why ServiceNow Fits the Bill
ServiceNow has quietly built a powerful B2B software business, helping organizations streamline operations. Here’s why it qualifies as a compounder:
Strong Revenue Growth: From $3.3B in 2020 to $11.4B today
Rapid Profit Growth: Net income jumped from $34M to $1.54B in the same period
Operating Leverage: Margins have grown from 3.4% to 13.2%, thanks to stable 80%+ gross margins and low incremental costs
Recurring subscription revenue is rising fast—up 20% YoY—driven by the mission-critical nature of its software and increasing AI capabilities.
💸 The Valuation Case
Although many quant models give NOW a weak grade for valuation, context matters. Historically, the stock is trading in the middle of its typical range—about 18x sales and 58x free cash flow.
Looking ahead:
Analysts forecast 20% annual EPS growth through 2027
That implies a forward P/E of 42x, with potential to drop further as margins expand
Combine that with AI-powered upselling and potential share buybacks, and NOW’s valuation starts to look compelling.
⚠️ Risks to Watch
Premium Price Tag: If markets decline, richly valued stocks like NOW could fall harder
Tough Competition: Rivals like Salesforce and Palantir are aggressively chasing similar markets
✅ Bottom Line
ServiceNow may not be flashy, but its financial performance, recurring revenue model, and growth runway make it a solid long-term bet. If management reins in share dilution and continues margin expansion, this stock could deliver serious compounding over the next decade.
Rating: Buy

1INCH ANALYSIS🔮 #1INCH Analysis 🚀🚀
💲💲 #1INCH was trading in a Descending Broadening Wedge Pattern, give a perfect breakout and will retests the levels. If the price of #1INCH sustains the breakout then we will see a bullish move. 📈📈
💸Current Price -- $0.2220
📈Target Price -- $0.2510
⁉️ What to do?
- We have marked crucial levels in the chart . We can trade according to the chart and make some profits. 🚀💸
🏷Remember, the crypto market is dynamic in nature and changes rapidly, so always use stop loss and take proper knowledge before investments.
#1INCH #Cryptocurrency #Breakout #DYOR

Crypto at All Time Highs! But...Last month I shared a chart of an equal-weight crypto basket suggesting crypto may be on the cusp of fresh All Time Highs -- those highs have arrived! While that is certainly exciting for crypto holders one should take note of other aspects of the rally.
The US Dollar has depreciated substantially against foreign currencies this year (2025)
Bitcoin has yet to reach a fresh high against Gold
Bitcoin is strongly correlated to US equities, which are also at all time highs
USD Decline
The US Dollar is down a whopping 10% against a basket of foreign currencies this year, lead ostensibly by President Trump's raucous political policies, most notably aggressive tariffs across the globe and industries. The crypto rally therefore could be characterized as more of a Dollar softening than a crypto strengthening.
Bitcoin v Gold
Bitcoin - still the epicenter of all things crypto has not topped Gold.
Gold in fact has been on a heater of late against the Dollar.
Many folks still regard Gold as "real money". As such crypto could be said to be in a "stealth bear market", especially considering the declining momentum against Gold while failing to match its highs.
Bitcoin v Stocks
Bitcoin is also strongly correlated to US equity performance, despite claims that it's a hedge. The correlation has only grown stronger as Bitcoin's price against the Dollar has soared.
That said, it does consistently outperform equities, as long as the music is still playing!
Closing Thoughts
Most people likely don't care about how Bitcoin is faring against Gold. Bitcoin, the highest quality form of crypto is itself still highly speculative. While an equal-weight basket of cryptos is impressively reaching an all time high against the Dollar, coins with smaller market caps will surely be the first to go when this speculative impulse subsides.
There's probably still some gas in the tank at this point, but now is a good time to consider trimming positions before you miss the chance 🤑

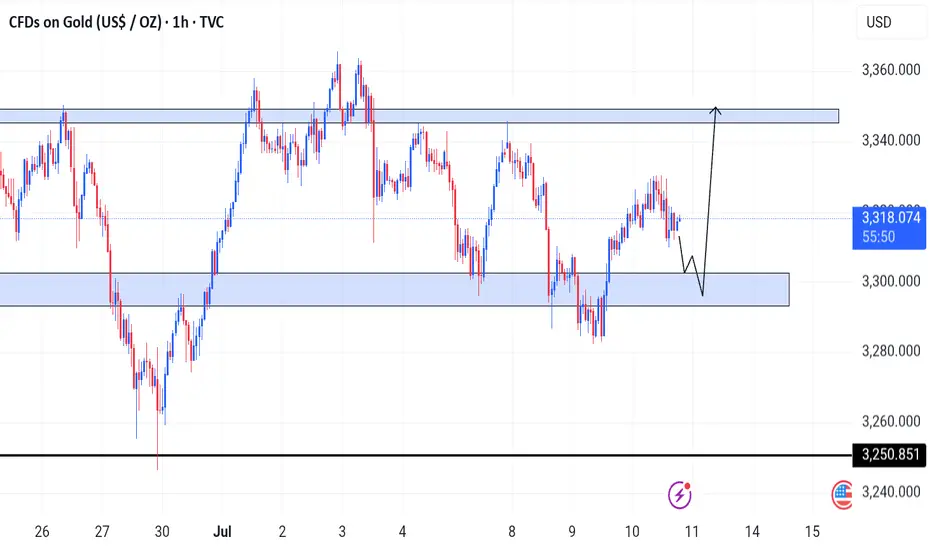
technical analysis -xau/usd 1 hr time frame 📊 Technical Analysis – XAU/USD (Gold/USD) – 1-Hour Timeframe
🔁 Market Structure:
The overall recent trend has been bearish, but at the latest low, the market has shown signs of a Change of Character (CHoCH).
Multiple Breaks of Structure (BOS) to the downside occurred earlier, but the current price action suggests a potential reversal or a bullish correction.
🟩 Demand Zone:
The green box near the bottom highlights a strong demand zone.
Price has already reacted positively from this area, which aligns with previous consolidation levels and support zones.
🟪 Entry Zone & Stop Loss:
Purple box: ideal entry zone for a potential long position (around $3,305–$3,315).
Red/Brown box below: logical stop loss area, placed below the most recent low (~$3,245).
🎯 Target Zone:
The green box at the top indicates the potential target zone, extending toward $3,450–$3,460.
This aligns with previous swing highs and structural resistance levels.
✅ Trade Setup:
Component Details
Entry ~$3,305–$3,315
Stop Loss Below $3,245
Targets TP1: $3,360 / TP2: $3,420 / TP3: $3,450+
Risk-Reward Approx. 3:1 or better
This setup becomes more valid with further confirmation in lower timeframes (e.g., 5min or 15min), such as bullish engulfing candles or internal structure shifts.
❌ Invalidation:
If price closes below $3,245 and confirms bearish continuation, the long setup becomes invalid.
In that case, it’s best to wait for a new structure or new demand zone to form.
📌 Summary:
Gold has reacted strongly from a key demand zone.
Structure is shifting bullish; if confirmed, this offers a solid low-risk, high-reward opportunity.
Wait for confirmation before entering, and always apply risk management.
⚠️ Disclaimer:
This analysis reflects only my personal view of the market and is not financial advice.
Please perform your own analysis and apply proper risk management before taking any trades.
FOREXCOM:XAUUSD

USDCAD IS BULLISHAll i see is a change to the upside that will act as an exhaustion phase then when it mitigitates the supply zone the bearish signals might be formed.
I will see how it goes ...
HappY TrAdINg

Gold longsTVC:GOLD price is approaching a support level forming a H&S Patten, giving us an insight that bulls are most likely to take over pro price. What are your predictions traders? Let me know on the comment session.
SP500 Bullish Momentum Amid Trade DevelopmentsThe US stock index continues to trade higher as overall market sentiment remains bullish, driven by optimism despite Donald Trump's aggressive tariff stance and ongoing global trade negotiations.
Currently, the index is consolidating within a narrow range around 6260. A confirmed breakout from this zone is essential to determine the next directional move. then Upside Target will be :6,250 and 6,300
If you like this idea if you Have on Opinion about this analysis share in comments.

Opportunities Arise from Dollar WeaknessSince the dollar peaked in 2022, it has declined by 24%.
Such a decline may not seem significant for a stock, it’s a different story when it comes to currencies, especially a reserve currency for USD. US purchasing power has dropped by a quarter, meaning they will now have to pay 24% more for imports from EU.
However, the decline in the USD also presents opportunities in other markets.
Mirco EUR/USD Futures
Ticker: M6E
Minimum fluctuation:
0.0001 per euro = $1.25
Disclaimer:
• What presented here is not a recommendation, please consult your licensed broker.
• Our mission is to create lateral thinking skills for every investor and trader, knowing when to take a calculated risk with market uncertainty and a bolder risk when opportunity arises.
CME Real-time Market Data help identify trading set-ups in real-time and express my market views. If you have futures in your trading portfolio, you can check out on CME Group data plans available that suit your trading needs www.tradingview.com

Nasdaq leads the rally and can move for 3-5 days moreWhile crude oil is declining, tech stocks are gaining momentum: Nasdaq had reached another all-time-high recently and that might not be over: according to statistical studies, it rarely reverses quickly above the upper Bollinger Bands line and the average swing duration is between 17 and 20 days (which gives us several days of potential continuation).
The earnings season fuels growth for many technological stocks, and the “sell America” narrative steps back, so we may see Nasdaq growing as shown in the chart below.
Don't forget - this is just the idea, always do your own reserch and never forget to manage your risk!

Complet the Day Trading Game of 9 JULY 2025Something that i missed it :-
1-CISD
2-ifvg
3-Ob
4-fvg
thank you

BTCUSDT – The Liquidity Mirage: This Pump Is a Setup!Chart Type: BTCUSDT | 1D & 8H Analysis
Status: Live Reversal Setup | FOMO Trap Triggered
⸻
🧠 Overview:
What looks like a breakout is actually a trap. This pump has violated key sniper rules:
• No reactive volume confirmation
• No structure retest
• Triggered FOMO entries at the highs
• TP booked by whales while retail enters late
Instead of continuation, BTC is setting up for a controlled distribution dump.
⸻
🔍 Sniper Observations:
Component Kaizen Verdict
Volume >> ❌ Weak → No relative confirmation
RSI >> ⚠️ Flat → Bearish Divergence Expected
Structure. >> ❌ No retest or reclaim → Just exhaustion
FOMO Activity >> ✅ High → Clear Retail Entry Trap
Liquidity Above >> ✅ Filled → Nothing left to chase
Whale Behavior >> ✅ TP Booked → Exit has begun
⸻
💣 Liquidity Cloud Mapping:
112,000–114,000 = Retail Exhaustion Zone
✅ TP Booked
✅ FOMO Entry Triggered
✅ Liquidity Grab Completed
108,000 = First Profit Zone (TP1)
Institutional cluster > Buy-back likely
105,000 = Final Target Zone (TP2)
Reversal + SL stack of FOMO longs
93,000–95,000 = Full Trap Unwind
Bonus TP for deep reversal setups
⸻
🎯 Short Plan
(Live Deployment Ready)
Component Value
Entry Zone | 🔫 112,450 – 113,000
Stop Loss | 🛡️ 114,050 (Above fake breakout wick)
Take Profit 1 | 🎯 108,092
Take Profit 2 | 🎯 105,175 (Retail Flush & Whale Reload)
Bonus TP | 🎯 93,218 (Full exhaustion if volume spike appears)
Leverage | ⚔️ 3x–5x recommended for precision swing short
Position Type | 🧠 Swing short / Trap Reversal
⸻
🔑 Trigger Confirmation Before Entry:
1. ✅ 4H Candle Rejection from 112,450+ zone
2. ✅ Divergence in Volume (Price ↑ but volume ↓)
3. ✅ Momentum Fade on RSI or OBV
4. ✅ Spoof walls appear above 112,700 (signs of artificial sell pressure)
⸻
🧠 Why This Trade Works:
• Retail just entered at highs after seeing “confirmed breakout”
• Whales already exited at 112K+
• Market requires fuel for reversal = Retail SLs + Exit Liquidity
• Volume does NOT support real continuation
• Price will trap both bulls & late shorts before true reversal triggers
⸻
🚨 Risk Warning:
If BTC closes above 114,000 with sustained volume AND retests that level, the setup invalidates.
Don’t hold a sniper entry into strength. This is a precision trap entry, not a momentum chase.
⸻
📢 Final Note:
“The most profitable trades come when the crowd is silent, and the volume is fake. This is one of those setups — you’re not late. You’re right on time.”

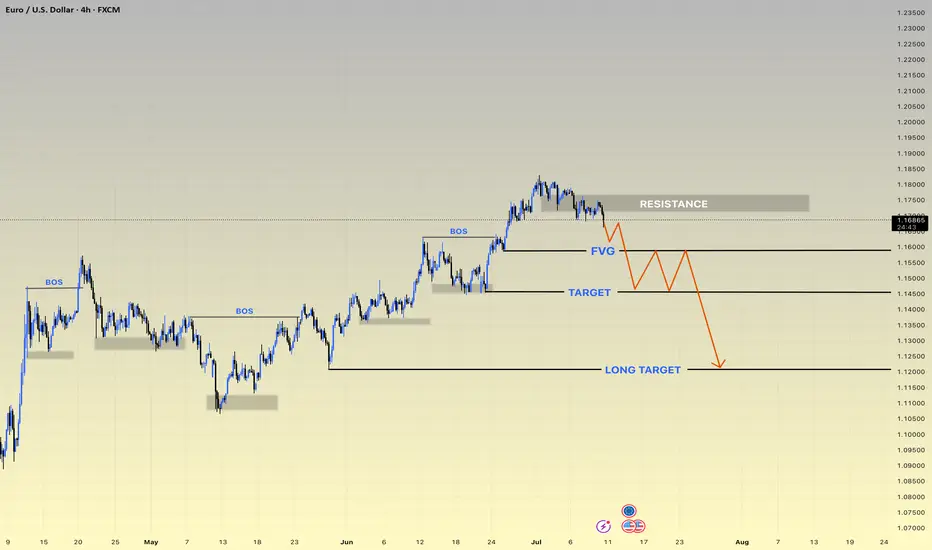
EURUSD h4 update ⚠️ Current Outlook: Reversal Zone Hit
• Price tapped into the strong RESISTANCE zone (~1.1800), failing to break higher.
• Market structure BOS (Break of Structure) confirms bearish intent.
• FVG (Fair Value Gap) likely to act as a short-term liquidity trap.
📍 Disrupted Bearish Flow:
1. Price rejects resistance aggressively ✅
2. Pullback into FVG may trigger a liquidity hunt 🧲
3. Fake bounce → Smart Money re-entry expected 👀
4. Target levels:
• 🥅 TARGET: 1.1550 zone (first major support)
• 🎯 LONG TARGET: 1.1200 zone (high probability zone for HTF buyers)
🔁 Bear Trap Setup Possibility:
• After hitting the LONG TARGET, price could reverse sharply.
• Watch for accumulation signs and deviation below key levels.
⸻
🔥 Key Zones to Watch:
• 🔳 Resistance: 1.1790–1.1820
• 🟦 FVG Retest Zone: 1.1630–1.1660
• 📉 Target Zone: 1.1500–1.1550
• 🚨 Long-Term Demand Zone: 1.1180–1.123
Wyckoff Pattern- To understand trading at its core, you need to understand the Wyckoff Theory.
- Everything you need is in the chart and yes, it's simple and might look like copy-paste, but it's pure Wyckoff.
- Remember this post i made in 2021 ? check it again :
Remember, trading is like a washing machine, it shakes you up, spins you around, and pressures you to sell when you should be buying or Holding.
Not a price prediction, just a smarter way to level up your strategy.
Happy Tr4Ding !

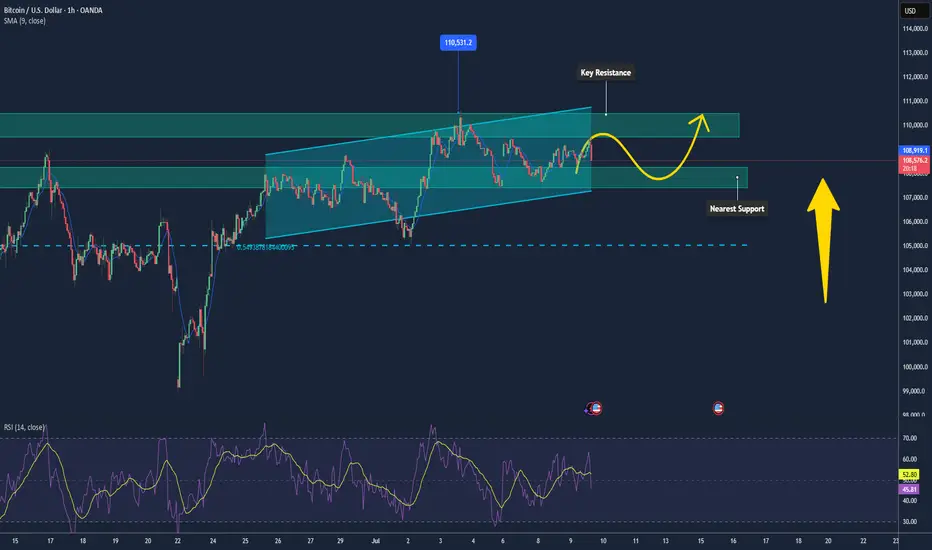
Bitcoin Maintaining Mild Uptrend, Poised Toward $110k📊 Market Overview:
• Strong ETF inflows continue, with over $13.5 billion in YTD flows into BTC, now making up nearly 70% of gold ETF inflows.
• Institutional investors like BlackRock (IBIT currently holds ~700k BTC) are still accumulating. The U.S. is also building a “Strategic Bitcoin Reserve,” reinforcing long-term confidence.
📉 Technical Analysis:
• Key Resistance: $109,000–$110,000, opening the path toward $110,500–$110,600 (Supertrend around $110,174).
• Nearest Support: $108,300 (EMA), followed by $107,800–$108,000; deeper pullback support at $105,000.
• EMA 09: Price is above this EMA → short-term trend remains bullish.
• Candlestick/Volume/Momentum: RSI is neutral around 58; MACD is converging near the zero line, signaling weakening bearish momentum and possible base formation.
📌 Outlook:
Bitcoin may continue its mild upward movement if it holds above $108,300–$108,000 and breaks clearly above $109k–110k with strong volume. Failure to do so could trigger a pullback toward $107,000–$108,000.
💡 Suggested Trading Strategy:
📉 SELL BTC/USD at: 109,500–110,000
🎯 TP: 108,000
❌ SL: 110,400
📈 BUY BTC/USD at: 108,200–108,500
🎯 TP: 109,500–110,000
❌ SL: 107,800
"DXY Bullish Setup – High Probability Trade!"🚨 "DXY DOLLAR BANK HEIST" – THIEF TRADING STYLE MASTER PLAN (HIGH-IMPACT TRADE ALERT!)
🔥 "Steal the Market Like a Pro – This DXY Heist Could Print Serious Cash!" 🔥
🌍 Greetings, Market Pirates & Profit Raiders! 🌍
🤑 "Money isn’t made… it’s TAKEN!" 💰💸
Based on the 🔥 Thief Trading Style 🔥 (a lethal mix of technical + fundamental + psychological warfare), we're executing a DXY Dollar Index Bank Heist—a high-stakes robbery where YOU get to keep the loot!
📜 THE HEIST BLUEPRINT (TRADE PLAN)
🎯 ENTRY ZONE – "BREAK THE VAULT DOOR!"
📍Key Trigger: Wait for price to SMASH through the Moving Average Wall (97.700) – then STRIKE!
🔪 Thief’s Entry Trick:
Buy Stop Orders above MA (aggressive)
Buy Limit Orders near recent swing low (smart pullback play)
DCA/Layering Strategy for max profit extraction (real robbers scale in!)
🚨 ALERT SETUP: "Don’t miss the breakout – set an ALARM!" ⏰
🛑 STOP LOSS – "DON’T GET CAUGHT!"
"Yo, rookie! If you’re entering on a breakout, WAIT for confirmation before placing SL!"
📍Thief’s SL Zone: 97.400 (30min swing low – adjust based on your risk appetite!)
⚠️ WARNING: "Place it wrong, and the cops (market) will lock YOU up!" 🚔
🎯 TARGET – "ESCAPE WITH THE LOOT!"
🏆 Primary Target: 98.350 (Take profits before the resistance police show up!)
🔄 Scalper’s Bonus: "Trail your SL, squeeze every pip!"
💡 Pro Tip: "If you’re underfunded, ride with the swing traders – teamwork makes the dream work!"
💣 WHY THIS HEIST WILL WORK (MARKET DYNAMICS)
✅ Bullish Momentum Building (DXY showing strength!)
✅ Overbought? Maybe… but thieves don’t wait for permission!
✅ Trend Reversal Potential (Big money shifting!)
✅ Police (Resistance) Trap Ahead (Escape before they catch you!)
📡 NEWS & RISK MANAGEMENT (DON’T GET BUSTED!)
🚨 High-Impact News? AVOID new trades! (Use trailing stops to lock profits!)
📊 Check COT Reports, Macro Data, Geopolitics (Smart thieves do their homework!)
💥 BOOST THIS HEIST – LET’S GET RICH TOGETHER!
👊 "Hit the LIKE & BOOST button to fuel our next heist!"
💖 "More boosts = More robberies = More FREE money for YOU!" 🚀
⚠️ DISCLAIMER (LEGAL SPEAK)
"This ain’t financial advice – just a damn good robbery plan. Trade at your own risk, and don’t cry if you ignore the SL!" 😎
🔔 Stay tuned for the next heist… The market’s our playground! 🏴☠️💰
🚀 "See you at the next breakout, thief!" 🚀
🔥 #DXY #Forex #Trading #BankHeist #ThiefTrading #ProfitPirates #MakeMoney #TradingView #SmartMoney 🔥

$ETHUSDT: Uptrend signal in the daily timeframeEthereum is ready to move higher, as I anticipated when the BINANCE:ETHBTC signal flashed...
Best of luck lads!
Cheers,
Ivan Labrie.

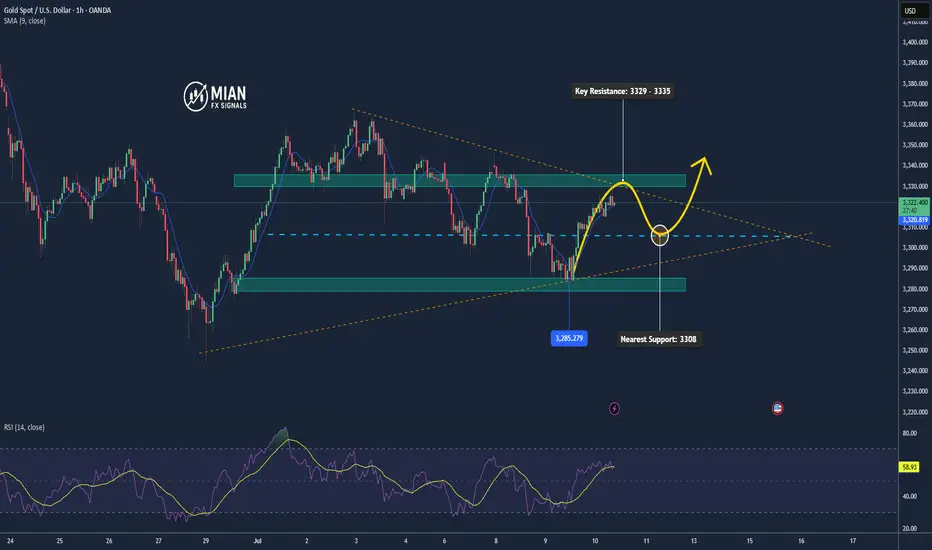
Gold Rejected at 3329.5, Profit-Taking Pressure Rises📊 Market Overview:
Gold surged to 3329.5, approaching key resistance, but quickly dropped to 3319.8 due to strong selling pressure, signaling short-term profit-taking. It’s now slightly recovering and trading around 3321.
📉 Technical Analysis:
• Key Resistance: 3329 – 3335
• Nearest Support: 3308 – 3285
• EMA 09: Price remains above EMA 09 → uptrend still intact.
• Candlestick / Volume / Momentum: H1 candle shows long upper wick at resistance. High volume at the top suggests profit-taking activity.
📌 Outlook:
Gold may continue a short-term correction if it fails to break above 3330 decisively. Bulls need to hold 3308 to maintain the upward structure.
💡 Suggested Trading Strategy:
🔻 SELL XAU/USD : 3330 – 3333
🎯 TP: 40/80/200 pips
❌ SL: 3336
🔺 BUY XAU/USD at: 3302 – 3305
🎯 TP: 40/80/200 pips
❌ SL: 3399