104This channel is not providing individualized trading or investment advice, nor is it a banking service, brokerage service, trading service, investment service or money management service
Beyond Technical Analysis

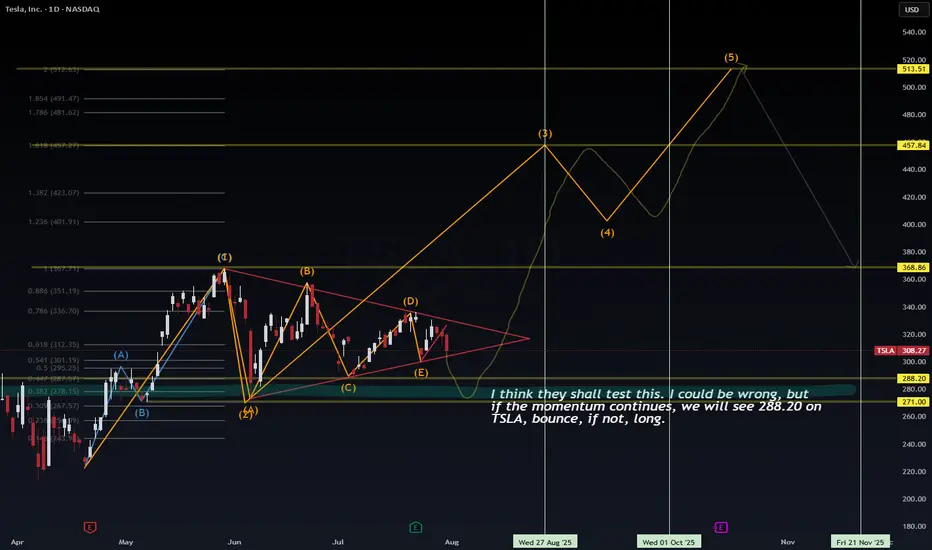
Tesla (TSLA) – VolanX Forecast: The Calm Before the Storm?📊 Tesla (TSLA) – VolanX Forecast: The Calm Before the Storm?
Wave structure analysis + liquidity map + roadmap to $513
🧩 The Story So Far – Compressed Potential
Tesla has spent the past three months inside a contracting triangle (ABCDE) — a classic Elliott Wave corrective pattern that signals energy compression before expansion. From the May high (Wave (1)), price has been coiling within tightening range boundaries, forming lower highs and higher lows. The triangle culminates with leg (E), now hovering near support.
🟠 VolanX flags this as a terminal wedge—an area where institutions test both sides of the book, hunting liquidity.
🌀 Wave Forecast – Impulse Awakening
If the triangle completes as expected, we enter Wave (3)—typically the most explosive wave in Elliott sequences.
Here's how the projected roadmap unfolds:
Wave (2) ends around $288.20–$271.00 (key demand/liquidity zone)
Wave (3) initiates from this springboard, aiming toward:
📈 1.0 Fib Extension at $367.71
📈 1.618 Extension at $457.84
Consolidation expected at that level forms Wave (4)
Final thrust into Wave (5) targets $513.51, aligning with extended Fib projection and historical order block
This sequence respects classical Elliott impulse structure: 5-wave motive into macro target zone.
🧪 Timing & Liquidity – Watch the Clock, Watch the Flow
🗓 Key Windows from chart verticals:
Aug 27–Sep 1, 2025: Liquidity test at $288.20 zone
Oct 1–15, 2025: Expansion toward Wave (3)
By mid-November 2025: Completion of Wave (5) → exhaustion at $513 zone before probable macro retracement
🔍 Liquidity Zones:
$288.20 – Institutional reaccumulation level (VolanX confirms large resting bids)
$271.00 – Final sweep zone. Break below would invalidate bullish count
Above, $336.70–$351.19 is the first liquidity magnet
Major stops above $457.84, then final cluster $513.51
🧠 VolanX Opinion – AI View on Risk & Opportunity
VolanX signals high-probability breakout setup, with confluence across:
Liquidity clusters
Fibonacci symmetry
Elliott sequencing
Gamma positioning (institutional hedging tilts long below $290)
📈 Current predictive bias: 68% probability of breakout from triangle resolving bullishly, conditional on $288 support holding.
If tested and respected, AI favors aggressive repositioning in long gamma, echoing historical TSLA breakout behavior.
📌 Strategy Summary:
“I think they shall test this… I could be wrong. But if momentum holds, $288.20 bounce is likely. If not, wait for structure to rebuild before long.”
🧭 Trade Setup (Not Financial Advice):
Watch zone: $288–271
Confirmation: Strong rejection wick + volume delta flip
Stop: Below $267.57
Targets: $367.71 → $457.84 → $513.51
🔻 Risk comes from invalidation below $271.
⚡ Reward stems from recognizing compression before expansion.
#TSLA #VolanX #ElliottWave #LiquiditySweep #WaveAnalysis #FibonacciLevels #SmartMoney #OptionsFlow #TeslaForecast #AITrading #WaverVanir
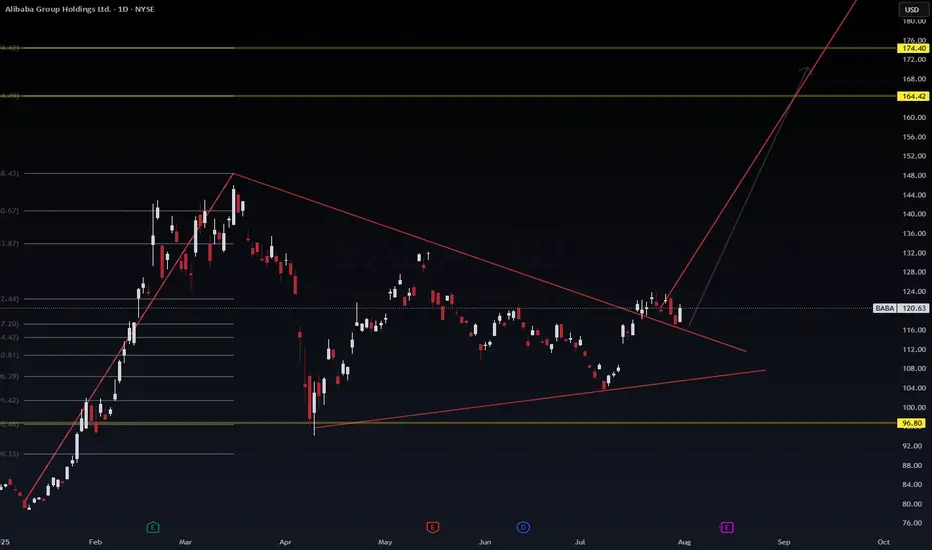
BABA: We have a bounce but is it temporary? Too many questions but dss forecasts a price growth near-term on ticker symbol $BABA. We will see where it goes. Another one on the watch is NASDAQ:PDD
HCL Copper 1M, TF Anticipating Growth & Key Levels ⚙️ Materials: Commodity Cycle Turnaround
(Green energy metals, China recovery)
Government of India Enterprise
Hindustan Copper Limited (HCL)
The company is undergoing a significant mine expansion, projecting a 5x increase in output. This positive development is already reflected in institutional interest, with DIIs increasing their exposure by 8.2% in Q1.
At the time of this analysis, the price stood at 273.
We've observed a volume climax at the bottom, suggesting a potential exhaustion of selling pressure and a base formation.
The white ghost candles pattern illustrate an anticipated future price path, which I project based on current market dynamics and patterns. This projection outlines a potential trajectory we will monitor closely as price develops.
A strong engulfing bullish candle formation above the 281 pivot (🔵) would signal significant bull strength and confirm a strong upward momentum.
A confirmed breakout above the monthly resistance level (🔴) would be a critical bullish signal. initiating further long positions upon a successful retest of this breakout level.
My primary accumulation zone for potential entries is identified in green (🟢 dotted), ranging between 241 and 212. This range represents an area where I anticipate favorable risk-reward for entry.
Target & Time Horizon:
While precise timing is always challenging, I estimate the projected target up to 100% ( above in the white dotted line) could be reached around Q2 2026 or before as markets perform.
Disclaimer:
This analysis represents a personal projection
based on current market observations.
Trade Safely,
Always DYOR
#हिन्दुस्तान कॉपर लिमिटेड
#indianeconomygrowth

Targets and their point in timewe use the threshold breaks to determine targets AKA areas of liquidity. we also utilize pattern detection paired with the threshold breaks to validate cycles and where we are in said cycle.
Seeking the nearest Sell SideThe image speaks for itself
this is an ict concept idea and from experience work that I have done over 7yrs

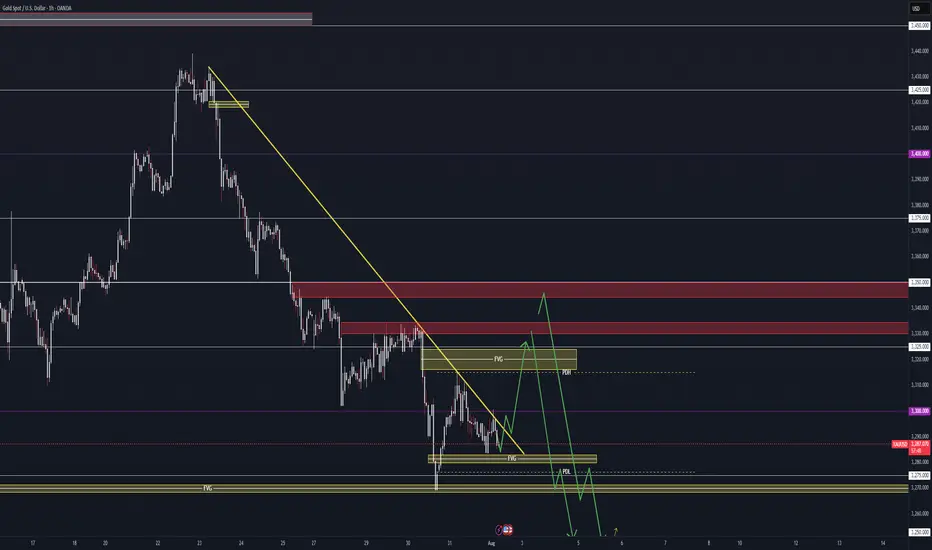
POSSIBLE BEARISH CONTINUATION ON GOLDBased on price action, Gold presents a very bearish sentiment from the daily point of view.
The indicated supply region may be the area of interest for the build up of the sells if indeed Gold is bound for the monthly lows.
Confirmation is needed for an entry.

XAUUSDXAUUSD breakout falling channle and resistance zone.
Buy above 3295
Stop Loss: 3291
1st TP: 3308
2nd TP: 3313
3rd TP: 3322
4th TP: 3333

SUI | Spot Buy Zone for PullbackPrice has pulled back after a local top and is heading toward a clear demand zone.
Key buy area sits around $3.12, aligned with 0.618 retracement and recent consolidation.
Strong structure below—if majors keep retracing, this is where risk/reward for new spot buys becomes attractive.
Plan:
Waiting for price to reach the green zone to accumulate spot.
Invalidation below $2.80, targeting a move back toward $4.45 and higher if momentum returns.

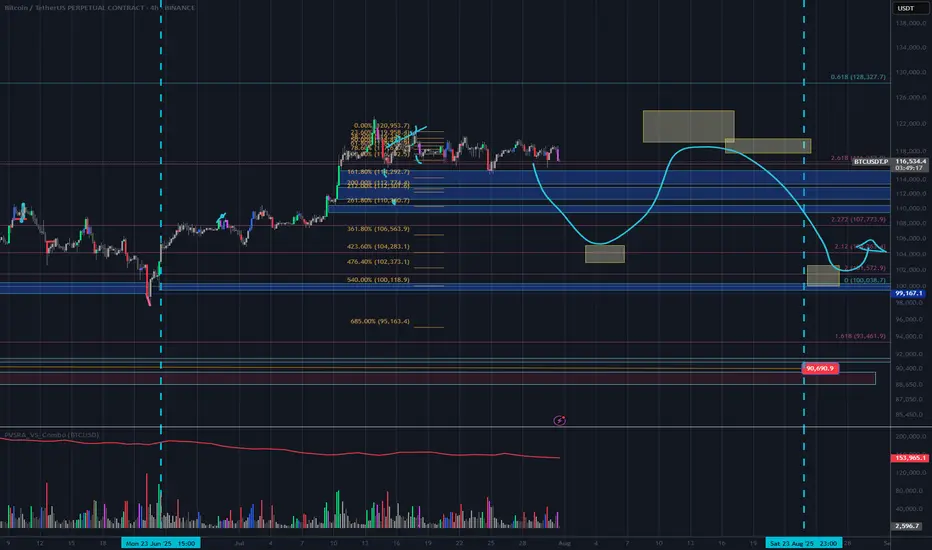
BTC | Short Bias — Targeting $113kPrice rejected perfectly off the 0.5 retracement and is now filling the previous imbalance.
Yesterday's daily close was decisively bearish, confirming downside momentum.
There’s a lack of convincing reversal signals at current levels.
Plan:
Main expectation is continued downside toward the $113k support.
Not interested in longs until price stabilizes at or below that level.

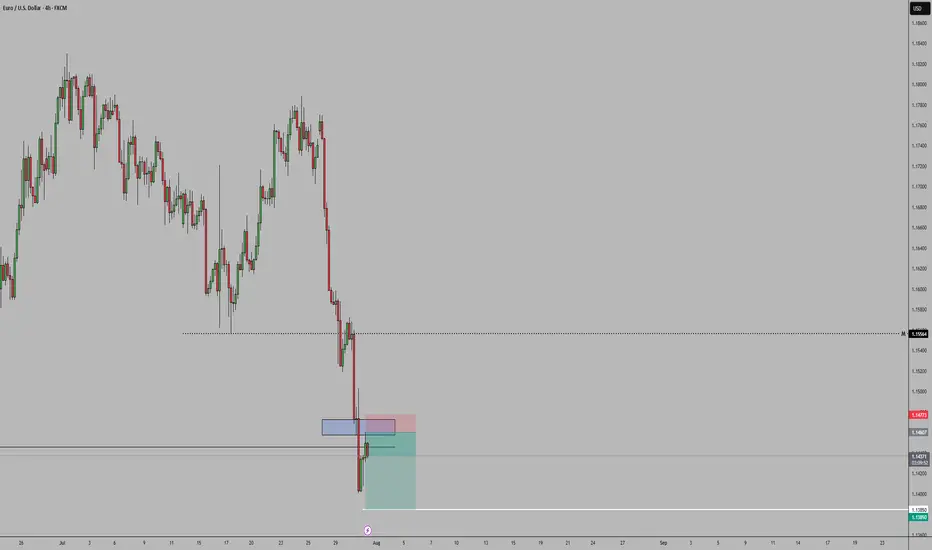
EURUSDWe have a strong bearish sentiment for EURUSD this week, so meaning big instituttions are selling the pair so we follow their lead. And we can see that we just broke below a support which is now acting as a resistance, more bearish momentum continuation can we expected
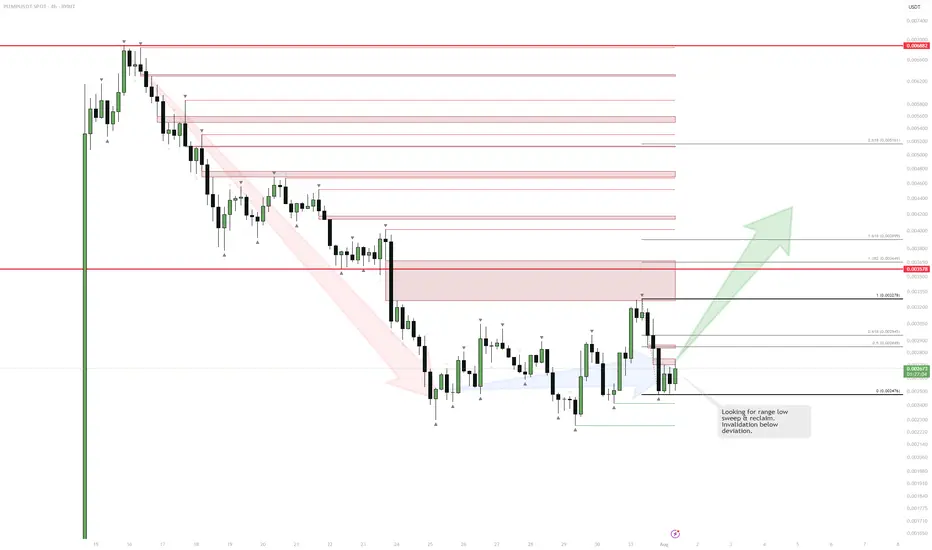
PUMP | Watching for Base ConfirmationThe sharp downtrend is showing signs of exhaustion as price starts to consolidate and build a potential range.
If we see a sweep and reclaim of the range low, that would confirm the start of a new accumulation phase and signal a potential reversal.
The invalidation for any long attempt is a confirmed breakdown below the deviation or the origin of the reclaim.
Plan:
Wait for a clean sweep and reclaim of the range low to trigger a long entry.
Target resistance levels above, with stops set below the reclaim origin.

SUPER BUY GOLD XAUUSD Gold has ripped all levels of take profit and has gone up and gave us a small amount of drawdown with huge gains in return, simple trading price action and (M&Ws)

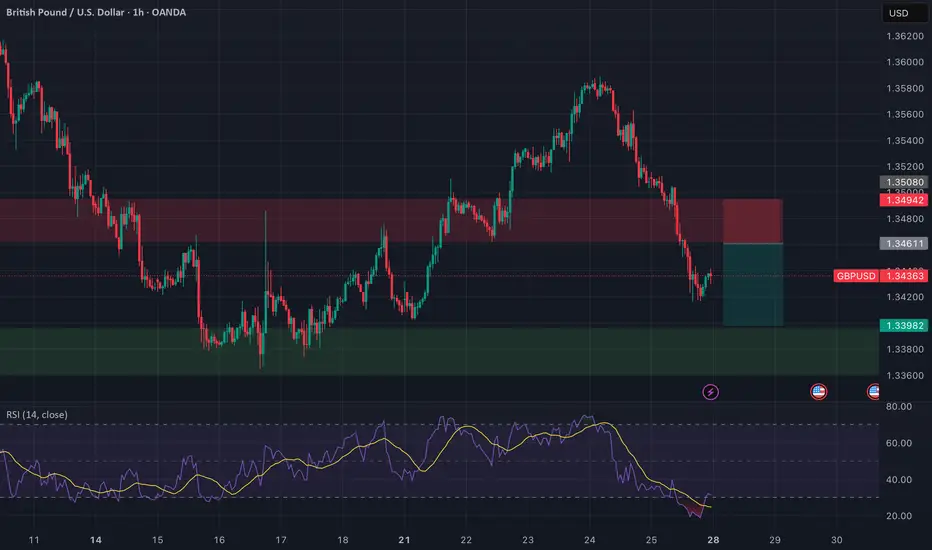
GBPUSD: Selling the Retest | Clean Break, Wait for Confirmation🔻 GBPUSD | Sell the Retest of Broken Support
Timeframe: 1H
Bias: Bearish
Type: Break and Retest
📊 Technical Setup
GBPUSD has broken a key 4H support zone (~1.3460–1.3494) which now acts as a turncoat resistance. Price is currently pulling back, offering a prime opportunity to sell the retest.
• Entry: 1.3460–1.3490 (after confirmation of rejection)
• SL: Above 1.3508
• TP: 1.3398
• RR: ~1:2
• RSI: Bearish momentum, RSI < 50 with mild recovery—ideal for a fade trade
📉 Macro & Fundamental Confluence
• GBP: Despite hawkish BOE tone, GBP is showing technical weakness and soft CFTC positioning
• USD: Strong macro bias with rising conditional score and delayed Fed cuts (still supporting USD strength)
• Seasonal Bias: GBPUSD marked bearish in seasonal chart
• COT Data: GBP positioning turning bearish after previous net build-up
🧭 Gameplan
“Wait for the retest of broken support-turned-resistance to reject before entering short. Stick to the zone.”
🔔 Set alerts around 1.3460–1.3490 and monitor for bearish engulfing or pinbar confirmation.
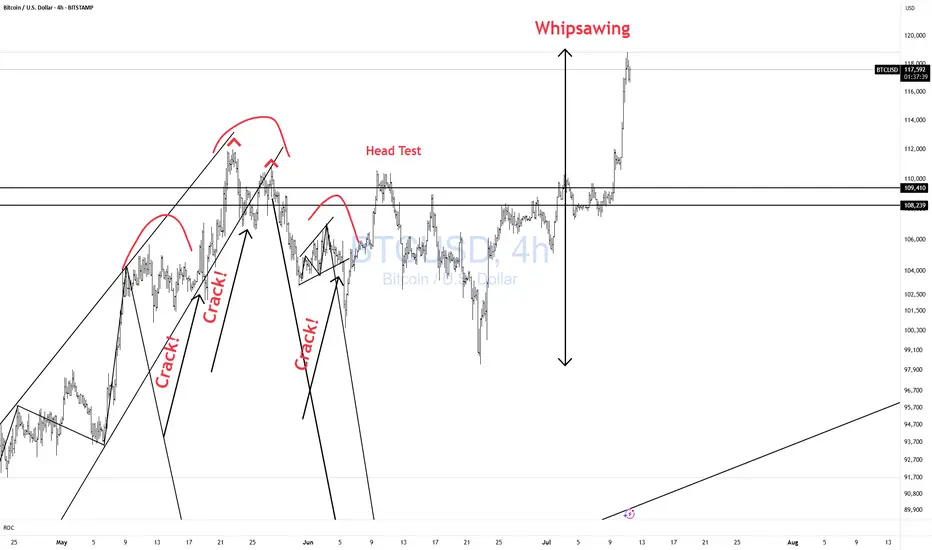
BTCUSD Whipsawing! CAUTION!Bulls CAUTION! Price is whipsawing all over the place.
Better to be out of the market wishing you were in than in wishing you were out!! Don't chase!!
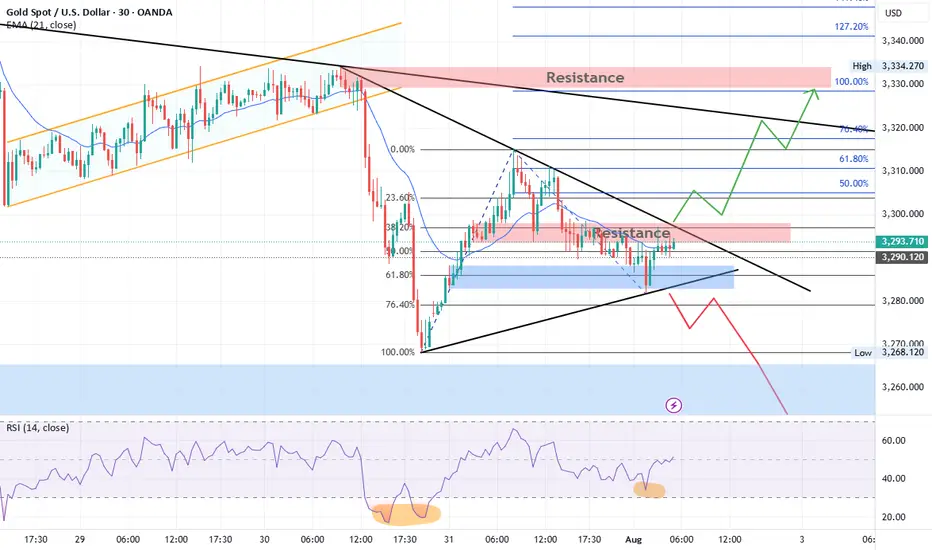
Gold Technical Outlook
Gold is currently consolidating inside a triangle pattern. After a recent bullish rally, price retraced between the 61.8% – 76.4% Fibonacci levels, finding support and bouncing upward. At present, gold is facing resistance at both the falling trendline and the 3298–3300 zone.
Bullish Scenario:
A breakout above the resistance trendline and the 3298–3300 zone could trigger a strong bullish move toward 3311, 3322, and 3333. A sustained break above 3333 would confirm a short-term bullish trend, opening the way for higher targets at 3360 and 3400.
Bearish Scenario:
If price faces rejection from the 3300 resistance and the falling trendline, gold is expected to move lower, retesting 3270. A decisive break below 3270 may extend the decline toward 3250. If 3250 is broken, gold could enter strong bearish momentum, potentially shifting the long-term trend to the downside with targets at 3000 and 2850.
OANDA:XAUUSD Gold Technical Outlook
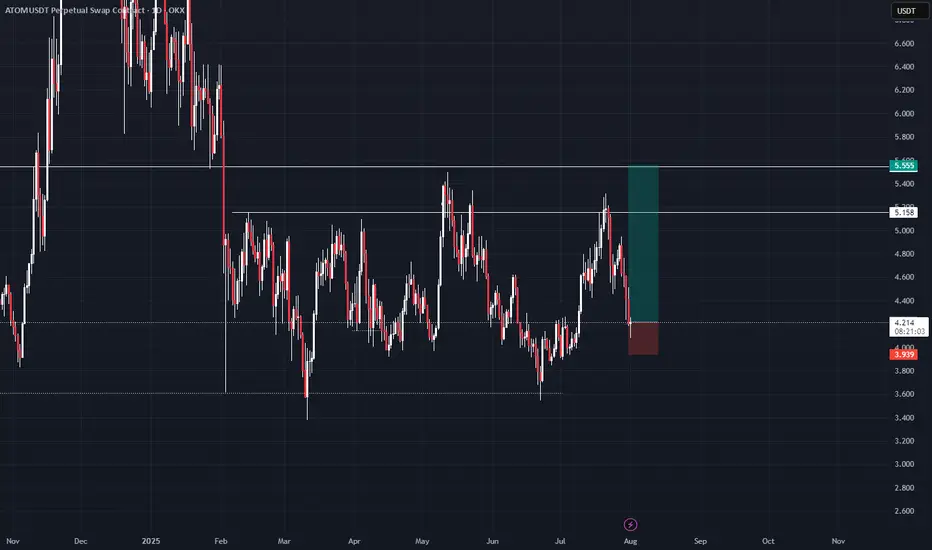
ATOMim thinking about that as a diviation from global diapozone so we have to at least test its lower boarder 5.555 that is my first target if we will return higher than 5.555 ill be looking for 11.4 as a swing target
Silver Remains a Buy on DipsIt seems the precious metals market didn’t mourn the Fed’s decision and subsequent press release for long.
The uptrend remains intact, and the previously supportive factors are still in play.
Even amid the negative news, there was no sharp sell-off — everything stayed within the trend. This clearly signals that rate cuts are on the horizon, and metals are likely to continue their upward move.
We only trade from the long side — nothing has changed.
At the moment, we've seen a pullback, and it feels strange not to take advantage of it and add more silver to the portfolio.
Stop-loss is set below yesterday’s candle low at 36.15.
We’ll see how the position develops. For now, the idea is to hold as long as the stop-loss holds. The long-term target is 48. Obviously, we won't reach it quickly, so I’ll trail the stop as the trade progresses — first to breakeven, and eventually into profit.

BTCUSD – Bullish Recovery Setup Forming Near Trendline Support🧠 Market Structure & Technical Breakdown
The BTCUSD 4H chart showcases a well-formed descending triangle or falling wedge structure with clearly respected major and minor descending trendlines. Currently, price action is testing a dynamic support zone, highlighted in green, which has been a strong reaction area in the past.
This area aligns with a bullish accumulation zone, from which buyers have previously stepped in to initiate impulsive moves. Given the confluence of diagonal support and horizontal price reactions, we may be on the verge of a bullish breakout opportunity.
📍 Key Zones & Trendlines
✅ Green Support Channel (Demand Zone): Acting as a key pivot for multiple recent rejections, this area (~114,000–113,000) is now being revisited again, offering potential buy interest.
📉 Minor Trendline: A short-term descending resistance around 120,000—likely the first barrier in case of a bounce.
📉 Major Trendline: A more extended dynamic resistance line connecting swing highs, currently intersecting near the 124,000 region.
🔄 Potential Price Scenarios
Primary Bullish Setup (MMC Plan):
Price bounces off the green demand zone.
Breaks above the minor trendline (~120K).
Pullback retest to confirm breakout.
Continuation toward the major breakout level (~124K and beyond).
Invalidation / Bearish Case:
A clean breakdown below 113,000 with strong bearish momentum would negate this setup, likely targeting the psychological support near 110,000.
🧠 MMC Mindset: Trade with Patience & Confluence
This is a classic accumulation-to-breakout scenario. Smart traders wait for confirmation—especially as BTC often exhibits false breakdowns before a major move. Monitor candle behavior, volume, and reaction to the minor trendline.
Let the market show signs of strength (like bullish engulfing, pin bars, or a breakout-retest) before committing to the upside. Avoid FOMO; the key is discipline and precision entry at structural break points.
✅ Trade Plan Summary:
Watch zone: 113,000–114,500 for bullish price action
Breakout level: Minor trendline (~120,000)
Target zone: 123,500–124,000 (Major resistance)
Stop-loss idea: Below 112,800 (Invalidation of structure)

NFP Friday - XAUUSD Prediction - August 2025#NFP Friday + New Month 👇
- Still leaning bearish on TVC:GOLD
- New month = re-positioning flows
- Watching 3225–3250 zone (Fib 38/50 confluence)
- Clean pullback setup near Psy level & untested orders
News Prediction:
- Labor market still holding up, I’m thinking NFP prints closer to 130k–150k, not that 110k estimate
- Yes, tech & retail saw some layoffs, but not enough to tank the whole report
- Adapt if wrong, execute if right. No stress
#XAUUSD #Gold #NFP #Dollar #NFPFriday #XAUUSD #Gold #NFP #JobsReport #Dollar #Macro #Trading #MarketOutlook #NFPFriday
XAUUSD ShortElite Analysis
All confirmations were confirmed
Targeting lower liquidity pools
Executed in a small time frame
Thank You!

NF news, can gold selling pressure drop to 3240?⭐️GOLDEN INFORMATION:
Gold (XAU/USD) is trading lower, around $3,285 in early Asian hours on Friday, as a firmer U.S. dollar weighs on the non-yielding metal following new tariff measures announced by President Donald Trump.
The White House said late Thursday that Trump will set a 10% baseline tariff, stepping back from earlier speculation about hikes to 15% or higher, according to Bloomberg. He also signed an executive order raising the tariff on Canada from 25% to 35%, effective August 1, 2025, while extending Mexico’s current tariff rates for another 90 days to allow more time for negotiations.
⭐️Personal comments NOVA:
large frame, gold price is still moving in the downtrend line. will wait for NF result to have strong selling force again 3240
⭐️SET UP GOLD PRICE:
🔥SELL GOLD zone: 3374- 3376 SL 3381
TP1: $3365
TP2: $3350
TP3: $3333
🔥BUY GOLD zone: $3242-$3240 SL $3235
TP1: $3255
TP2: $3268
TP3: $3280
⭐️Technical analysis:
Based on technical indicators EMA 34, EMA89 and support resistance areas to set up a reasonable SELL order.
⭐️NOTE:
Note: Nova wishes traders to manage their capital well
- take the number of lots that match your capital
- Takeprofit equal to 4-6% of capital account
- Stoplose equal to 2-3% of capital account
