BTC SETUPBTC is currently on a sell retracement and after this retracement we are expecting a bullish run but before then we will be currently bearish till we see sell exhaustions.
Beyond Technical Analysis
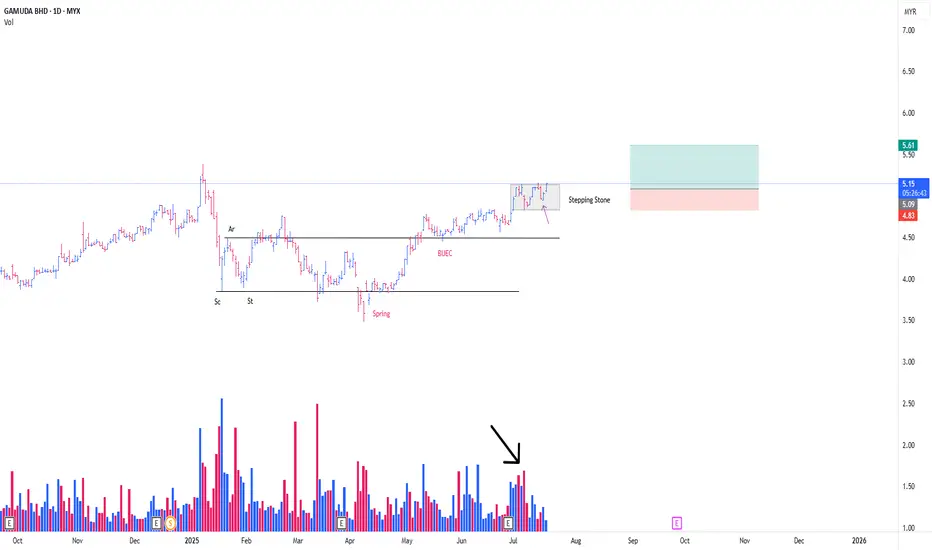
GAMUDA CONT MARKING UP PHASEThis is a continuation from my prev post
**Refer to the link below
This is a play coming from the Stepping Stone (SS)
-SS is a term, in wcykoff methode , particularly describing a momentarily 'pause' in between, consecutive mark up phase.
Absoprtion detected from the on going SS
*Black arrow
with the possibility of Trigger Bar today, in the background of SpringBoard Schematic #2 *Purple arrow
-Position initiated as attached
PureWyckoff

AUDCHF expecting bullish contianution
OANDA:AUDCHF interesting structure, trend based analysis, here exepcting bullish continuation.
SUP zone: 0.52200
RES zone: 0.52900, 0.53200

Gold UpdateWe are now in a Deeper pullback, dosnt change the overall bigger Structure but for now these are the moves i can see
Levels marked
dolarBR beijo me liga Conclusion: the market priced in the impact of the 50% tariff with a possible rise in the dollar, and the chart suggests an attempt to reverse the downward trend.

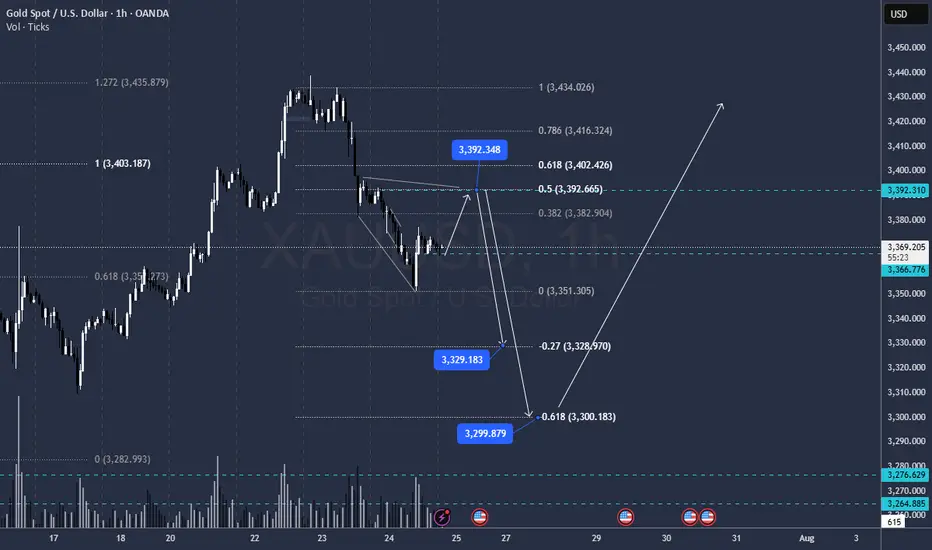
XAU/USD – Elliott Wave Update | Wave (2) in Progress)OANDA:XAUUSD
🔍 Wave Structure Overview
We’re currently in a
Prior impulse (likely 1-2-3-4-5) completed, forming (Circle) wave ①
Current correction unfolding as (A)-(B)-(C) in yellow
↳ Presently in wave (A) or transitioning into (B)
↳ Within (B), structure is forming as A-B-C
↳ Currently tracking 5-wave move from 4 to 5
📐 Fibonacci & Key Levels
Watching 61.8% retracement as a critical support zone ✅
This level also marks a high-probability TP area for short positions
Strong confluence:
🔹 Fibonacci retracement
🔹 Extension alignment (e.g. yellow fib extension to ~4403)
🔹 Trendline reaction expected
🧠 Trade Setup (Scenario-Based)
🔸 Scenario A – Early Entry:
Enter small long near 61.8% Fib zone
SL: Below last swing low
TP: To be refined once C-wave completes
🔸 Scenario B – Confirmation Entry:
Wait for break above red trendline
Add position
SL below Fib zone low
TP around Fibonacci extension / structure resistance (~4403)
⚠️ Key Considerations
Many positions will close in this zone → increase in selling pressure
Possible reversal zone → watch for confirmation (impulse or ABC)
Once wave (C) completes, we’ll likely see entry into a larger bearish move
📎 Conclusion
This is a high-probability reversal zone, supported by Elliott structure and Fib levels. I’m planning to scale in based on price action and confirmation.
📈 Stay flexible, manage risk, and watch the structure evolve.

MOH PUT TRADE ALERT (07/24)
🚨 MOH PUT TRADE ALERT (07/24) 🚨
📉 Extreme Oversold. Institutional Selling. Setup is Real.
🧠 Key Stats:
• RSI: 13.2 = insanely oversold
• Volume: 🔺2.6x last week = institutions dumping
• Put/Call Ratio: 0.33 → heavy bearish bets
• VIX: Low → IV still cheap 💰
🔥 TRADE IDEA
🔻 Buy MOH $150 PUT exp 8/15
💰 Entry: $4.20
🎯 Target: $8.40
🛑 Stop: $2.50
📈 Confidence: 75%
📊 Why this works:
• Everyone’s selling, and the chart confirms it
• IV still low → great R/R for puts
• Only risk? Dead-cat bounce — use stop.
🧨 Execute at open — momentum is accelerating.
#MOH #PutOptions #BearishSetup #OversoldRSI #UnusualOptionsActivity #TradingView #InstitutionalSelling #SmartMoney #SwingTrade #WeeklyOptions #ShortTheBounce

EW EARNINGS TRADE SETUP
📈 EW EARNINGS TRADE SETUP (07/24) 📈
💥 Quiet stock, loud opportunity. Fundamentals strong. Market asleep. We’re not.
🧠 Quick Read:
• Beat rate: 88% over 8 quarters
• Margins elite (OP Margin: 29%, Net: 75.7%)
• RSI 43 → Neutral setup with room to run
• Big OI at $80 calls (6.7k+) 💪
• IV not bloated → low crush risk ✅
🎯 TRADE IDEA
🟢 Buy EW $80 Call exp 8/15
💰 Entry: $1.55
🎯 Target: $4.65
🛑 Stop: $0.77
📈 Confidence: 70%
📊 Why it works:
• Medical device demand + aging population = macro tailwind
• Market ignoring it = opportunity
• Risk-on tape + IV sweet spot
#EW #OptionsAlert #MedicalTechStocks #EarningsSetup #LongCall #RiskReward #OptionsTrading #StockAlert #SwingTrade #TradingView #SmartMoneyFlow

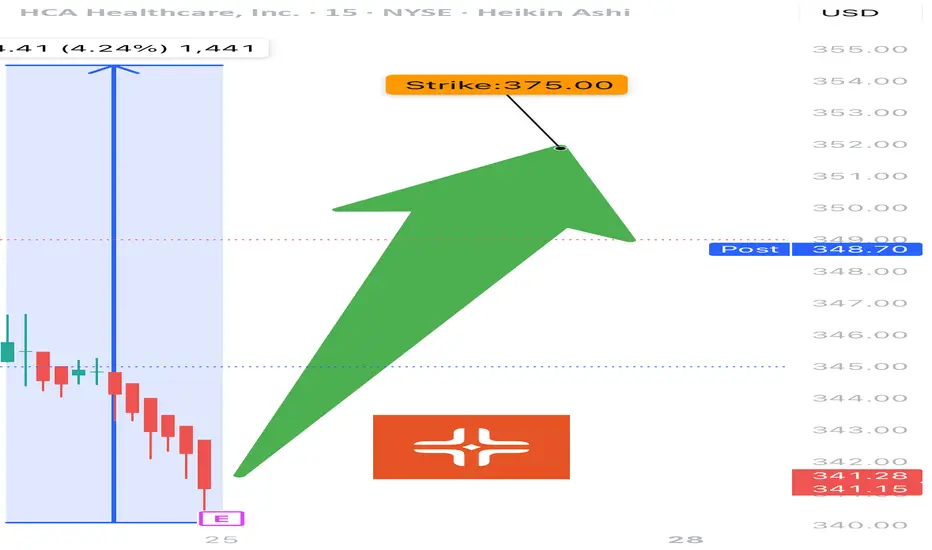
HCA EARNINGS TRADE (07/24)
🚨 HCA EARNINGS TRADE (07/24) 🚨
🏥 Healthcare with earnings tonight after close — high-upside setup brewing.
🧠 Quick Breakdown:
• 📊 Revenue Growth: +5.7% (stable, defensive sector)
• 💸 Margins: Operating 15.6%, EBITDA 19.9% = efficient and strong
• 🧠 Beat Rate: 75% with 6.7% avg surprise → credible upside
• 📉 RSI: 22.5 → OVERSOLD and primed for bounce
• 💬 Whisper sentiment strong from sector peers (e.g., Tenet)
• 🔥 Analysts target: $391.54 → 13.8% upside
💥 TRADE SETUP
🟢 Buy HCA $375 Call exp 8/15
💰 Entry: $3.90
🎯 Target: $11.70 (200–300%)
🛑 Stop: $1.95
📈 Confidence: 73%
⏰ Entry: Before Close Today (Pre-Earnings)
📆 Earnings: Today After Market (AMC)
📊 IV Rank: 0.60 → fair pricing
📉 Expected Move: ~5%
⚠️ RSI this low + sector strength = earnings bounce candidate. Watch the $375 breakout zone. 🎯
#HCA #EarningsPlay #OptionsTrading #HealthcareStocks #UnusualOptionsActivity #CallOptions #TradingView #DayTrading #OversoldBounce #EarningsSeason
[USDJPY] Trade ideaJust entered this long position on this forex pair for an upside move.
Trying to catch the continuation of the trend on reversal pattern.
Great Trade !

07/24/25 Trade Journal, and ES_F Stock Market analysis EOD accountability report: +1452
Sleep: 4 hours
Overall health: need to catch up on sleep
** VX Algo System Signals from (9:30am to 2pm) **
— 9:37 AM Market Structure flipped bullish on VX Algo X3! :white_check_mark:
— 10:10 AM VXAlgo ES X1 Sell Signal :white_check_mark:
— 12:30 PM Market Structure flipped bearish on VX Algo X3! :x:
— 1:00 PM VXAlgo NQ X1DD Buy Signal :white_check_mark:
— 1:30 PM Market Structure flipped bullish on VX Algo X3:white_check_mark:
**What’s are some news or takeaway from today? and What major news or event impacted the market today? **
Today's market was a bit wild in the morning with a lot of big moves, sot here was opportunity to money if followed the signals.
I mostly finished trading by 12:30 because there was so many big moves.
**News**
(US) Pres Trump: Regarding firing Powell, would be a big move, it's not necessary; No pressure for Powell to resign; Have 1-3 names in mind for Fed Chair position
**What are the critical support levels to watch?**
--> Above 6370= Bullish, Under 6355= Bearish
Video Recaps -->https://www.tradingview.com/u/WallSt007/#published-charts

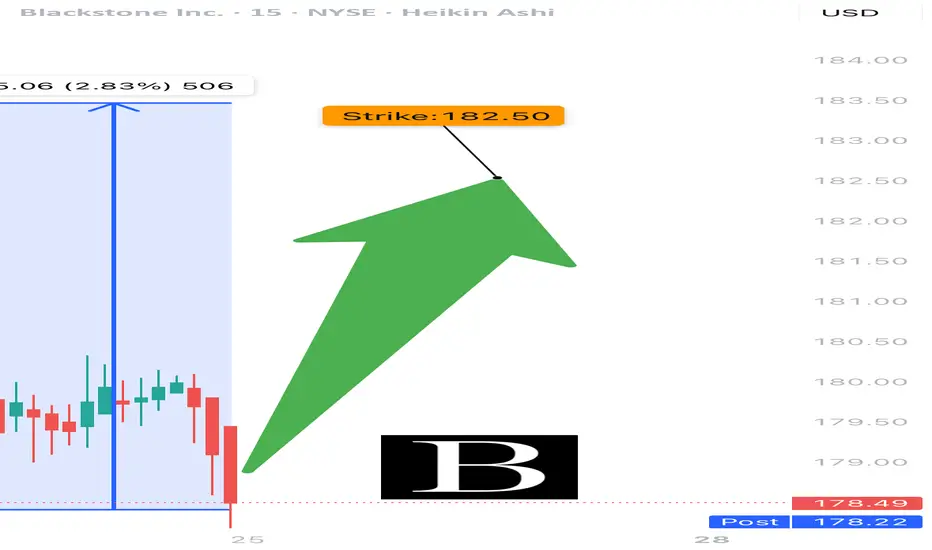
BX EARNINGS TRADE (07/24)
🚨 BX EARNINGS TRADE (07/24) 🚨
💼 Blackstone drops earnings after close — setup looks 🔥 bullish
🧠 Key Insights:
• 📉 TTM Revenue: -8.2%, but Q2 bounce back = $764M profit
• 💰 Margins: Strong → 45.3% operating, 20.6% net
• 📈 RSI: 73.88 = HOT momentum
• 🧠 AUM: $1.2 Trillion = 🐘 heavyweight
• 🔥 Options Flow: Call skew at $182.50 = institutional bullish bets
• 🧮 Expected move: ~5% post-earnings
💥 TRADE SETUP
🟢 Buy BX $182.50 Call exp 7/25
💰 Entry: $0.69
🎯 Target: $1.38–$2.07 (200–300%)
🛑 Stop: $0.34
📈 Confidence: 85%
⏰ Entry: Before Close Today (Pre-Earnings)
📊 IV Rank: 0.75 → options decently priced
⚠️ Watch resistance at $185 — breakout = 🚀
Tight risk, big reward. Pure earnings momentum play.
#BX #EarningsPlay #OptionsTrading #Blackstone #UnusualOptionsActivity #CallOption #TradingView #FinanceStock #InstitutionalFlow #OptionsAlert
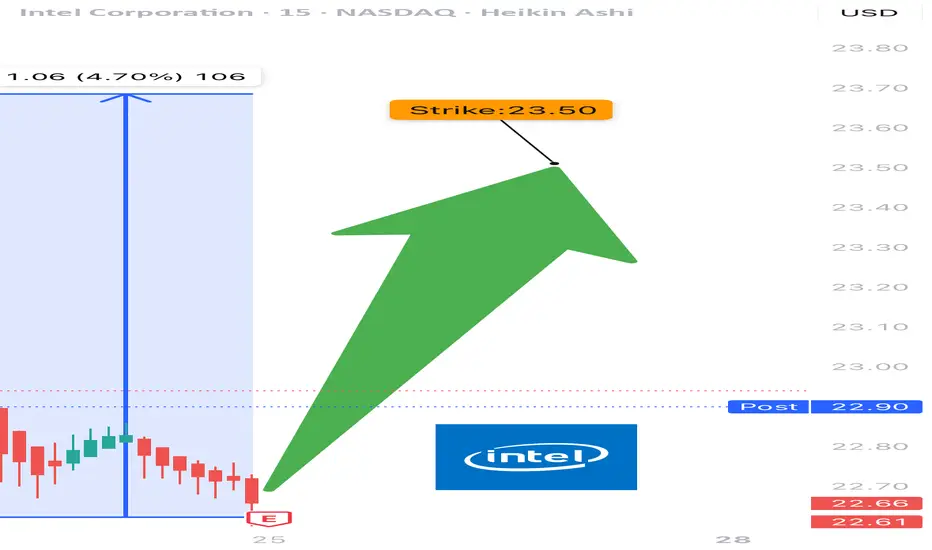
INTC EARNINGS TRADE (07/24)
🚨 INTC EARNINGS TRADE (07/24) 🚨
🎧 Earnings drop after close — here’s the high-conviction setup 📊
🧠 Key Highlights:
• 💥 Surprise Beat Rate: 88%, avg surprise = 419%
• 📉 Margins: Ugly (-36% net margin) but improving sentiment
• 📈 Volume Surge + $24 resistance test = pre-earnings drift 🚀
• 🔎 Mixed options flow → cautious bulls leaning in
• 🎯 Sector: SEMI = 🔀 rotating hard, competition vs AMD/NVDA rising
💥 TRADE SETUP
🟢 Buy INTC $23.50 Call exp 7/25
💰 Entry: $0.59
🎯 Target: $1.18
🛑 Stop: $0.29
📈 Confidence: 75%
⏰ Entry: Before Earnings (Close 07/24)
📆 Earnings: Today After Market (AMC)
📊 Expected Move: 5%
⚠️ Play the earnings drift → gap up = profit. Miss = cut fast. Risk = defined. Reward = explosive.
#INTC #EarningsPlay #OptionsTrading #IntelEarnings #UnusualOptionsActivity #TechStocks #Semiconductors #TradingView #EarningsSeason #DayTrading #CallOptions
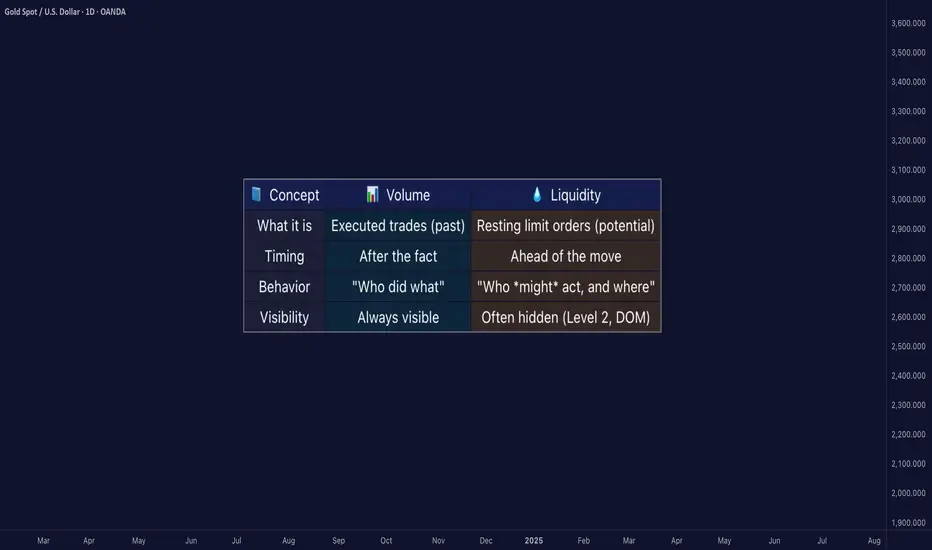
Liquidity ≠ Volume: The Truth Most Traders Never Learn█ Liquidity ≠ Volume: The Truth Most Traders Never Learn
Most traders obsess over volume bars, but volume is the footprint, not the path forward.
If you’ve ever seen price explode with no volume or fail despite strong volume, you’ve witnessed liquidity in action.
█ Here’s what you need to know
⚪ Volume Is Reactive — Liquidity Is Predictive
Volume tells you what happened.
Liquidity tells you what can happen.
█ Scenario 1: Price Jumps on Low Volume
❝ A price can jump on low volume if no liquidity exists above.❞
⚪ What’s happening?
The order book is thin above the current price (i.e., few or no sellers).
Even a small market buy order clears out available asks and pushes price up multiple levels.
Volume is low, but the impact is high because there’s no resistance.
⚪ Implication:
This is called a liquidity vacuum.
It can happen before news, during rebalancing, before session openings, on illiquid instruments, or during off-hours.
Traders often overestimate the strength of the move because they only see the candle, not the absence of offers behind it.
█ Scenario 2: Move Fails on High Volume
❝ A move can fail on high volume if it runs into a wall of offers or bids.❞
⚪ What’s happening?
There’s a strong surge of aggressive buying or selling (high volume).
But the order book has deep liquidity at that level — large resting limit orders.
The aggressive traders can’t chew through the liquidity wall, and price stalls or reverses.
⚪ Implication:
This is called liquidity absorption.
Market makers or institutions may intentionally absorb flow to stop a breakout.
Many retail traders mistake this for “fakeouts,” but it’s really liquidity defending a level.
⚪ What the Research Says
Cont, Stoikov, Talreja (2014): Price responds more to order book imbalance than trade volume.
Bouchaud et al. (2009): Liquidity gaps, not trade size, are what truly move markets.
Hasbrouck (1991): Trades only impact price if they consume liquidity.
Institutions don’t chase candles — they model depth, imbalance, and liquidity resilience.
⚪ Where the Alpha Lives
Liquidity tells you where the market is weak, strong, or vulnerable — before price moves.
Fakeouts happen in thin books.
Reversals occur at hidden walls of liquidity.
Breakouts sustain when liquidity follows the price, not pulls away.
If you understand this, you can:
Enter before volume shows up
Avoid chasing dead breakouts
Fade failed moves into empty space
█ Final Truth
Volume is the echo. Liquidity is the terrain. Alpha is in reading the terrain. You want to study the structure, because price moves toward weakness and away from strength. Learn to see where liquidity is, or where it’s missing, and you’ll see trading with new eyes.
-----------------
Disclaimer
The content provided in my scripts, indicators, ideas, algorithms, and systems is for educational and informational purposes only. It does not constitute financial advice, investment recommendations, or a solicitation to buy or sell any financial instruments. I will not accept liability for any loss or damage, including without limitation any loss of profit, which may arise directly or indirectly from the use of or reliance on such information.
All investments involve risk, and the past performance of a security, industry, sector, market, financial product, trading strategy, backtest, or individual's trading does not guarantee future results or returns. Investors are fully responsible for any investment decisions they make. Such decisions should be based solely on an evaluation of their financial circumstances, investment objectives, risk tolerance, and liquidity needs.
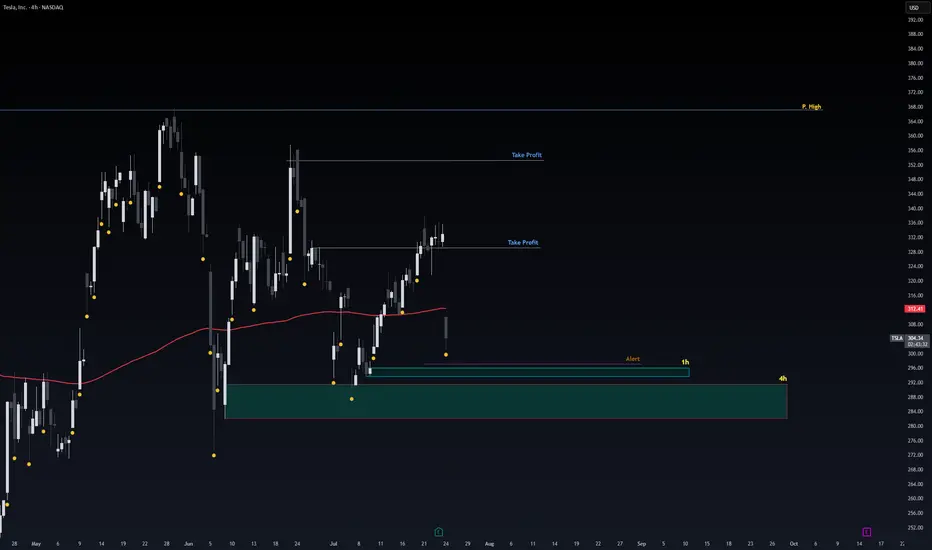
Safe Entry Tesla1h & 4h Green Zones are safest entry Zones.
Stop loss Below.
Note: 1- Potentional of Strong Buying Zone:
We have two scenarios must happen at The Mentioned Zone:
Scenarios One: strong buying volume with reversal Candle.
Scenarios Two: Fake Break-Out of The Buying Zone.
Both indicate buyers stepping in strongly. NEVER Join in unless one showed up.
2- How to Buy Stock (safe way):
On 1H TF when Marubozu/Doji Candle show up which indicate strong buyers stepping-in.
Buy on 0.5 Fibo Level of the Marubozu/Doji Candle, because price will always and always re-test the
Gold : Sell Continuation Gold: Top Formed at Major Supply Zone 🔻 | 4H Reversal Setup
Looking for continuation after bearish BOS. Targeting clean liquidity below. SL above structure. R:R ~3:1

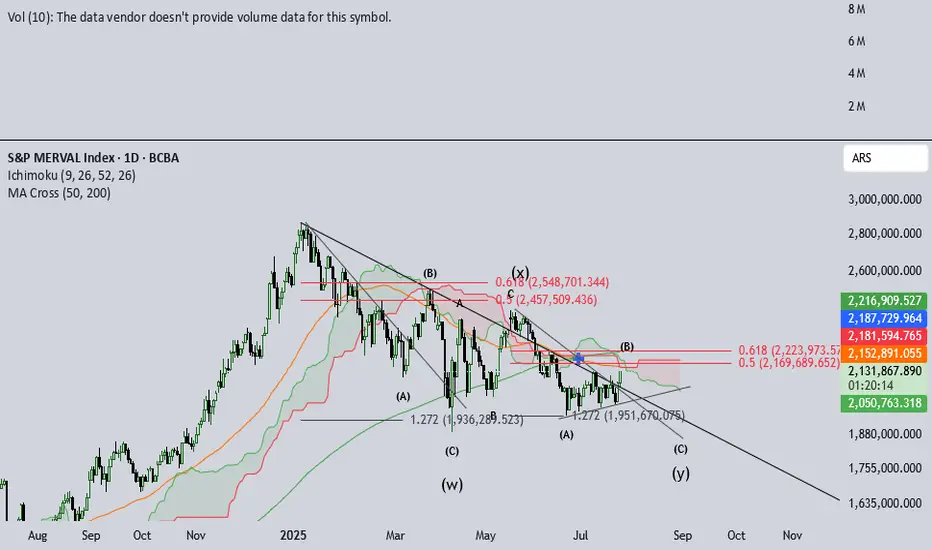
IMV Multiple analysisIMV, Argentina's Merval Index valued in pesos, has been in a downtrend since jan-25. Due to electoral process, noise has been increasing this last week, amidst some shade on what seemed as an easy win for Milei's gov.
The amount of chatter the Merval has brought up is inmense. This psychology is similar to that expected in IVth elliott's waves. Also, jul 2022 - dic 2024 saw huge gains, signaling IIIrd elliot´s wave behavior.
This long and extended IVth can be seen after such huge rallies. Anxiety begins to build up and retail investors begin to be shaken out. This IVth wave seems to be a triple-three type. Volatile and fast, this structure destroys an investor's patience.
Recent developements in the money market seem to have calmed down and peace seems to be partially restored. September elections are around the corner and this little Pax may be threatened.
I'm inclined to believe NOTHING WILL HAPPEN in these elections the govt faces, nor will the gov succeed enourmously, nor will it fail badly. So, I believe the index will likely test previous (W) wave bottoms, to then breakout for a final Vth wave. This analysis is compatible with a triangle-shaped breakout.
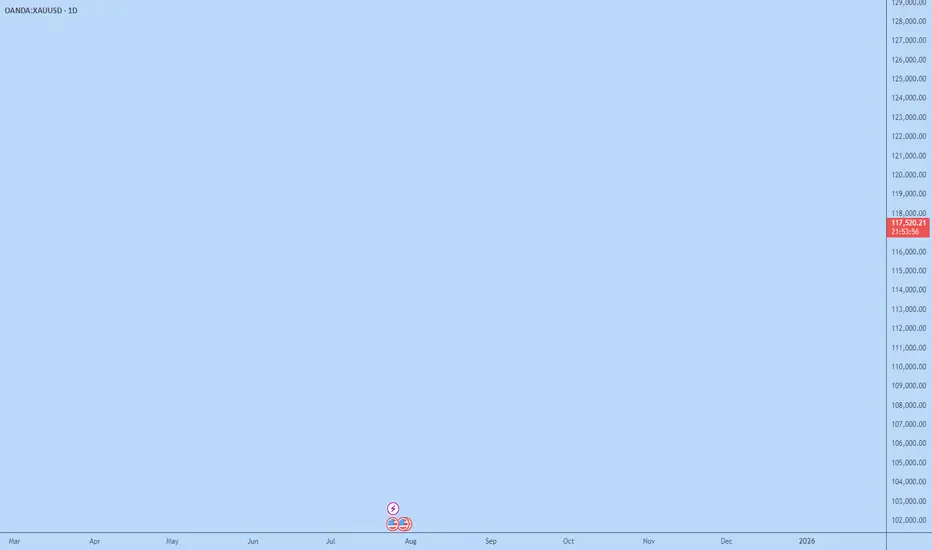
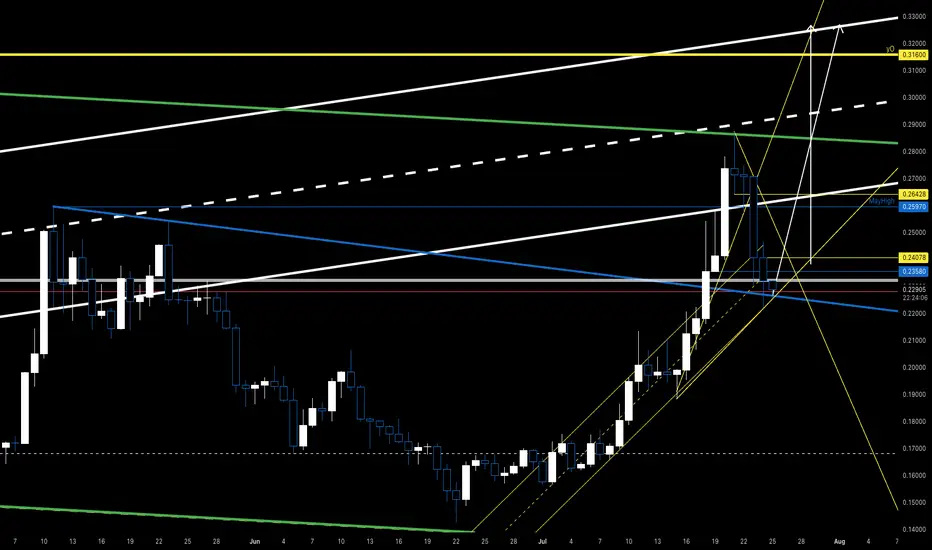
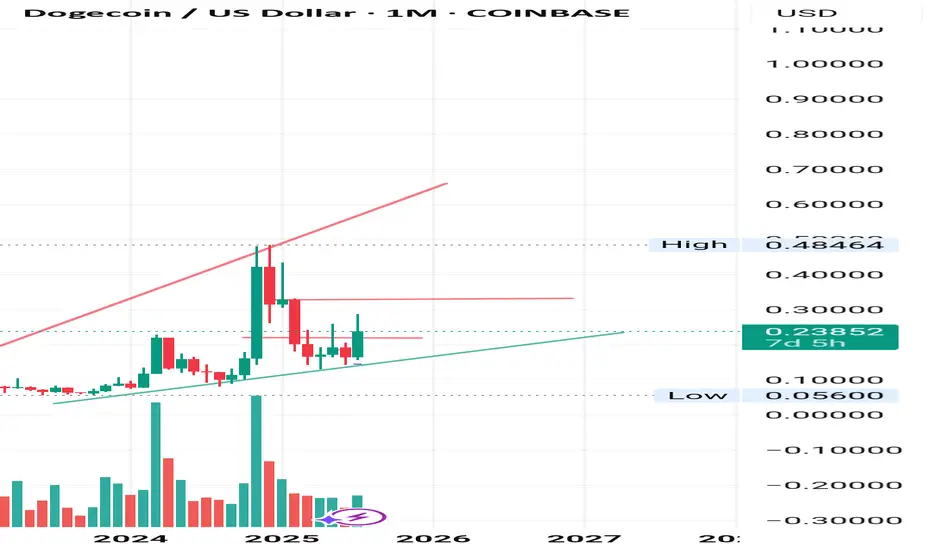
Doge update I'll be expecting a breakout to 0.33
If we can get past 0.35 I will be expecting a rally quickly.
Gold – 24 July: Watching H4 OB Zone for Bullish ReversalGold – 24 July Outlook
Watching H4 OB Zone for Potential Reversal
📌 Recap of 23 July Trade:
As outlined in yesterday’s analysis, the M15 Order Block ( 3417–3412 ) held well. The market reacted precisely from this level, and our long setup successfully hit the defined 120-pip target .
However, after reaching a high near 3434 , the price failed to break above and instead rejected sharply, breaking the recent M15 higher low — a key structural sign that signals the start of a possible H4 pullback phase.
🔍 Current Market Context:
Trend Overview:
While the overall bias remains bullish, this break of M15 structure suggests short-term weakness and a corrective move in progress on the H4 chart.
Key Zone in Focus:
H4 Order Block Zone: 3359 – 3345
This is a critical zone to watch today. The market is currently trading around this area, and it could act as a potential reversal point where the uptrend resumes.
🎯 Trading Plan:
– Closely monitor the price action within the 3359–3345 zone.
– If price respects this zone and LTF (e.g., M1) shows signs of structure flip or ChoCH + BoS , it could present a fresh long setup opportunity.
– As always, only act on the trade if multiple confluences align — don’t anticipate, let the market confirm.
📈 Summary:
Bias: Watching for a bullish reversal from the 3359–3345 zone.
Setup Condition: Wait for clear LTF confirmation before entering.
Risk Management: Stick to 1:3 RR — 40 pip SL and 120 pip TP as per system.
Let the market come to your setup. Patience is your greatest edge.
📘 Shared by @ChartIsMirror

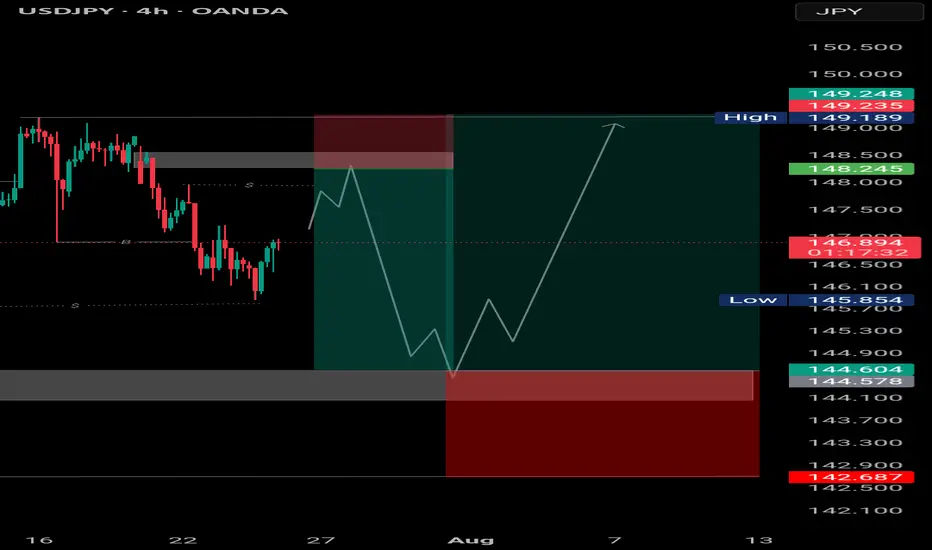
Sell to Buy UJ"USDJPY 4H Setup: Waiting for liquidity sweep below 145 before targeting 148.2+ 📈
Patience is key — let price come to you. Watching demand reaction closely before executing
ETH/USD Harmonics forecast. We are still studying it's trend, looks like the next move is going to be toward downwards, temporary.
