Beyond Technical Analysis

BCHUSDTBitcoin Cash making correction move, it will going up again?
if break low (strong low) BCHUSDT switch trend 📉

Sonic (SUSDT) Technical Analysis – Key Resistance in Play!🚨 Sonic (SUSDT) Technical Analysis – Key Resistance in Play!
Sonic (SUSDT) is currently struggling to break through the key resistance zone at 0.3512, showing signs of weakness from buyers.
📉 If the downtrend continues, major support levels are clearly highlighted on the chart. Watch closely for 0.1522 and then 0.1292 as critical zones where price could react.
🔥 On the flip side, if Sonic manages to break and hold above 0.3520, we could see a bullish move toward 0.3783 and 0.3968 as the next targets.
🎯 This is a crucial level where the next major move could begin. Stay alert — great opportunities often start with smart analysis.
👉 If you like clean charts, real analysis, and no hype — follow me for daily updates on altcoins like Sonic, ETH, BTC, and more!

BNBBTC (Binance Coin vs Bitcoin) New All-Time High & 2026 BullI've been looking at Binance Coin vs Bitcoin and this chart has some pretty interesting dynamics, quite unique I should say. This can be a great opportunity for what is about to happen.
In the last bull market BNBBTC produced massive growth, the most interesting part is the fact that it continued to grow even during the bear market. Not that it lacked during the bull market and then grew during the bear market, but it grew strongly in early 2021 and continued to grow through 2022 while everything was going down. BNBBTC peaked only in November 2022 when Bitcoin hit bottom.
If we get some similar dynamics in this cycle, we can imagine BNBBTC starting to grow now, together with the rest of the market. When the bull market ends, all-time high, Bitcoin is going to 1M+ etc., then BNBBTC continues growing as the bear market unravels. This is because people tend to use BNB to store value and also because trading, market activity and engagement shoots up after the bullish cycle is over. Everybody, their mothers and cousins become professional traders and gamble everything away. This process can take an entire year... When all the money that was earned through the bull market is lost, then we get the bear market bottom and the cycle repeats.
At this point many people will be selling and giving up, but that would only be the start. November 2022 vs November 2026. Ok... That is too far away, let's focus on this present day.
Binance Coin vs Bitcoin, BNBBTC, produced a major low December 2023 and a higher low February 2025. December 2023 marked the end of the bear market for this pair. February 2025 confirms the bearish wave is over; the downtrend is no more.
We have a transition period, consolidation for more than a year. From the bottom we grow.
I am expecting a new all-time high on this pair and this is an easy guess. The only danger Binance was facing came from the previous administration, before Trump. Now that the Cryptocurrency hating crowd is gone, we can aim to the top and beyond. There is no limit to how far up anything Crypto can go. Truly... This is only the start...
It is still early
Notice how some pairs are really high and very advanced on their bullish cycle. Notice how other pairs are still trading at bottom prices. Pairs like this one can be approached easily, with low risk with 5X focused on the long-term. Very low risk with a high potential for reward... Never chase a rising wave. It is better to look for one that is yet to start.
Imagine if you were surfing. Would you be able to join a wave that is already pretty advanced? It can end your life. But if you glide patiently on your board looking around to catch a newly developing wave... It would be an awesome ride and your enjoyment is secure, guaranteed and safe. Catch the early wave.
There are endless opportunities in this market.
Your continued support is appreciated.
Crypto is the future of finance.
Crypto is the evolution of the Internet.
.....
Oh and by the way, the same dynamic I mentioned here between 2021 and 2022, also happened in 2018-2019. This means that there is high probability that BNBBTC will continue growing beyond the 2025 bull market. It is likely to grow during the bear market as well.
There are always several pairs that are used as a hedge. Finding those ahead of time can make a huge difference on how strong your portfolio remains during the bear market. I will be recommending selling though but not 100%. We will be selling around 60-70% and the rest we keep invested regardless of what happens. We are Crypto, we love Crypto and we support he market.
Namaste.

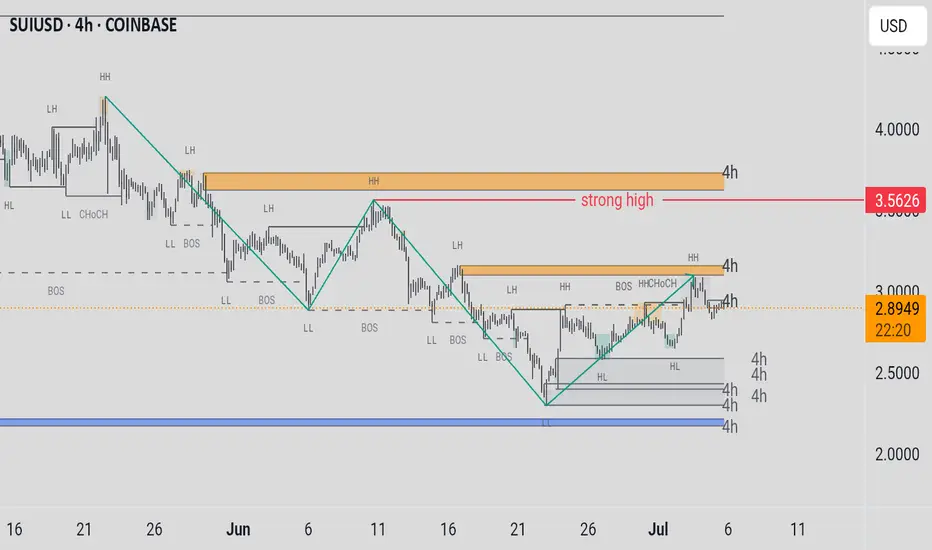
SUIUSDTPrice Levels: The current price is around 2.445 USD. A "strong high" resistance is marked at 3.5626 USD, with a higher high (HH) near 3.8917 USD.Support and Resistance:Support zones include 2.8917 USD, 2.445 USD (HL), and a lower support around 2.500 USD.Resistance is strong near 3.5626 USD, with potential resistance up to 4.000 USD.Trends: The chart shows a downtrend with lower lows (LL) and lower highs (LH) until recently, where a break of structure (BOS) and higher high (HH) suggest a potential reversal or consolidation. The price is currently testing the 2.445 USD support.Patterns: Annotations like "CHOCH" (Change of Character) and "BOS" indicate shifts in market structure, hinting at possible bullish momentum if support holds.
potential to short selling:
BTC - Zoomed Out ScenarioAs predicted DXY has broken down a major monthly bearish trendline - currently finishing a bearish retest before further free fall.
If this plays out we have 2-3 years of a weakening / correcting dollar, and a strengthening investment in assets such as Bitcoin.
This means an extended bull market spanning 2-4 years on Bitcoin and equities.
However - there is a mass amount of liquidity to the uber lows towards 10,000 on BTC.
Market is showing manipulated intention to hit these lows by keeping the price below this bearish cross section - and that’s why bitcoin hasn’t been moving up yet.
This tells me this is more likely than we all think to play out.
I’m trading the following:
Short - 108,200 to 35,000
Long - 35,000 to 80,000
Short - 80,000 to 10,000
Will update accordingly if the plan changes.
Happy trading.

ETH / USDC Liquidity Pool RangeTightening up the range a little. Looking good with horizontal lines setting the new range.

$NSE:NIFTY is Going to Burst Up Side ! SkyRocketing TIme is NearNSE:NIFTY is Going to Burst Up Side ! SkyRocketing TIme is Near
NIFTY 50 BULLISH REVIEW (My View) 💥
📈 Current Bias: BULLISH
✅ Nifty 50 showing strong resilience above key support levels.
✅ The index is holding well above recent consolidation zones and looks ready for further upside.
✅ Momentum indicators (like RSI) are staying in positive territory, showing sustained strength.
✅ Higher highs & higher lows structure intact on daily chart — bulls in control!
🔑 Key Levels:
👉 Immediate support: 23,333 - (watch for buying interest here)
👉 Resistance ahead: 23,850 - 23,900 (break above = fresh rally potential)
🌟 What I’m Watching:
🚀 Breakout above 23,900 could open doors towards 24,200+ levels in the coming sessions.
🚀 Strong sector participation from banks, IT, and autos — a broad-based rally is a positive sign.
🚀 Keep an eye on global cues + FII activity — may add fuel to the trend.
NSE:NIFTY is Going to Burst Up Side ! SkyRocketing TIme is Near

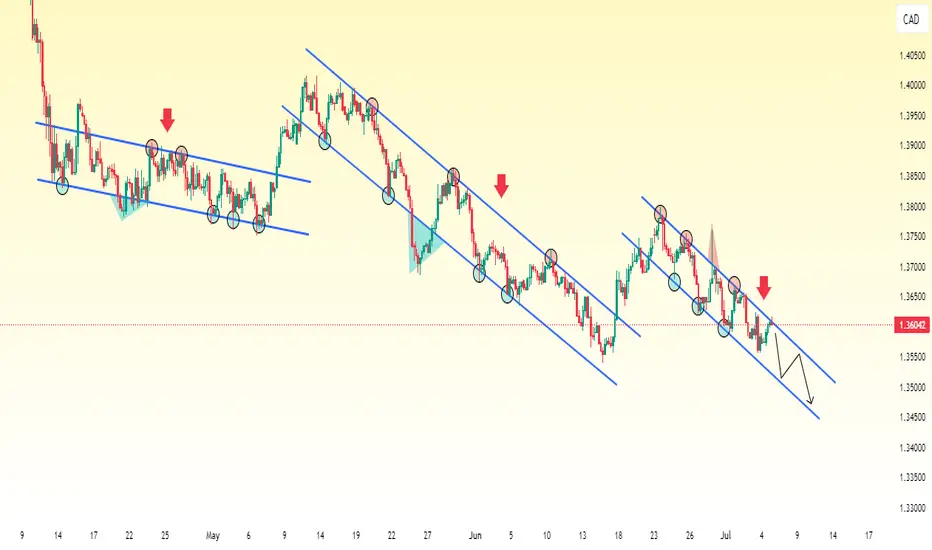
USD/CAD in a Strong Downtrend – Lower Channels Keep FormingUSD/CAD is currently in a strong bearish trend, forming a series of descending channels.
The price initially moved lower within a downward-sloping channel, then broke out to the upside, suggesting a reversal or deeper correction. However, this breakout was short-lived.
Instead of continuing higher, USD/CAD lost momentum and began forming a new descending channel, resuming its bearish movement. This pattern has repeated, each time the price breaks out upward, it quickly shifts back into a new downward channel, making lower lows each time.
This behavior indicates a bearish continuation structure, where temporary upward moves are corrective in nature and serve as setups for the next leg down. The consistent formation of new lower channels after brief pullbacks reflects ongoing selling pressure and trader sentiment favoring the downside.
SOLANASolana market Structure:
how the next move
I think solana will going down, potential to short if not break strong high

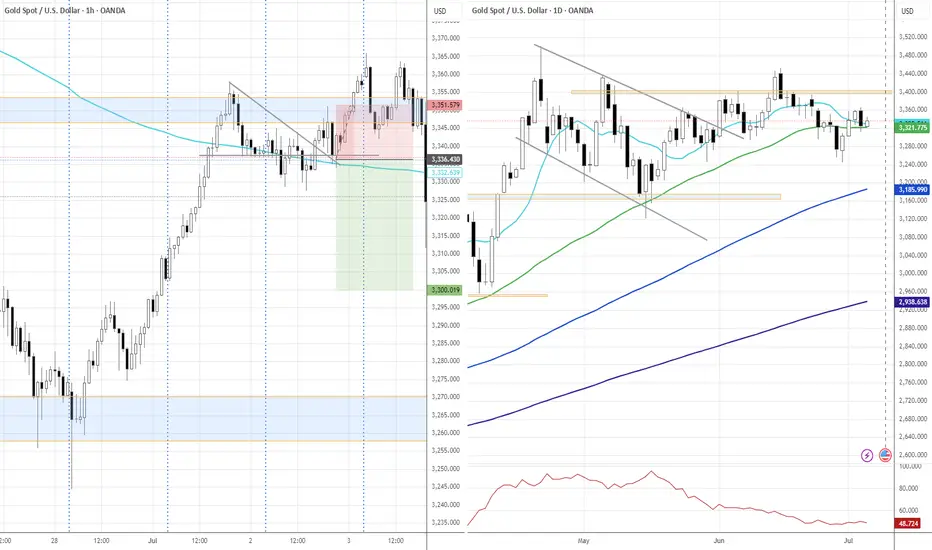
XAUUSD H4 Outlook – July 7, 2025“You don’t chase gold. You set the trap, then wait.”
👋 Hey traders — we’re gearing up for a new week on gold, and the H4 chart is starting to speak clearly. After Friday’s clean push into premium rejection zones, price is now compressing beneath a key supply block. Structure is fragile, and the next move will likely come fast.
Let’s position with precision before the breakout.
—
🔸 H4 Bias
Structure remains bearish short-term, with clear lower highs forming below a major supply at 3344–3351.
The broader bias leans neutral as we trade between unmitigated demand and inducement-heavy resistance. Confirmation is everything.
—
🔴 Supply Zones (Sell Areas)
3344–3351
→ H4 Fair Value Gap + OB combo inside premium
→ If price wicks above recent highs and rejects here, it could trigger a clean swing sell.
3380–3394
→ Origin of the last bearish leg + liquidity wick
→ High-risk, high-reward rejection zone if price spikes impulsively this week (e.g. post-Fed tone or surprise volatility).
—
🟢 Demand Zones (Buy Areas)
3265–3275
→ H4 FVG + flip zone + prior sweep level
→ If price taps and holds here, we may see re-accumulation for a move toward 3327–3340.
3235–3246
→ Strong unmitigated OB + discount level
→ Ideal sniper long zone only on clean rejection + structure shift (BOS on M15+).
—
🟡 Flip / Decision Zone
3299–3305
→ EMA50 + micro-range equilibrium
→ If price breaks and holds above this zone with strength, bias turns short-term bullish. If it rejects, continuation down is favored.
—
🎯 Execution Notes
EMA21/50 are acting as active compression bands — watch for rejection pressure
RSI shows no clear divergence yet — but volume is thinning
Liquidity is building above 3340 and below 3265 — prepare for traps both ways
—
🔚 Final Words
Sniper traders aren’t early — they’re precise. If you’ve been reacting too fast lately, this is your week to reset. Gold is telling a story here… but only structure speaks the truth.
🚀 If this helps bring clarity to your outlook, tap follow — we do this daily, with structure, not signals.
—
📢 Disclosure: I use Trade Nation’s broker feed on TradingView and I’m part of their influencer program.
📉 This is educational content, not financial advice.

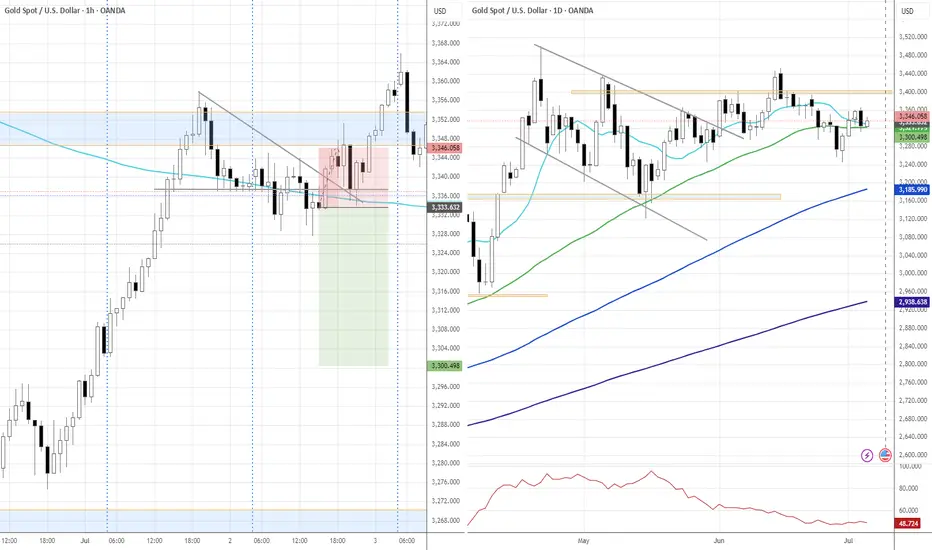
XAUUSD Daily Outlook – July 7, 2025👋 Hey traders, welcome to the fresh week! After the Friday selloff, gold is approaching a key inflection point. Let’s break down what’s happening on the Daily chart and how to approach it with clarity — no guessing, just precision.
Stay focused. The real opportunity is always in how you prepare.
🌍 Macro + Sentiment
Market remains sensitive to yield shifts and broader risk sentiment (BRICS summit also continues)
Price remains elevated in premium territory after months of vertical flow — but structure is finally showing re-accumulation or re-distribution?
📈 Daily Bias
Neutral to bearish until the 3330–3344 zone fully flips cleanly as support
Structure shows lower highs, strong wick rejections in premium zones, and a need for confirmation
🧠 What the chart tells us:
Price is compressing between a D1 FVG (below) and unfilled premium OB (above)
Friday’s low wicked into a small imbalance — but was not a clean tap into the main OB
RSI is midrange, EMAs are flat, and momentum is indecisive
We're either gearing up for a bullish FVG reclaim or prepping for a deeper drop into discount
⚠️ Key Zones to Watch
🔵 Support Zones (Buy Zones)
3230–3208
→ D1 Fair Value Gap + unmitigated bullish OB + discount pricing
→ Valid only with clean bullish rejection. High interest for sniper entries if price returns.
3170–3154
→ Untapped daily OB + historical support wick + aligns with deeper discount zone
→ Stronger bounce zone if 3230 fails. Confluence with fib retracement & RSI likely oversold here.
🔴 Supply Zones (Sell Zones)
3420–3450
→ Premium FVG + D1 OB combo + previous bearish rejection wick
→ High probability inducement area. Valid only if price fails to hold 3344 flip.
3388–3402
→ Minor supply + internal structure break level
→ Short-term reaction area. Lower conviction but watch for rejection if price overextends.
🟡 Decision / Flip Zone
3327–3344
→ Former support now turned resistance
→ If this zone flips bullish and holds, bias shifts to continuation. If rejection occurs, confirms retracement deeper into discount.
✅ Conclusion
The market is entering a decision week — no rush. Let the chart guide you.
Clarity comes not from prediction, but preparation. This chart isn’t hindsight — it’s a live framework.
✨ Final Thought
If this chart feels clear, that’s because it was built with intention — not after the move, but before it happens.
The difference between noise and precision is structure.
And we don’t guess — we prepare.
🚀 If you appreciate detailed, real-time structure like this, hit follow and join the traders who value clean execution over hype.
💬 Drop your bias below — bullish or bearish this week?
📢 Disclosure: I use Trade Nation's broker feed on TradingView and I'm part of their influencer program.
📉 This is educational content and not financial advice.

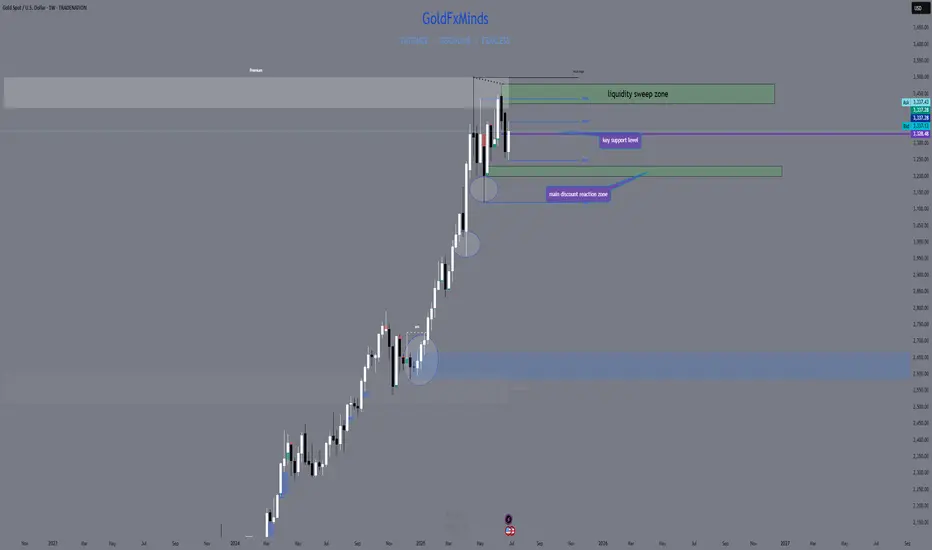
XAUUSD Weekly Outlook | July 7–11, 2025“The market always whispers before it roars. The wise trader listens to structure.”
Hello beautiful minds 💬
We enter the second week of July with strong macro undercurrents and new structure shifts beginning to show. While the U.S. celebrated Independence Day, the market quietly set up key zones for next week’s liquidity sweep.
🔸 Macro & Geopolitical Overview
🟠 Geopolitics: Tensions continue post-BRICS Summit, with a focus on further de-dollarization talks.
💰 U.S. Economy: Consumer credit and NFIB small business confidence to kick off the week.
🔔 Big catalysts:
Wednesday: Fed speeches (Mouslem, Waller, Daly)
Thursday: Unemployment Claims + Bond Auction
Friday: Federal Budget Balance (a key fiscal stress indicator)
📉 Expect spikes in volatility mid-week and dollar reactions post-FOMC speeches.
🔸 WEEKLY BIAS:
Still bullish to neutral, but momentum is cooling inside a premium rejection range.
Price broke structure to the upside in May-June, forming a new weekly higher high (HH) above 3380 — but failed to hold convincingly above the volume imbalance (void zone) around 3430–3480.
We are now rejecting premium and hovering just under the 3327 level — previous institutional support and the midpoint of the weekly FVG.
🔹 Weekly Key Zones
🟢 Support zone to watch (buy interest)
3204–3230 = Weekly FVG + equilibrium retrace + EMA50 rising
This is the main discount reaction zone. If price taps in with bullish PA, we look for bullish continuation toward 3327 then 3380.
🟡 Mid-level (decision point)
3327 = prior key support now acting as resistance
Watch how price reacts here — if it flips cleanly with a daily close, short-term bullish pressure may return.
🔴 Supply zone / resistance (sell interest)
3420–3480 = Weekly FVG + premium OB + liquidity sweep zone
This is the main premium rejection area. If tapped again without strong volume or fundamentals, this may fuel a swing short setup.
🔸 What This Means for You
This week is about patience and precision. The cleanest setups may come after volatility spikes during Fed speeches. Structure will tell — but emotional control will confirm.
If you feel like you’ve been chasing trades lately… this is the week to reset.
Focus only on sniper setups. Wait for them to form. Let others rush.
🔚 Final Words from the Team
Clarity beats chaos. Always. This weekly map is your compass — now it’s your job to wait, watch, and act with precision.
🔔 Follow GoldFxMinds for structured gold planning that respects both price and time.
🗨️ Drop a comment with your bias — bullish or bearish this week?
—
📌 Disclosure: This analysis is for educational purposes only and reflects market structure at the time of writing. No financial advice.
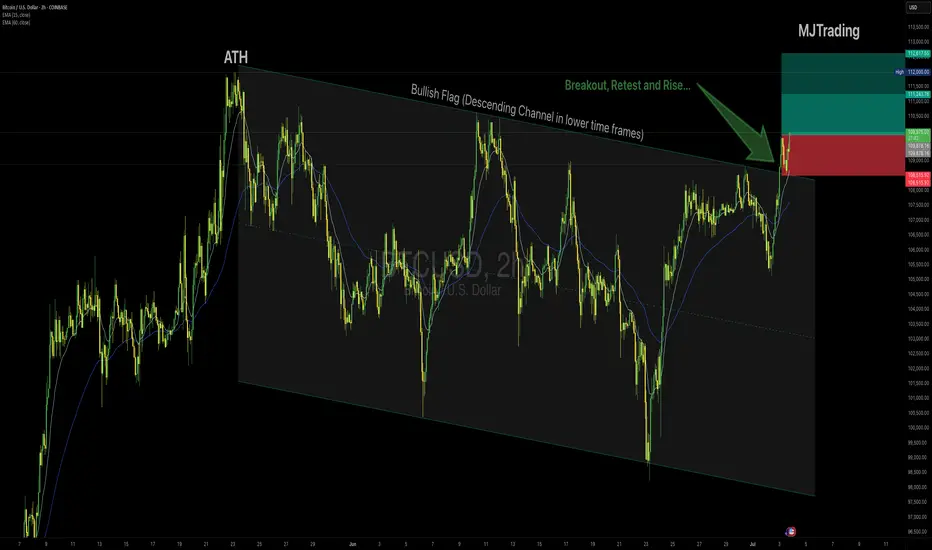
Bitcoin(BTC/USD) Daily Chart Analysis For Week of July 4, 2025Technical Analysis and Outlook:
During this week's trading session, Bitcoin rebounded from our Mean Support level of 104900 and, with significant momentum, subsequently completing the Mean Resistance level of 110300. Currently, the cryptocurrency is poised for a continuation of its downward trajectory, with a target set at the Mean Support level of 105500. This downward trend may necessitate heightened resilience to address the Key Resistance point at 111700 and the emerging historical price action of the Outer Coin Rally at 114500 and beyond. Nonetheless, it remains essential to acknowledge the possibility that current prices may experience an uptick from this juncture, bolstering the rally mentioned above.

Why You Still Lose Money Even With Perfect AnalysisYour setup was on point, your entry was clean, your stop-loss was tight.
Everything looked perfect.
And yet, you still lost.
Maybe the real issue isn’t in your chart, maybe it’s in your head.
Hello✌
Spend 3 minutes ⏰ reading this educational material.
🎯 Analytical Insight on Ethereum:
BINANCE:ETHUSDT is currently trading inside a well-defined parallel channel 📈. It is approaching a key daily support level that coincides with an important ascending trendline. A breakout above this channel could lead to a bullish move, targeting at least a 16% gain with a primary resistance zone near $2900 🚀. Monitoring how price reacts around this area will be critical for confirming the next leg up.
Now , let's dive into the educational section,
🧠 Analysis Is Half the Game
Having a clean technical analysis doesn’t guarantee anything if your behavior ruins it.
Most traders change their minds mid-trade because of fear, hope, or noise from other sources.
Market psychology doesn’t always respect your Fibonacci retracement. You might be right and still lose because you couldn’t hold on to the plan.
🕒 Don’t Enter Before the Market Does
Timing is underrated. Many traders get in too early. Your analysis may predict a breakout, but price isn’t ready yet.
Zoom out. A solid setup on the 1-hour chart might need confirmation from the 4-hour or daily.
A great trade is not just where you enter, but when.
😤 It’s Not the Chart — It’s Your Mind
Many times, the chart setup is perfect. But when price wobbles a bit, you lose confidence.
Imagine this: a clean uptrend, higher highs forming, but a small retracement hits and you close the trade. Why? Fear. Not logic.
You lost not because of analysis, but because you couldn’t handle being right under pressure.
📊 TradingView Tools: More Than Just Indicators
If all you're using in TradingView are the typical RSI or MACD indicators, you're barely scratching the surface.
Tools like Bar Replay can simulate real-time reactions to past price action, not just for backtesting, but for testing your discipline under real psychological pressure.
Try this: pick a point where you lost money despite solid analysis. Use Bar Replay and “re-live” the chart without knowing what happens next. Was your entry early? Did you panic exit? Or did your stop-loss placement ignore structure zones?
Also, use the Long/Short Position Tool to visually plan your risk/reward, and adjust your bias if the chart structure doesn’t validate it.
For those wanting a deeper layer, add Volume Profile Fixed Range to identify value zones, where whales are active, and overlay it with your own trade setup.
TradingView isn’t just a charting platform. It’s a behavioral mirror. You don’t just look at the chart, it shows how you act when money’s on the line.
🎯 Your Stop-Loss is for the Chart, Not Your Emotions
If your stop-loss is placed based on what feels safe rather than key market structure, you’re not trading the chart. You’re managing anxiety.
Let structure dictate where your risk lies, not your nerves.
😬 Not Executing = Not Trading
If you don’t follow through with your own trade plan, your analysis is meaningless.
Did you cut early just because a big red candle scared you? Or because someone tweeted a bearish take?
That’s not discipline, that’s reactive trading. It has nothing to do with your original logic.
📉 Losses Are Part of Trading… But Not These Ones
There’s a difference between calculated losses and emotional mistakes.
The first is expected, even professional. The second will drain your account and confidence.
Take losses when the plan fails, not when your emotions freak out.
🔍 Reverse-Engineer Your Entry Logic
Next time you trade, take a screenshot and write down your full reasoning.
Why this entry? What did you see? How will you exit?
Later, go back and compare it to what actually happened.
This habit alone can fix more issues than a dozen trading books.
💡 Perfect Analysis ≠ Profitable Trading
Analysis opens the door, but execution and consistency keep you in the room.
Most traders think the problem is their indicator, but it’s usually the part of themselves that doesn’t listen to the indicator at the critical moment.
🧠 The Power of “Logged Experience”
The real difference between amateurs and veterans isn’t screen time. It’s tracked behavior.
Use TradingView’s built-in Note feature, place icons or comments on every trade setup, and keep a record of your actual thought process.
That feedback loop is gold. It builds self-awareness, the rarest edge in trading.
📺 Make It Visual to Make It Stick
Don't rely solely on indicators.
Use Chart Pattern Drawing Tools, head and shoulders, flags, triangles, and reinforce visual memory.
Also, by managing Visibility Settings, you can keep your charts clean while viewing different structures across timeframes.
The result? You start to see the story behind price, not just numbers.
🔚 Final Thought
If you're still losing money with accurate analysis, maybe it’s time to analyze your reactions instead.
TradingView gives you the tools, but the real upgrade is learning to trust your system under stress.
✨ Need a little love!
We put so much love and time into bringing you useful content & your support truly keeps us going. don’t be shy—drop a comment below. We’d love to hear from you! 💛
Big thanks , Mad Whale 🐋
📜Please remember to do your own research before making any investment decisions. Also, don’t forget to check the disclaimer at the bottom of each post for more details.

EUR/USD Daily Chart Analysis For Week of July 4, 2025Technical Analysis and Outlook:
During the trading session this week, we witnessed the successful completion of the Outer Currency Rally at a level of 1.177. Recent analyses suggest that the Euro is likely to encounter a downward trend, with an initial target set at the Mean Support level of 1.168 and a potential extension to an additional Mean Support of 1.160. Nevertheless, it is crucial to acknowledge the possibility of a subsequent increase toward the next Outer Currency Rally level of 1.187 before any definitive downward movement transpires.

Wif scalp long to $0.8780Wif long
Stop: $0.8447
Tp: $0.8780
2.5RR aprox.
Time sensitive.
DTT price action strategy applied


BTCUSD – Long Setup (2H Chart)👆👆🚀🚀Boost it if you like it (Thanks)🚀🚀👆👆
Idea:
Bitcoin is breaking out above the descending Flag after testing the upper boundary multiple times, showing bullish momentum confirmed by price holding above the 15 EMA and 50 EMA. The breakout aligns with strong impulse candles and sustained buying pressure.
Entry:
✅ Buy near $110,000
Stop Loss:
🔴 Below $108,500, under the breakout structure to protect against a false breakout.
Take Profit:
🟢 Tp1 $111,245
🟢 Tp2 $112,600
Rationale:
Clear breakout of the channel top resistance.
Bullish EMAs crossover with sustained slope.
Strong impulse move suggesting continuation.
Risk Management:
Position size accordingly, max risk 1–2% capital per trade.
#Bitcoin #BTCUSD #CryptoTrading #Breakout #LongSignal #TradingView #TechnicalAnalysis
XAUUSD 02.07.2025 (reentry)+ US data (ISM, JOLTS) Beat
~+ Powell sounded a bit hawkish
~+ Timing: not much time is left until the end of the week because of Independence Day; USD is stretched down - expected profit taking
~- US BB Bill passed
XAUUSD 02.07.2025+ US data (ISM, JOLTS) Beat
~+ Powell sounded a bit hawkish
~+ Timing: not much time is left until the end of the week because of Independence Day; USD is stretched down - expected profit taking
~- US BB Bill passed

AUD_NZD WILL GROW|LONG|
✅AUD_NZD made a bullish
Rebound so we are bullish
Biased and we will be expecting
A further bullish move up
LONG🚀
✅Like and subscribe to never miss a new idea!✅
Disclosure: I am part of Trade Nation's Influencer program and receive a monthly fee for using their TradingView charts in my analysis.
