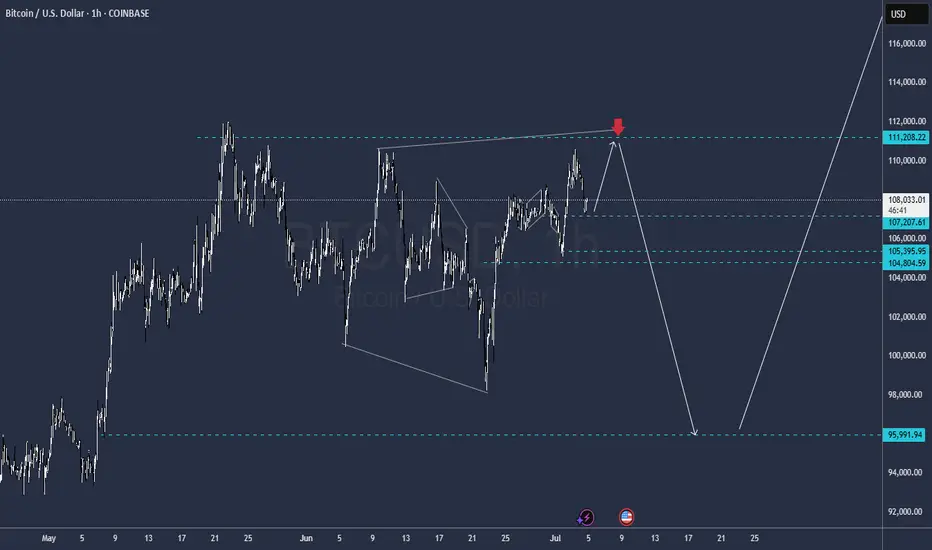
BTCUSDT PRICE PREDICTION If Bitcoin closes two consecutive candles below the 50 Moving Average with full body confirmation, then nothing can stop the price from dropping further — unless it eventually touches the 112,000 level.
Beyond Technical Analysis

AMP Grew 1,634% in 2023; What About 2025? Follow My ReasoningBetween October 2023 and March 2024 AMPUSDT grew 1,634%. So you could say this move—the one that I am mapping—the next move, is a continuation of the previous cycle, right? Wrong.
It is not necessary. The long correction and consolidation period with a flat base nullifies the previous cycle. We are back to square one. We are at the baseline level. Anything that happens now can be considered new.
Instead of a continuation of a previous period, a new phase/cycle can develop. So growth potential is not limited to past actions or happenings, everything is possible based on current market conditions which are great and getting better with each passing day. Ok? I think we can agree so let's continue.
The last strong bullish wave gave us a taste of what is possible. It showed us that 17X is possible even when the market is in a transition period, the recovery year I dubbed it. That is, 2023. And it was the recovery year because the market recovered from its 2022 bear market bottom.
2025 bull market targets
My aim would be the one around 1,547%. I show higher targets because it can go higher. I show lower targets because different people approach the market in different ways. If you want to aim for the maximum and aim high, you have the high targets. Those that want to get paid short-term also have some targets on the chart. But I am always somewhere in-between the high and the low.
I normally like 1.618 and 2.618. It all depends on which peak I use to plot the Fibonacci extension tool. If we are looking at projections based on the last wave, then the 1.618 is pretty standard and easy to hit, so we can aim even higher.
If we are looking at the last bull market, then going beyond 1.618 might be too optimistic.
I keep saying that it can go higher but truly, it is always the same. The biggest difference is due to inflammation, everything grows in a controlled way because it is not a crazy market, it is very well organized, everything is calculated so that the market can continue to grow and evolve long-term.
There is something for the serious, for the slow, for the fast, for the greedy, for the humble, for the grateful, for the ungrateful, for the egoist and for the spiritualist. There is a little bit of everything for everybody. That's Cryptocurrency for you. It is censorship proof.
They continue to attack us, to censor us and to block us on all fronts, but they have not found a way to block our Bitcoins... Uhhh. It is working just as intended. Peer to peer electronic cash, no middleman, no intermediary. The future of finance. Money for the age of the Internet.
Thanks a lot for your support.
Namaste.

Bitcoin UPDATEThe sell is @ 111.200
I think it still has to make a new high, sell is not ready just yet
levels highlighted
EUR/NZD Eyes Further Gains After 600-Pip RallyEUR/NZD became bullish after dropping to the 1.8850 area. Since then, the price has moved up by about 600 pips. Right now, it is at an important resistance level. If the price breaks above this resistance and holds, it could continue to rise toward the next target around 1.9650. This breakout could be a sign that buyers are still strong and aiming for higher levels.

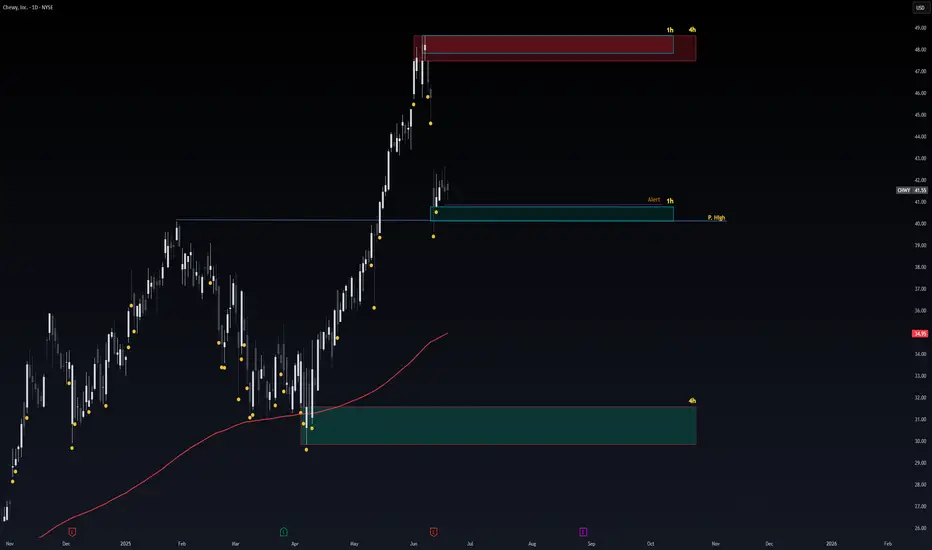
Safe Entry ZoneStock current at Support Level.
P.High's (Previous Highs) acts as good Support and resistance level.
1h & 4h Green Zone Is Buying Zone.
4h Red Zone is Selling Zone.
If No Buying Power at current Price level 4h is safest Entry Zone.
Note: 1- Potentional of Strong Buying Zone:
We have two scenarios must happen at The Mentioned Zone:
Scenarios One: strong buying volume with reversal Candle.
Scenarios Two: Fake Break-Out of The Buying Zone.
Both indicate buyers stepping in strongly. NEVER Join in unless one showed up.
2- How to Buy Stock:
On 15M TF when Marubozu Candle show up which indicate strong buyers stepping-in.
Buy on 0.5 Fibo Level of the Marubozu Candle, because price will always and always re-test the imbalance.
Avalanche 2025 All-Time High, Accumulation & Bullish ZonesI am using $495 as the next bullish cycle top. The 2025/26 bull market all-time high. It can be more but it can also be less. We can only guess at this point because the Cryptocurrency market is just so young that everything becomes possible. We err by being conservative.
Avalanche is trading within a long-term accumulation zone. The best possible prices, literally.
The purple-rounded bottoms on the chart denotes an excess.
This year, 2025, the accumulation zone was activated in February. The action then moved within this orange-zone in March and this is where everything is happening now.
If you wanted to put tens of millions of dollars into this project at the best possible prices pre-2025 bull market wave, then you would need to do it based on the long-term. Back in July-August-November 2024 and February, March, April, June and so on 2025.
If you were to buy too big too fast it would push prices up. So whales wait months in order to accumulate. After years of accumulation at low prices, they send the signal and the market can move. Once the market starts moving, the consolidation/accumulation period is over, there is no going back.
The "neutral zone" here is light blue. This is already bullish but not ultra-bullish because there is no continuation inside this zone. Only when Avalanche (AVAX) moves and stays above it we can get a new bull market cycle. Since it only happens every four years, like clockwork, there is no need to guess.
Pre-2021 we buy as much as we can and sell when prices are high up. Post 2021 bearish, SHORT, SHORT, SHORT. After 2022 comes the transition period, the long-term accumulation and consolidation phase. In 2025 is the next bull market, this is where we are at now.
So now we can buy as much as we can but only with the intention to sell when prices are up.
An investor does not sell, only buys forever more. But still, if you are an investor, you shouldn't buy when prices are high. The time is now to accumulate on everything.
A trader sells every few weeks, every few months. Each wave. Buy support (low) and sell resistance (high). Buy low (red) and sell high (green).
You need to know clearly if you are trading or investing. Getting things confused can result in loses. Getting this topic confused simply means lack of planning.
We are entering a major bullish cycle and wave. This is not the time to be a trader if you've never traded before. This is the time to invest, accumulate; buy and hold. Sell only when prices are astronomically high.
When the bullish cycle is over and if you find a pair trading at support, you can buy to sell again within weeks or months. But not now. Now, after you buy, you hold. Makes sense?
We are in this together.
I love you!
Your continued support is appreciated, truly.
Namaste.

Forex. Orderflow. [30.06--04.07]Covering forex pairs. Thoughts and weekly runs and GJ for possible expansion next week
Having a sore throat bear with that

Bitcoin's 4-year bullish cycle is coming to an end.The price reversal and manipulation zone could be between $120K and $133K, indicating a big bearish movement.
Quarterly analysis indicates a target of approximately $24,750.
QT + ICT + SMC
- Sainty

Ethereum Classic Long-Term Consolidation & The 2025 Bull MarketIt feels like we've been looking at the same chart for three years. Remember June 2022? A "small" 260% price bounce and we all did pretty good. Market conditions have not changed.
It's been three years and three years Ethereum Classic (ETC) continues to move, trade, sideways. A long-term consolidation phase.
The 2021 bull market was also preceded by a consolidation phase. This is marked on the chart.
The 2025 bull market is getting ready, we are still loading and I call for your patience once more but, you can know for certain that Cryptocurrency—the altcoins market—will meet all of your expectations and beyond.
The consolidation pattern has three major lows. June 2022, June 2023 and April 2025.
The last bull market produced total growth of 5,757% from bottom to top.
The current consolidation pattern has a technical triple-bottom. Higher lows each time but only by a few cents. We are only missing the bull market wave and bull run phase.
Think of something similar to what we saw between December 2020 and May 2021. Or, instead of a 6 months long bullish wave, we can get a 12-18 months long bullish cycle. Slow and steady growth.
It is likely to go fast because the consolidation phase has been so long. There is no need for long drawn-out bullish cycle, the market had plenty of time to test everyones patience and reset.
You know how Crypto goes, once it starts moving there is no going back. Nothing slow, fast and strong. That's my guess of course but I am open to seeing anything develop and I will update, adapt and change if something different happens.
One thing is certain, Ethereum Classic will grow.
We are getting closer with each passing day. The best is yet to come.
Namaste.

Bitcoin [BTC1!] Draw and Bias. 05.07.25, SaturdayLooking for bullish action on BTC. No stance on alts.

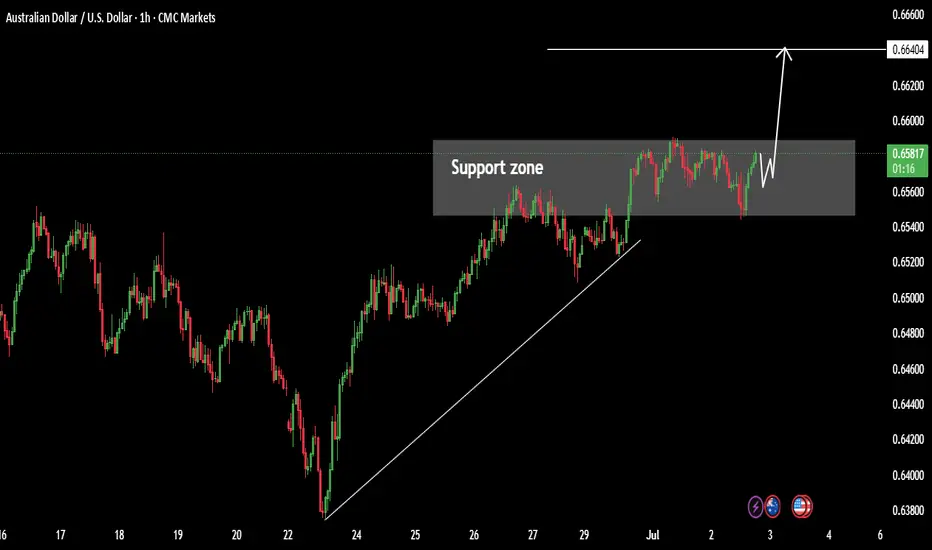
AUSUSD Breakout May continue GrowthAUDUSD Looking Precious High Bullish Pattern continue there Uptrend.
Here the some fallowing knowledge about AUSDUSD The dollar continues to bullish the global trend is clear and the price is testing multi year lows after yesterday Speech Powel the decline may continue AUDUSD is moving with in uptrend and move to our target ang catching there strong levels.
Resistance Levels 0.66400
Support Levels 0.65500
Hit the like if you find better analysis like this Hope this analysis is better for trading journey.
if you need any help about regarding trading and any Question share in comments.
Bitcoin will Bearish conformed Structureon Thursday Bitcoin Price briefly reclaimed at 110K this morning as macro tailwinds and institutional flows lifted crypto but analysis say clear catalyst is still needed to break all time high after the long impulsive rally earlier in the year.
BTC has been trading with in descending channel on the daily time frame looking after the Long time price will needs break and catch there Support 105K Level if the price stays below more then could next zone formed 102K
You may find more details in the chart i need support from you Guys And feel free to share your thoughts other views in the comments.

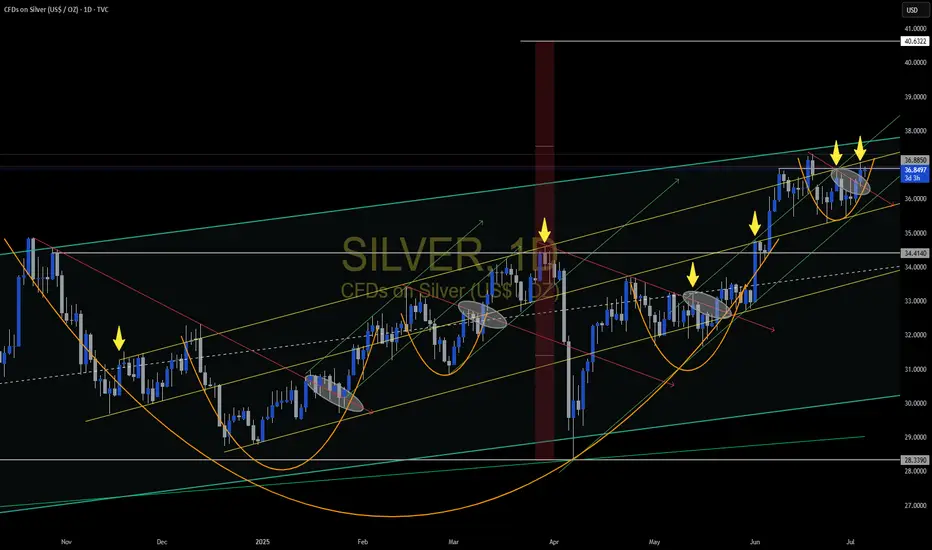
SLIVER Weekly patternJust another view from the weekly chart. To give confirmation of the daily bias

EUR_JPY WILL GO UP|LONG|
✅EUR_JPY is trading in an
Uptrend and the pair has already
Made a retest of the horizotnal
Support of 169.800 and we are
Already seeing a bullish rebound
So we are bullish biased and
We will be expecting a
Further bullish move up
LONG🚀
✅Like and subscribe to never miss a new idea!✅
Disclosure: I am part of Trade Nation's Influencer program and receive a monthly fee for using their TradingView charts in my analysis.

JASMYUSDT — Midterm Outlook | Buy & Sell Zones🚀 JASMY 2025-2026 Roadmap — What to Watch
Here’s my condensed view on SEED_DONKEYDAN_MARKET_CAP:JASMY for the next few quarters:
🔹 Q2 2025 (Jul–Sep)
Expect the alpha launch of the Jasmy App, first partnerships with local governments & sports teams, plus the big debut of JANCTION Mainnet L2, DEX and staking.
Could fuel a 20–40% rally on hype and fresh use-cases.
🔹 Q3 2025 (Oct–Dec)
Rollout of MyResume (HR-focused product), more JANCTION node sales and ecosystem build-out.
Should support a 10–20% steady appreciation if adoption shows up.
🔹 Q4 2025 – Q1 2026
Payments system to go live, aiming for 20,000 nodes, plus new banking & sports partnerships.
Could drive a 15–25% gradual climb into early 2026 if executed as planned.
💡 Bottom line:
This is shaping up as a multi-stage roadmap — short-term speculation in Q2, then more fundamentals in late 2025 to early 2026. If milestones hit and the broader market stays healthy, we might see a decent stair-step move higher.
🔥 Watching: JANCTION Mainnet deployment, real usage of MyResume, and partnership announcements.
👍 Like & drop your targets below if you’re tracking JASMY. 🚀 Let’s see how this plays out!
