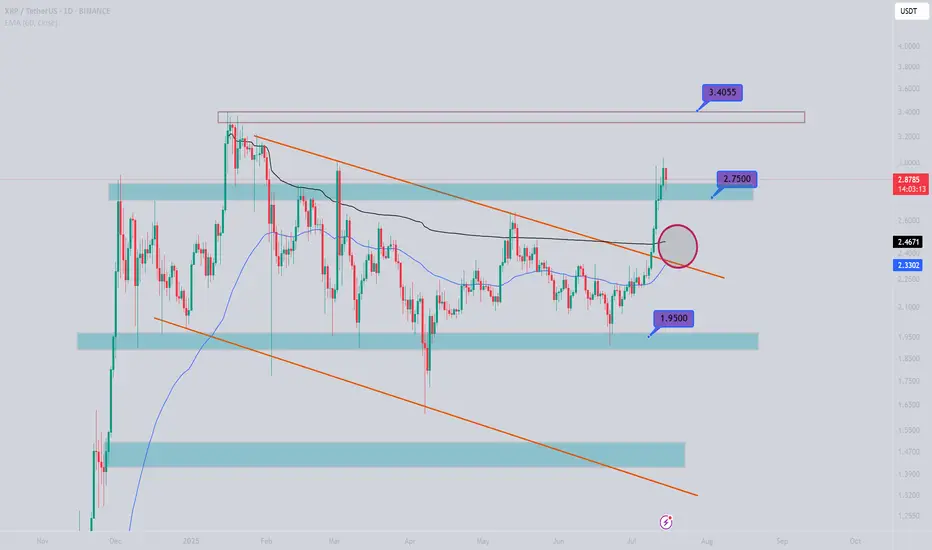
XRPUSDTEverything went according to the previous analysis and we reached the target of 2.7.
Taking profit at this point would be logical and the marked red area would be a worthwhile price to buy back in the long term.
Beyond Technical Analysis
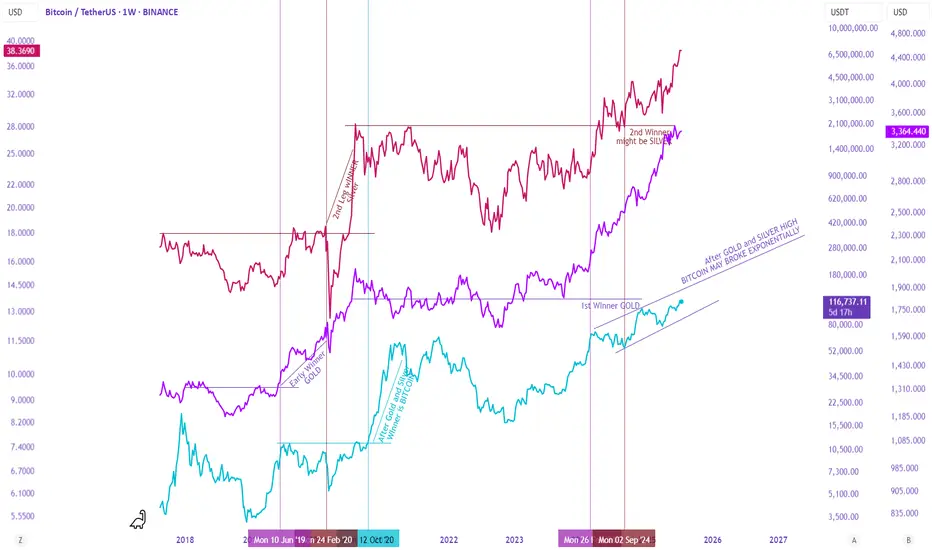
Gold, Silver, and Bitcoin – A Staggered Anti-Currency Rotation?There seems to be a complex yet recurring relationship between Gold, Silver, and Bitcoin during anti-currency phases (when fiat weakens).
First Leg – Gold Leads
Gold typically leads the first leg, breaking out to new highs. Silver follows but lags—trending up without breaking major resistance. During this phase, the Gold/Silver ratio expands.
Second Leg – Silver Takes Over
Eventually, Silver breaks resistance and becomes the second leg leader. As it outperforms Gold, the Gold/Silver ratio contracts back to mean.
Bitcoin, during this time, is usually bottoming or entering Stage 2 (early uptrend). This time, it has already broken resistance but is rising slower than in past cycles.
Third Leg – Bitcoin Dominates
As Gold and Silver peak and begin to correct, Bitcoin accelerates, often making new all-time highs (ATH).
This staggered rotation played out during the 2018–2022 cycle. Let's see if history rhymes in this cycle.
Gold/XAUUSD Analysis Breaks Bullish Channel – Targeting 3400+🟨 Market Context:
Gold (XAU/USD) has recently completed a significant technical move that signals the potential start of a strong bullish continuation phase. After a period of consolidation inside a descending channel, price has broken above key resistance levels and is showing firm buyer strength across the board.
🔍 Technical Structure Breakdown:
🔹 Descending Channel (Consolidation Phase)
For several sessions, gold was confined within a well-defined descending channel, which typically indicates a temporary correction in a broader bullish trend. This phase served as a liquidity-building zone where smart money accumulated long positions.
🔹 Breakout & Retest Confirmation
The breakout above the upper boundary of the channel was clean and impulsive, confirming bullish intent. This breakout aligned perfectly with a previous demand zone (now retested as support), adding strong confluence.
Key Breakout Zone: $3,330–$3,340
Retest Action: Price pulled back to test the breakout zone, respected it, and printed a bullish reversal.
This behavior confirms the “breakout–retest–continuation” pattern—highly reliable in trending markets.
🔹 SR Interchange – Key Pivot Zone
The level around $3,340 served a dual role:
Previously acted as resistance within the channel.
Now acting as support post-breakout (SR flip).
This interchange area is significant because it reinforces the idea that bulls are now defending this level aggressively.
🔹 Bullish Pattern Confirmation
A bullish price pattern has formed exactly at the SR zone and near the trendline. This double confluence (pattern + level) provides high-probability trade setups and confirms the entry point for buyers.
🔹 Ascending Trendline Support
An emerging bullish trendline is now guiding the move upward, confirming that the market has shifted its short-term trend. Every bounce on this trendline reinforces bullish structure and validates higher-low formations.
🎯 Price Targets & Expectations:
✅ Previous Target Zone:
Around $3,375, already tapped and respected.
This shows that gold is following technical targets with precision.
🎯 Next Bullish Target:
$3,400 – $3,410 zone stands as the next supply region.
This area is a major psychological resistance and aligns with historical reaction points.
🧠 Trading Insight & Strategy:
With current price action and momentum, buying dips remains the optimal approach, provided the price stays above the SR Interchange zone.
🔽 Entry Zone: $3,345 – $3,350
📈 Targets:
TP1: $3,375 (partial exit)
TP2: $3,400–$3,410 (final target)
❌ Invalidation Zone (Stop Loss): Below $3,330
Breaking below this would invalidate the breakout structure and possibly signal a false breakout.
📌 Summary:
✅ Clear breakout from descending channel
✅ Retest of previous demand and SR flip zone
✅ Bullish pattern confirmed on key support
✅ Ascending trendline intact
🎯 Next logical move: $3,400+
The gold market is giving strong bullish cues, and this setup could be a textbook example of “buy the breakout, ride the trend.”
Stay sharp, trade smart, and keep your risk in check. 👑

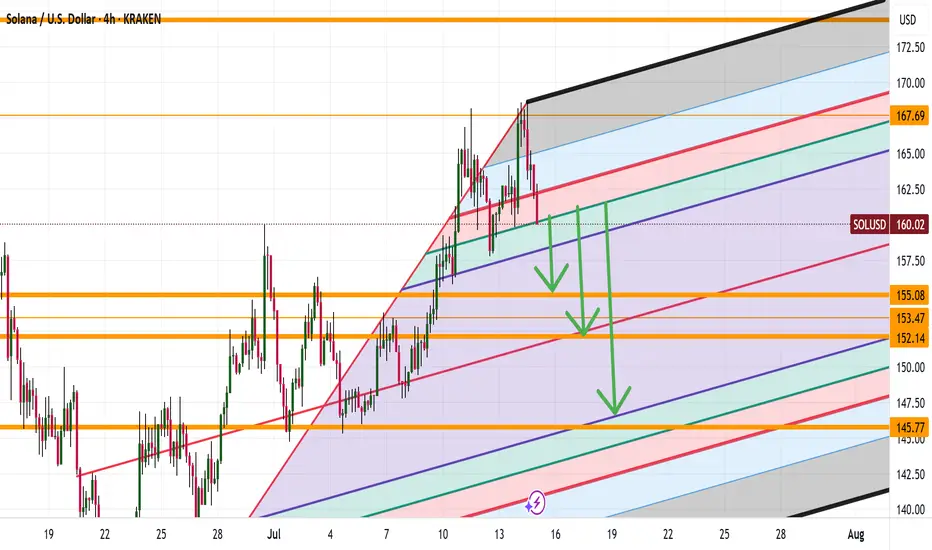
SOL DOWN TO 146 ? Is this possible? Good evening trading family
Based on what we are seeing here is a typical correcting of any good bull mark needed to sustain our movement upwards. Currently we have spotted 3 levels down to the 146 marker with a these of a bullish move upwards if they hold.
Happy trading folks
Kris/ Mindbloome Exchange
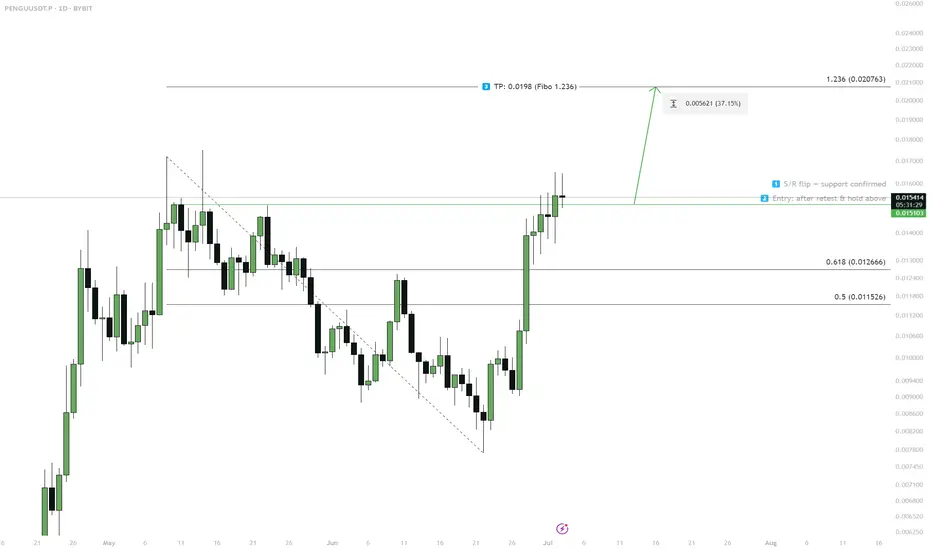
PENGU — S/R Flip & Breakout Scenario1. S/R flip at 0.0151 — wait for retest
2. Enter on successful hold above 0.0151
3. Target: 0.0198 (Fibo 1.236)
4. If fails to hold above 0.0151 — scenario invalid
SILVER (#XAGUSD): Correction is Over?! #SILVER (#XAGUSD): Correction is Over?! 🪙
It looks like 📈Silver has finally completed a consolidation within
a wide horizontal parallel channel on a daily.
A new higher high formation today indicates coming growth.
I suggest looking for trend-following buy from Monday.
Let the market close above the underlined resistance to let it set a Higher Close
as well.
Look for buying after a pullback, aiming at 38.0 as the first goal.
—————————
Daily time frame
—————————

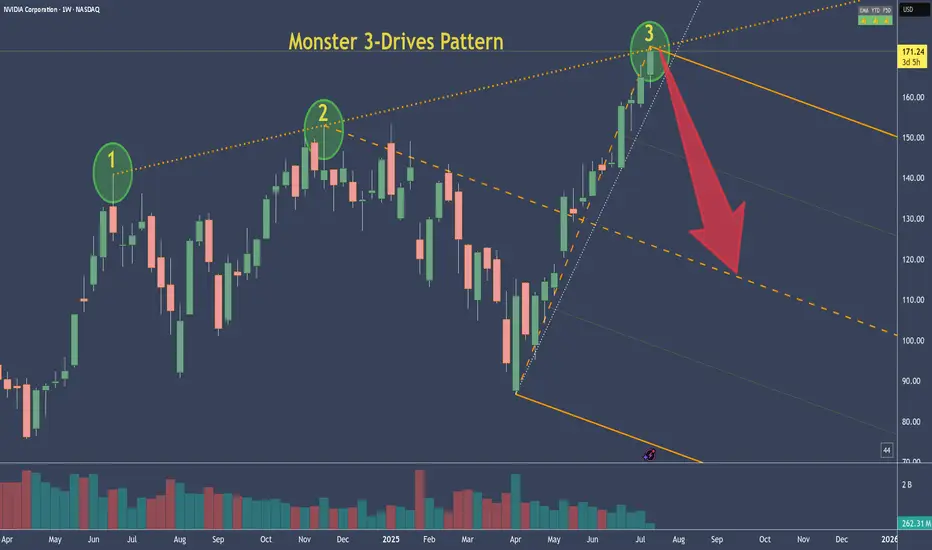
NVDA - NVIDIA's 3-Drive Pattern target if it plays outThis is the weekly chart of NVDA.
We can clearly see a 3-Drives pattern forming.
If this pattern plays out, the centerline would be my target. Of course, it's still too early to short.
But I’ve got my hunting hat on and I'm watching for signals on the daily chart.
One would be a break of the slanted trendline—but there are a couple of other conditions that need to align as well.
Always ask yourself: What if?
GOLD (XAU/USD) MA Breakout – High-Probability Long Setup!💰🚨 GOLD HEIST ALERT! XAU/USD MASTER PLAN (Thief Trading Style) 🎯
🔥 Steal Pips Like a Pro – High-Probability Gold Breakout Strategy! 🔥
🎯 Thief Trading’s GOLD Heist Strategy (Swing/Day Trade) �💸
👋 Hey there, Market Pirates & Profit Snatchers! 🌍✨
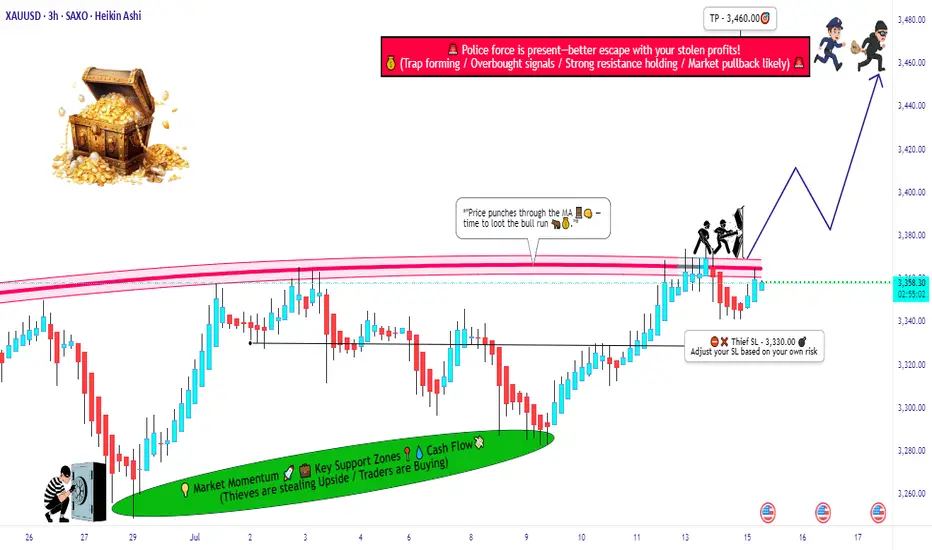
Based on our 🔥Thief Trading Style🔥 analysis, we’re plotting a major heist on XAU/USD (GOLD). The plan? Buy the breakout, escape before the cops (resistance) arrive! 🚔💨
📈 ENTRY ZONE: The Heist Begins!
🚀 "Wait for the MA Breakout (3400) – Then Strike!"
Bullish Confirmation: Enter on a 15M/30M pullback after MA breakout.
Thief’s Trick: Use Buy Stop above MA or Buy Limit near swing lows for best risk-reward.
DCA/Layering Strategy: Deploy multiple limit orders to maximize gains.
🔔 Set an ALERT! Don’t miss the breakout – thieves move fast! ⏳
🛑 STOP LOSS: Protect Your Loot!
📍 Thief’s SL Placement: 3330.00 (4H Swing Low) – Adjust based on your risk & lot size.
⚠️ WARNING: If using Buy Stop, DO NOT set SL until after breakout – unless you love unnecessary losses! 🔥
🎯 TARGET: Escape with the Gold!
🏴☠️ Take Profit Zone: 3460.00 (or Exit Early if Bears Show Up!)
Scalpers: Only trade LONG side – use trailing SL to lock in profits.
Swing Traders: Ride the wave but watch for resistance traps!
📰 MARKET CONTEXT: Why This Heist?
Neutral Trend (But Bullish Potential! 🐂)
Key Factors: Geopolitics, COT Data, Macro Trends, Sentiment Shift
🚨 News Alert: Avoid new trades during high-impact news – trailing SL saves profits!
💥 BOOST THIS HEIST! (Like & Share for More Pips!)
💖 Hit the 👍 Boost Button to strengthen our Thief Trading Crew!
🚀 More Heist Plans Coming Soon – Stay Tuned!
⚠️ DISCLAIMER (Stay Safe, Thieves!)
This is NOT financial advice. Do your own analysis & manage risk.
Markets change fast! Adapt or get caught.
🎯 Happy Trading, Pirates! Let’s Steal Some Gold! 🏴☠️💛

USD/JPY short: Clash of the TitansHello traders
I entered into a short GBP/JPY position last week after the contraction in GBP Industrial, manufacturing production and GDP. The United Kingdom is also struggling with their own version of the Big Beautiful Bill. The difference is of course that there is no Republican Congress there who is willing to throw their constituents under the bus by cutting Medicaid.
The technical side of USD/JPY is vanilla but the fundamental side is a whole other enchilada.
The sweeping tariffs from Liberation Day MAY become a moot market mover if the Federal Court of Appeals side with the International Trade Court after July 31st. It does not mean that all tariffs will become null and void. My previous IDEA elaborates a little on this.
The Israel/Gaza conflict is still simmering and has just been turned up a notch after an American/Palestinian was beaten to death by West bank settlers. Tragic.
There is no certainty how Iran may still retaliate against the USA after the nuclear site strikes.
The BIG one: President Donald J Trump is finally standing up to Vladimir Putin by announcing the shipment of Patriot missiles to Ukraine. This is a major milestone and turning point for President Trump who was previously under the impression that he can manage Foreign Policy by cozying up to the Russian and North Korean strongmen. Welcome to the real world. Putin, Xi Jinping and Kim Jong Un have been scheming behind your back to support the war against Ukraine.
This is the point where the fictional Dutch boy who used his finger to prevent a leaking dike to prevent a flood might be you, President Trump.
The safety and security of the entire Western World rests on your shoulders at this precise point in time. If Russia conquers Ukraine, it will only be a matter of time before the next European Sovereign country becomes a target. Should this happen, it will also serve as a proxy for the Chinese invasion of Taiwan. And North Korea invading South Korea. Bit of a stretch but not impossible.
Against this background, moving funds into the traditional safe havens of JPY, CHF and Gold make senses and I contend that BTC has joined the list.
Super long dated JPY 40Y bonds have also ticked up in anticipation of upcoming elections and conflicting policies.
The American people definitely do not have the desire or political will to enter into another war BUT it is maybe time for us to become the International Order Sheriff again. Towards this end, I am finally willing to call you my President and Commander in Chief, DJT.
Please be the Titan who does not pick on his own citizens and stand up to the real danger on our planet. Godspeed.

DOW (DJI) -- Preparing For The Next Big Move?Hello Traders!
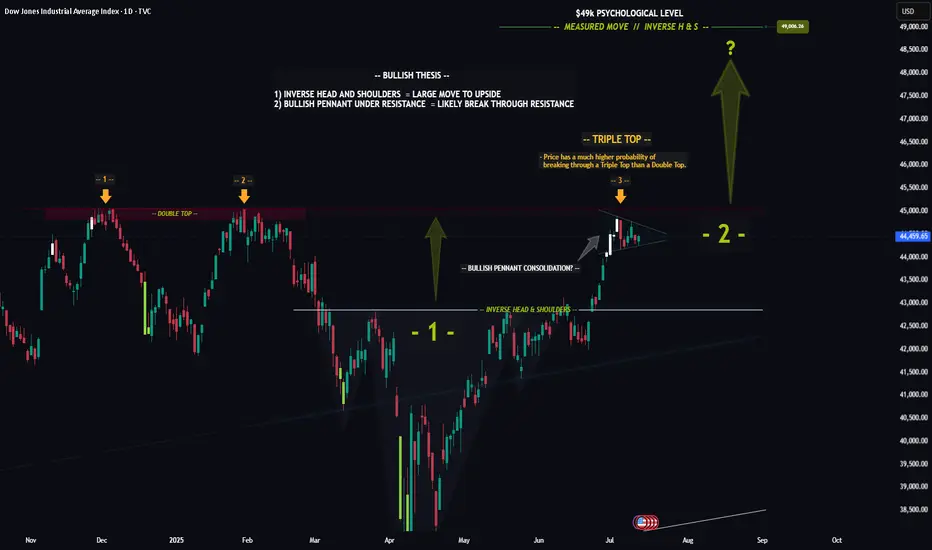
The chart of the DOW is really quite incredible... Recently price formed a textbook Inverse Head & Shoulders pattern, which led to a nice nearly to the all time high. Furthermore price looks to be consolidating in a Bullish Pennant just below the all time high resistance level.
The reason the Pennant below resistance is so significant is because this signals that investors are likely preparing to drive price higher to new highs. Think about it like a fighter resting before the next big fight.
Triple Top: In addition to the pennant price has now hit this resistance level for the 3rd time. The more times price hits a level typically the weaker it gets. After the 3rd hit the chance of a breakout increases dramatically.
In Summary: The "Triple Top" in conjunction with the "Bullish Pennant" means that there is undoubtedly a very high probability that price will breakout and make new all time highs.
This post is primarily meant to be educational vs a trade idea. Its charts like this that invigorate my technical analysis side and I hope it does for you as well.
Best of luck on your trading journey!
The key is whether it can be supported and rise near 300.17
Hello, traders.
If you "Follow", you can always get new information quickly.
Have a nice day today.
-------------------------------------
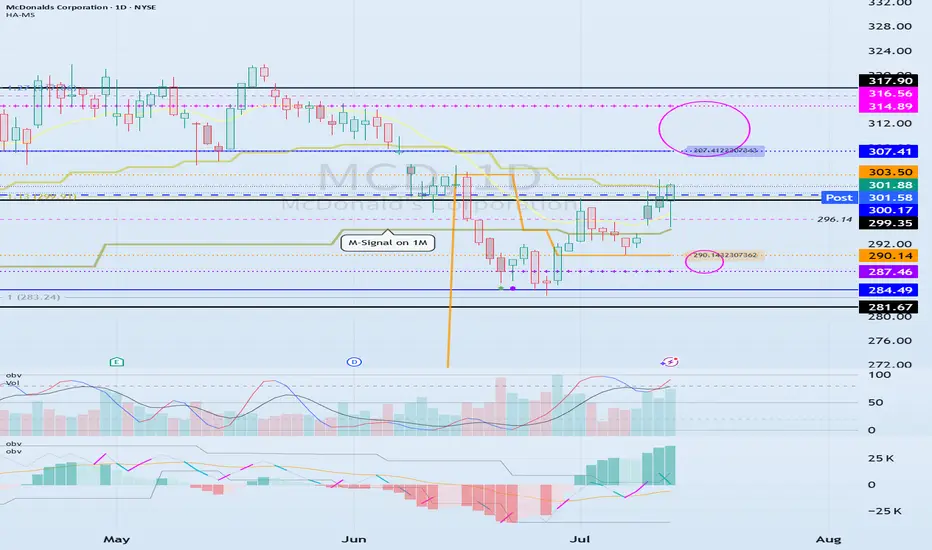
(MCD 1D chart)
Before following the basic trading strategy, the first thing to check is whether the current price is above or below the M-Signal indicator on the 1M chart.
If the price is below the M-Signal indicator on the 1M chart, there is a possibility that it will turn into a medium- to long-term downtrend.
Therefore, if possible, it is recommended to trade stocks whose prices are above the M-Signal indicator on the 1M chart.
If the price is below the M-Signal indicator on the 1M chart, you should respond quickly and briefly using the short-term trading (day trading) method.
-
The support and resistance zones can be seen as the 287.46-290.14 zone and the 307.41-314.89 zone.
The 287.46-290.14 zone is the DOM(-60) ~ HA-Low zone, and the 307.41-314.89 zone is the HA-High ~ DOM(60) zone.
These two zones are likely to form a trend depending on how they break through, so they can be seen as support and resistance zones.
-
The 300.17-316.56 zone is the HA-High ~ DOM(60) zone on the 1W chart.
Therefore, we need to check whether it can receive support and rise in the 300.17-316.56 zone.
Therefore, if it falls near the 307.41-314.89 range, you should check for support near 300.17.
-
If it rises above the HA-High ~ DOM(60) range, it is likely to show a step-up trend, and if it falls in the DOM(-60) ~ HA-Low range, it is likely to show a step-down trend.
-
Thank you for reading to the end.
I hope you have a successful transaction.
--------------------------------------------------
Hedge funds buy in is in playBesides hedge funds, options market is ringing bullish. Any supporting data anyone would like to share?
www.tradingview.com
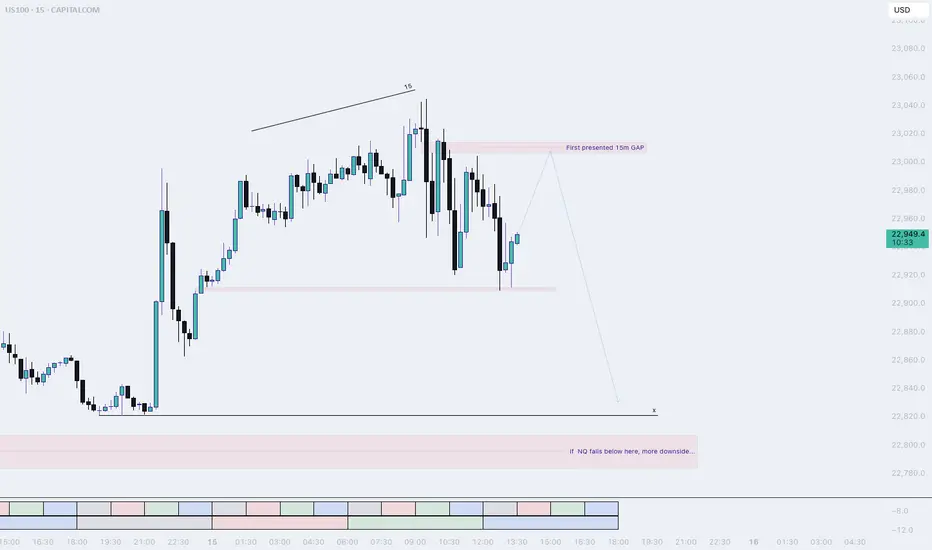
NQ, PM session (Tuesday) (long into short idea)Most likely price will make one more pullback before dropping into sell-side liquidity.
The laggish price action tells us that NQ is not really done IMO. I think a retracement into the 15m Gap is doable for NQ.
Keep watching NQ afterwards, We want to see a sudden drop to confirm our down movement.
A case for a EURUSD ShortPrice got rejected at the U-MLH.
DXY shows some strenght too:
A close below yesterdays low is a short for me.

BTCUSD - Exhausted? Second time rejected, now down.BTCUSD got rejected at the Centerline the second time. This is super bearish. If it's closing below yesterdays low, that's a clear short signal to me.
Taking 50% gains off the table is never bad. Because then you still have 50% if it's going up further. Otherwise, you got 50% booked.
Don't let gree eat your brain §8-)

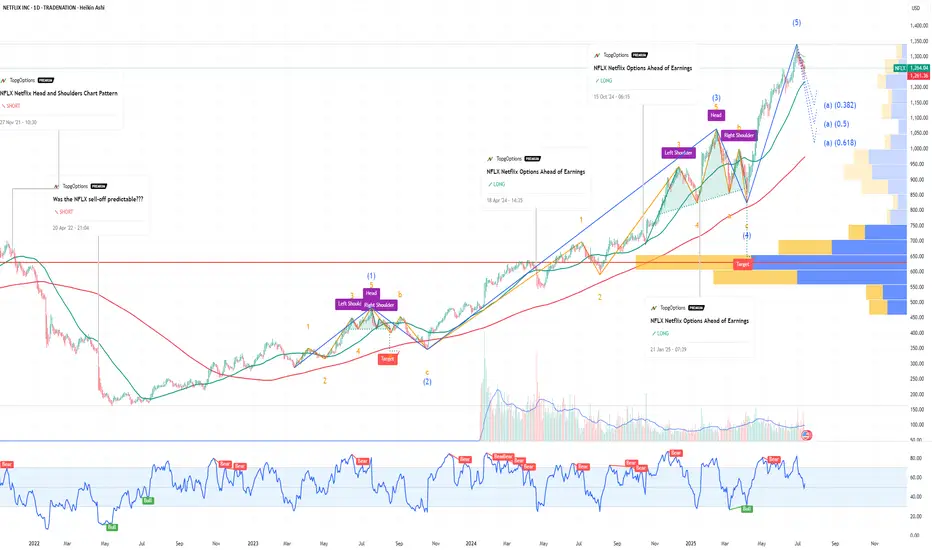
NFLX Netflix Options Ahead of EarningsIf you haven`t bought NFLX before the previous earnings:
Now analyzing the options chain and the chart patterns of NFLX Netflix prior to the earnings report this week,
I would consider purchasing the 1260usd strike price Puts with
an expiration date of 2025-9-19,
for a premium of approximately $71.10.
If these options prove to be profitable prior to the earnings release, I would sell at least half of them.
Disclosure: I am part of Trade Nation's Influencer program and receive a monthly fee for using their TradingView charts in my analysis.
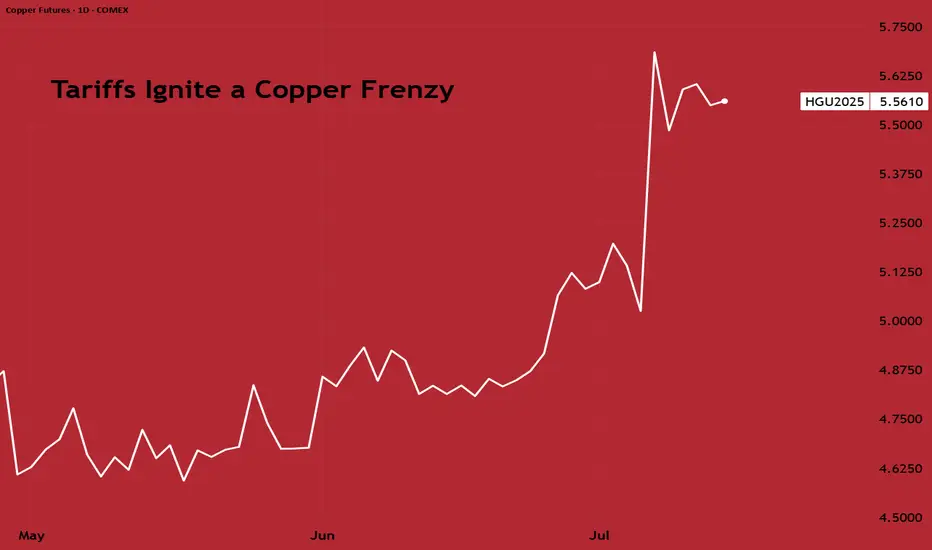
Tariffs Ignite a Copper FrenzyCOMEX copper has surged to a record premium over London Metal Exchange (LME) copper over the past few weeks, reflecting a lucrative arbitrage as traders rush metal into the U.S. ahead of looming import tariffs.
President Donald Trump’s announcement of a 50% tariff on U.S. copper imports (effective August 1, 2025) has dramatically disrupted the global copper market. U.S. futures are now trading at a significant premium of $2,600 per metric ton over LME prices, pulling physical copper into the US from around the world.
As a result, inventories have ballooned in U.S. warehouses while declining sharply elsewhere. COMEX (CME) stockpiles have surged to exceed the combined copper inventories of LME and SHFE (Shanghai), indicating massive stockpiling in the U.S.
Correspondingly, LME warehouse stocks have fallen to multi-year lows, fuelling a steep backwardation (near-term prices trading above far-dated futures) as available supply in London shrinks. LME–tracked inventories have declined by roughly 60% so far in 2025.
Source: Bloomberg
This tariff-induced distortion is also evident in trade flows. Analysts estimate the U.S. imported around 881,000 tons of copper in the first half of 2025, roughly double its underlying consumption, as buyers rushed to secure cheaper metal before tariffs hit.
Once the tariff is implemented and these stockpiles start being utilised, U.S. imports are expected to plunge and weigh on global copper prices later this year.
Going forward, clarity on the tariff’s scope regarding any exemptions for key suppliers like Chile or Canada will determine if COMEX Copper sustains a large premium.
CHINA'S PIVOT FROM HOARDING TO DRAINING
While the U.S. has been hoarding copper, demand in China, the world’s largest consumer, presents a mixed picture. On the one hand, China’s property construction sector remains sluggish, and manufacturing activity has only tentatively improved.
Earlier in the year, Chinese copper inventories surged to multi-year highs; an unusual build likely driven by weak consumption and precautionary stockpiling. However, this trend has since reversed sharply. Chinese copper stockpiles peaked around 377,000 mt in March before plunging to 126,000 mt by end-June.
This drawdown suggests that, despite macroeconomic headwinds, China’s copper usage remained resilient. Grid companies and manufacturers continued buying copper at high levels, even as consumer sectors slowed.
Source: Crux Investor
Copper demand in China is coming from strategic industries: State Grid investment soared nearly 20% YoY until May 2025, and manufacturing of electric vehicles and appliances remains a bright spot.
Owing to reduced demand in construction, though, the net effect for near-term demand remains somewhat on the softer side, but it is still far from collapsing.
Any further government stimulus for infrastructure or housing in H2 2025 could quickly translate into a bump in copper demand, given the low inventories now in China.
LONGER-TERM UPSIDE THROUGH SUPPLY CHALLENGES
Beyond the immediate cross-currents, the medium-to-long-term outlook for copper is fundamentally bullish, owing to the significant constraints on the supply side.
Many of the world’s largest copper mines are ageing, with declining ore grades and operational challenges.
In Chile (the top copper-producing country), Codelco’s output hit a 25-year low in 2023 amid falling grades and project delays. The state-owned giant is striving to boost production in 2025, but first-quarter 2025 output was essentially flat (+0.3% YoY), and was hampered by unforeseen disruptions like heavy rains and a nationwide power blackout.
Similarly, Anglo American, another major producer, has warned of lower production. Anglo expects its copper output to drop to 690–750 thousand tons in 2025, down from 773k in 2024, due to lower ore grades and water restrictions at its Chilean operations.
Due to the massive wedge between demand and supply dynamics, analysts have predicted the copper market to slip into a substantial deficit next year, even sans tariffs.
The recent tariff saga, creating all the noise, would exacerbate near-term tightness, and would lead to U.S. consumers drawing down global supply. This sets the stage for sharper shortages later.
Supply from recycling is also expected to take a hit due to the trade friction between China and US.
Source: Bloomberg
In response to the tariffs, China could cut back imports of US scrap copper. This would, in effect, reduce China's exports of refined copper, with less refined copper entering the global supply consequently.
This further strengthens the case for prolonged upward price pressure.
HYPOTHETICAL TRADE SET-UP:
For investors, the divergent short- and long-term forces in copper open several strategy avenues. In the very near term, prices may remain volatile or even pull back once U.S. imports pause, with others having increased access to the metal.
However, any such dip would present a buying opportunity given copper’s strong fundamentals. A straightforward bullish strategy is to establish a long position in copper futures, taking advantage of any weakness.
For example, one could go long the CME Copper futures (March 2026 expiry) to express a positive view on copper into next year.
Source: CME QuikStrike
Open interest for this contract lies just under 30,000, with volume as on 11/Jul clocking 3095.
The hypothesis is that after a period of consolidation, copper prices will resume an uptrend as the market shifts focus from temporary inventory builds to the looming supply deficit. Indeed, the term structure is also signalling tighter conditions down the line; while nearby copper prices spiked on the tariff news, longer-dated futures have also firmed as traders anticipate future scarcity.
Source: CME QuikStrike
With that in mind, a possible trade setup is outlined below:
● Entry: $5.68 per pound
● Target: $6.20 per pound
● Stop Loss: $5.37 per pound
● Profit at Target: $13,000 ((6.20 – 5.68) = 0.52 x 25,000 pounds/contract)
● Loss at Stop: $ 7,750 ((5.37 – 5.68) = -0.31 x 25,000 pounds/contract)
● Reward-to-Risk: 1.7x
The same view can also be expressed through CME Micro Copper futures, which offer smaller notional positions and more flexibility. Each Micro contract is priced in USD per pound and represents 2,500 pounds of copper, compared to 25,000 pounds for the standard contract.
As history shows, the “electrifying metal” tends to reward those who can weather short-term volatility in pursuit of its long-term uptrend.
MARKET DATA
CME Real-time Market Data helps identify trading set-ups and express market views better. If you have futures in your trading portfolio, you can check out on CME Group data plans available that suit your trading needs tradingview.com/cme .
DISCLAIMER
This case study is for educational purposes only and does not constitute investment recommendations or advice. Nor are they used to promote any specific products, or services.
Trading or investment ideas cited here are for illustration only, as an integral part of a case study to demonstrate the fundamental concepts in risk management or trading under the market scenarios being discussed. Please read the FULL DISCLAIMER the link to which is provided in our profile description.
BTC BIG SHORT!We did a mirror retest, and many other signals also point to a sharp decline, indicating numerological codes 69/96.

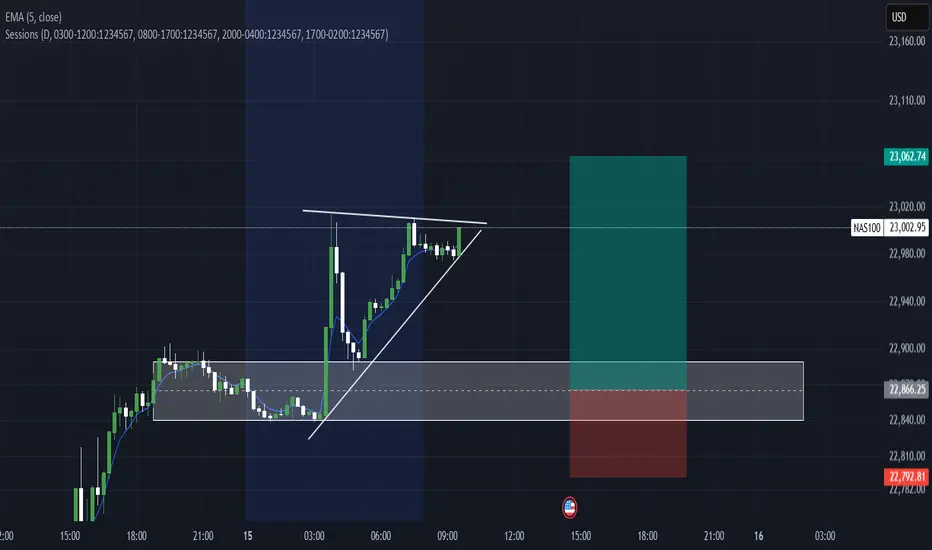
Nas100 Long We Currently Have an Ascending triangle (bullish continuation pattern) Forming After Asian Session & Price is consolidating just below the resistance level, forming higher lows.
We Have a Clearly defined demand zone below current price (gray box), Which also marks out our Bullish Order Block Formed Yesterday Which Price Should Come Retest Before Continuing Upwards.
Pro Tip for CPI Events
Expect increased volatility and fakeouts within the first few minutes.
Wait for a 5–15 min candle close for confirmation before entry.
Use lower timeframes (1m–5m) for entries, but keep higher timeframe structure in mind.
Remember To Like & Subscribe For More A+ Setups✅
deepseek→→U.S. Dollar Index (DXY) Recent Analysis and Outlookchina deepseek↓↓
### **U.S. Dollar Index (DXY) Recent Analysis and Outlook**
#### **1. Current Market Trends and Driving Factors**
- **Trade Policies Boost the Dollar**: U.S. President Trump recently announced new tariffs on Canada (35%), the EU, and Mexico (30%), triggering risk-off sentiment and pushing the Dollar Index (DXY) from 97.20 to around 98.00.
- **CPI Data as a Key Variable**: The U.S. June CPI data, released today (July 15), will influence market expectations for Fed rate cuts. Stronger-than-expected inflation could reinforce the dollar's rally, while weak data may weaken it.
- **Shift in Market Sentiment**: Unlike the "dollar sell-off" trend in early 2025, recent market reactions have leaned toward treating the dollar as a "safe-haven asset" rather than selling it solely due to trade war concerns.
#### **2. Technical Analysis**
- **Key Resistance and Support Levels**:
- **Resistance**: 97.80-98.00 (short-term critical range). A breakout could test 98.50 or even 99.00.
- **Support**: 97.50 (50-day moving average). A drop below may target 96.38 (June low).
- **Technical Indicators**:
- **MACD**: A golden cross has formed on the daily chart, but it remains below the zero line, suggesting the current rebound may still be corrective.
- **RSI**: Near the 50 neutral zone, not yet overbought, indicating room for further upside.
#### **3. Short-Term and Long-Term Outlook**
- **Short-Term (1-2 Weeks)**:
- **Bullish Scenario**: If CPI data is strong and DXY breaks above 98.20, it could challenge 98.50-99.00.
- **Bearish Scenario**: Weak CPI data or progress in trade talks may push DXY back to 97.30-96.50.
- **Long-Term (Second Half of 2025)**:
- **Structural Pressures Remain**: Despite the short-term rebound, the dollar still faces long-term challenges, including widening U.S. fiscal deficits, de-dollarization trends, and concerns over Fed independence.
- **Historical Trend**: After falling over 10% in the first half of 2025, DXY may continue its downtrend in the second half, though the pace of decline could slow.
#### **4. Key Risk Factors**
- **Fed Policy**: If CPI data reinforces a "higher-for-longer" rate outlook, the dollar may strengthen further. Conversely, rising rate-cut expectations could weigh on the dollar.
- **Geopolitics and Trade Talks**: Compromises from the EU or Mexico could reduce safe-haven demand, while failed negotiations may fuel further dollar gains due to risk aversion.
### **Conclusion**
The DXY is at a critical juncture, with short-term direction hinging on CPI data and trade policy developments. Technicals lean bullish, but long-term fundamentals remain challenging. Traders should closely monitor the 98.00 breakout and today’s CPI data impact.

AUD_CAD RISKY LONG|
✅AUD_CAD is trading in an
Uptrend and the pair made
A nice pullback and retested
The falling support so we are
Locally bullish biased and
We will be expecting a
Local bullish rebound
LONG🚀
✅Like and subscribe to never miss a new idea!✅
Disclosure: I am part of Trade Nation's Influencer program and receive a monthly fee for using their TradingView charts in my analysis.

MYM-FUTURES-US30- Retracement & ContinuationBias changed from July 13, 2025 to Bullish for a quick scalp. Tomorrow expecting some retracement and a possible move higher. Overall, Bais hasn't changed. Looking for a short into weekly FVG.
