gold on third pattern breakout#XAUUSD have multiple test the third pattern, now price forming needs to breakout the 3308 before any further movement.
Buy entry 3301.4, TP 3308-3323.
Below 3291 holds a very strong bearish continuation, if breakout price will fall till 3269
Beyond Technical Analysis

You've Already Lost: The Bitcoin Delusion of FOMO and False HopeLet’s get one thing straight: if you’re staring at Bitcoin, squinting past the red flags, and convincing yourself it’s not a Ponzi scheme because of that one shiny feature that screams “legit,” you’re not investing—you’re auditioning for the role of “next victim.” And if your motivation is the fear of missing out (FOMO) or the fantasy of getting rich quick, well... congratulations. You’ve already lost.
The 99%: Red Flags Waving Like It’s a Parade
Let’s talk about the indicators—the ones that make Bitcoin look suspiciously like a Ponzi scheme. No, it’s not technically one, but the resemblance is uncanny:
- No intrinsic value: Bitcoin isn’t backed by assets, cash flow, or a government. It’s worth what the next person is willing to pay. That’s not investing. That’s speculative hot potato.
- Early adopters profit from new entrants: The people who got in early? They’re cashing out while newcomers buy in at inflated prices. That’s the classic Ponzi dynamic: old money out, new money in.
- Hype over utility: Bitcoin’s actual use as a currency is minimal. It’s slow, expensive to transact, and volatile. But hey, who needs functionality when you’ve got memes and moon emojis?
- Opaque influencers: From anonymous creators (hello, Satoshi) to crypto bros promising Lambos, the ecosystem thrives on charisma, not accountability.
- Scam magnet: Bitcoin has been the currency of choice for over 1,700 Ponzi schemes and scams, according to a University of New Mexico study cs.unm.edu . That’s not a coincidence. That’s a pattern.
The 1%: The “But It’s Decentralized!” Defense
Ah yes, the one redeeming quality that Bitcoin evangelists cling to like a life raft: decentralization. No central authority! No government control! It’s the financial revolution!
Except… decentralization doesn’t magically make something a good investment. It just means no one’s in charge when things go wrong. And when the market crashes (again), you can’t call customer service. You can tweet into the void, though.
FOMO: The Real Engine Behind the Madness
Let’s be honest. Most people aren’t buying Bitcoin because they believe in the tech. They’re buying because they saw someone on TikTok turn $500 into a Tesla. FOMO is the fuel, and social media is the match.
Bitcoin’s meteoric rises are often driven by hype cycles, not fundamentals. Tesla buys in? Price spikes. El Salvador adopts it? Price spikes. Your cousin’s dog walker says it’s going to $1 million? Price spikes. Then it crashes. Rinse, repeat.
This isn’t investing. It’s gambling with a tech-savvy twist.
The Punchline: You’ve Already Lost
If you’re ignoring the overwhelming signs of speculative mania and clinging to the one feature that makes you feel better about your decision, you’re not ahead of the curve—you’re the mark. And if your motivation is “I don’t want to miss out,” you already have. You’ve missed out on rational thinking, due diligence, and the ability to distinguish between innovation and illusion.
Bitcoin might not be a Ponzi scheme in the legal sense. But if it walks like one, talks like one, and makes early adopters rich at the expense of latecomers… maybe it’s time to stop pretending it’s something else.
INDEX:BTCUSD NYSE:CRCL NASDAQ:HOOD TVC:DXY NASDAQ:MSTR TVC:SILVER TVC:GOLD NASDAQ:TSLA NASDAQ:COIN NASDAQ:MARA

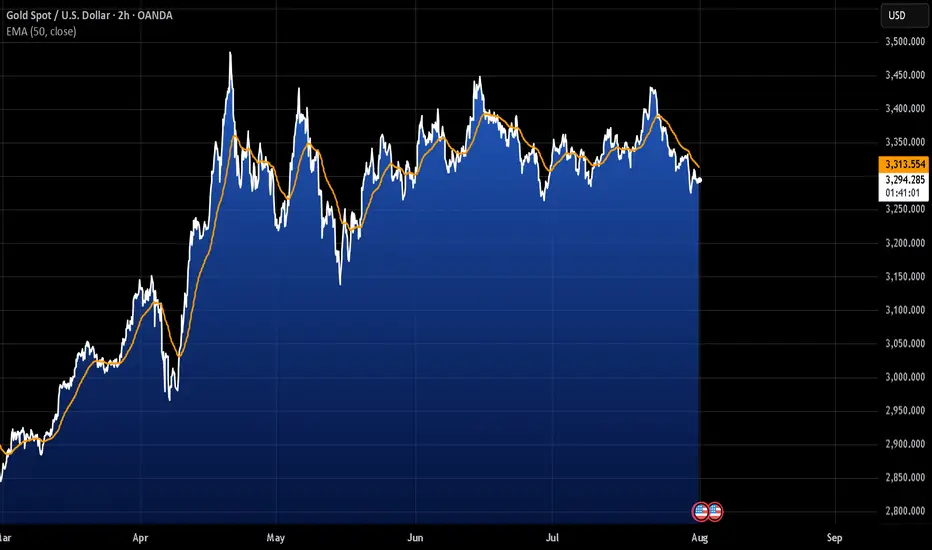
GOLD REMAINS UNDER PRESSURE AFTER U.S. INFLATION DATA📊 Market Overview:
Gold is trading around $3294, down from $3311 earlier after U.S. Core PCE and Employment Cost Index came in as expected — reinforcing the Fed's hawkish stance. A stronger dollar and rising Treasury yields continue to weigh on gold.
📉 Technical Analysis:
• Key resistance: $3302 – $3305
• Nearest support: $3285 – $3275
• EMA09 (H1): Price is below the 9-period EMA → short-term trend remains bearish
• Candlestick / volume / momentum: After the sharp drop, price is consolidating between $3293–$3298 with low volume. Failure to break above $3302 may trigger further downside. RSI near 45 suggests room for more selling.
📌 Outlook:
Gold may continue to decline in the short term if it fails to reclaim $3302 and the dollar remains strong through the Asian and European sessions.
💡 Suggested Trade Setup:
🔻 SELL XAU/USD: $3296 – $3298
🎯 TP: $3280 / $3275
❌ SL: $3305
🔺 BUY XAU/USD: $3275 – $3278 (if reversal candle appears)
🎯 TP: $3295
❌ SL: $3270


GOLD POSSIBLE SHORT (LT Buy Oriented)Things are starting to calm down. Gold might see a shift in demand and calm down.
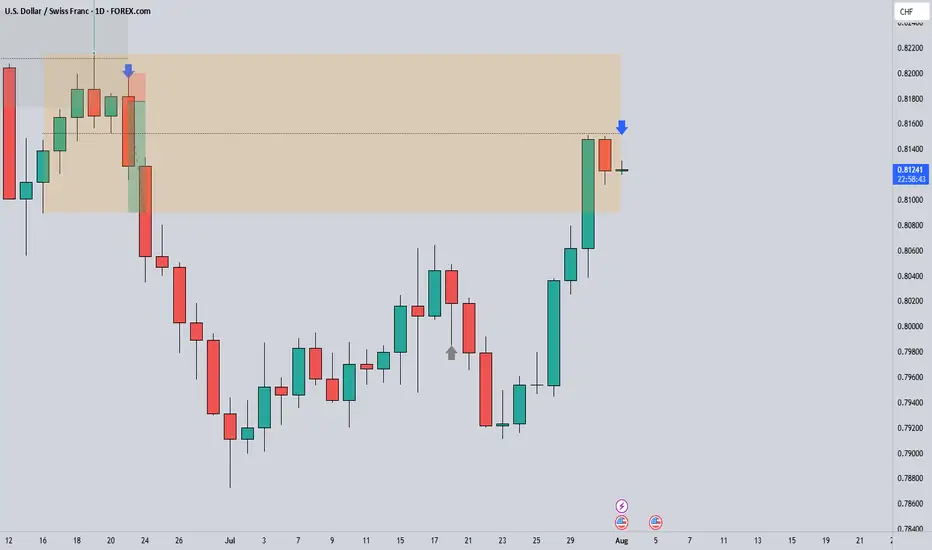
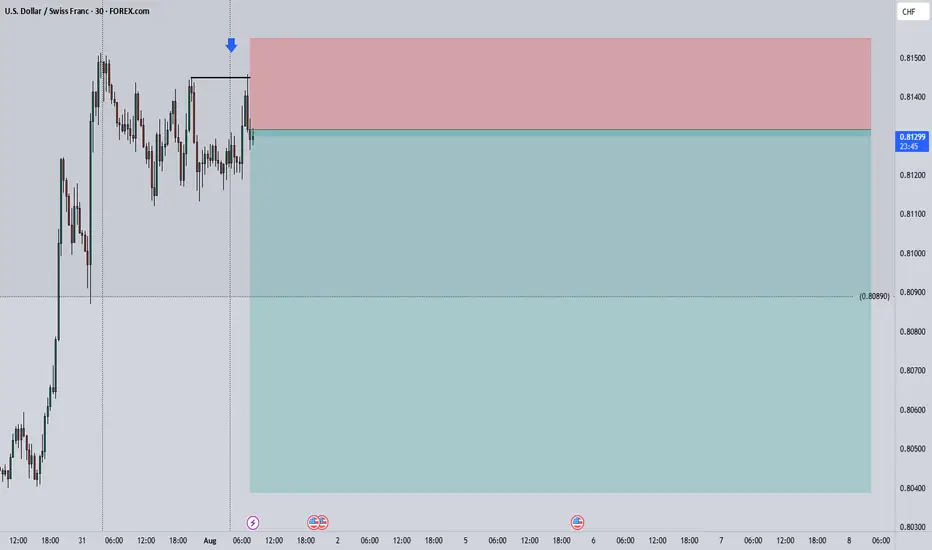
USDCHF Short ProjectHi guys...😎
It's time to do a Short Project on USDCHF with 3 key reasons:
1. Price Drivers: Weekly Supply
2. Weekly Trend: down
3. Momentum: bearish
Action: waiting for entry on the intraday timeframe (entry will be published further)
GAMUDA CONTINUING MARKING UPThis is just a continuation from my previous thesis
**pls refer to the link below
I just want to mention that there is another formation of feather's weight (FW) (**Red line) since the Stepping Stone (SS)
I would be labelling this FW as a form of SS
It would be interesting if today's Bar / Candlestick, able to commit above yesterday's Bar/Candlestick (31/7/25)
-Noticed the huge selling blocks (*Purple Arrow)
EP n SL as attached (Position Intiated @ 31/7/25)
PureWyckoff

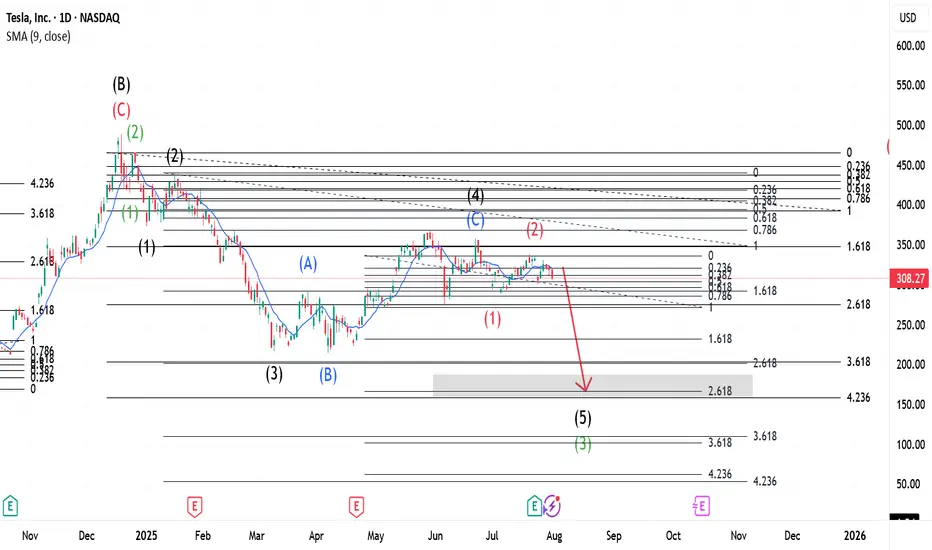
$TSLA ~ Elliott Wave Updates.This whole wave is Wave C(Black) that started when Wave B(Black) was completed. This Wave C(Black) expresses itself in 5 main waves shown in Green. Wave 2(Green) was a Zigzag and a Flat should be expected for 4(Green). Meanwhile, Wave 3(Green) expresses itself in a 5 wave move shown in Black- with Wave 2(Black) being a Zigzag, our 4 was a Flat. This Flat is shown as Blue ABC. When Wave 4(Black) completed, our Wave 5 began which upon completion, would be Wave 3(Green) of the main wave. Wave 2(Red) is a Flat and a Zigzag should be expected after 3(Red).
Go to for more information of the same.
GOLD (XAUUSD) -Monthly Analysis & Trading Plan (Aug 2025)GOLD (XAUUSD) -Monthly Analysis & Trading Plan (Aug 2025)
Title: XAUUSD: Correction in Progress, Patience is Key for the Next Move
Chart: XAUUSD Monthly (1M)
Analysis Type: ICT/SMC, Price Action, & Moving Average
Summary:
After a historic and powerful bull run that saw Gold (XAUUSD) breach all-time highs in the first half of 2025, the market has entered a significant corrective phase. The massive red candle in June signaled a strong reversal of momentum, and the current July candle confirms that sellers remain in control, albeit with less intensity. This is a critical juncture for long-term traders, and a strategic approach is required.
Key Observations & Analysis
1. **Price Action & Market Structure:**
The move from late 2024 through May 2025 was a textbook "impulsive leg." The sharp reversal in June 2025, with a powerful bearish candle, likely acted as a **liquidity grab** or a **high-volume distribution event**, trapping late buyers. The market is now in a clear **break in market structure (BOS)** to the downside on this long-term timeframe, suggesting the correction is not over.
2. **ICT/SMC Concepts:**
* **Imbalance/Fair Value Gap (FVG):** The rapid bullish move created significant imbalances on the monthly chart. Price often returns to fill these gaps. The current correction is likely heading to fill or test these inefficiencies.
* **Order Block (OB):** The massive bullish move in late 2024/early 2025 likely created a strong bullish order block. The current sell-off is heading toward this potential institutional demand zone.
* **Liquidity:** The lows from late 2024 and early 2025 will be key liquidity pools. Smart money will likely be targeting these areas for a potential reversal or accumulation.
3. **Moving Average Analysis (MMA):**
* The price is currently trading above both the purple and yellow moving averages, which are still pointing upward. This confirms the long-term trend remains bullish, and the current move is a correction within that trend.
* The **purple moving average** is a key support level to watch. A test of this level would be a high-probability event, and its reaction will be crucial for the next major move.
Suggested Entry & Exit Levels
1. Aggressive Entry (Short)
Rationale
The bearish momentum, though slowing, is still the dominant force. An aggressive trader could look for a continuation of the short-term bearish trend.
Entry/b]
A short entry could be considered on a pullback to the recent highs around **$3,400 - $3,500** if a strong bearish candlestick pattern forms on a lower timeframe (e.g., weekly or daily).
Stop Loss
A tight stop-loss placed just above the recent high, for example, **$3,600**. This is a high-risk entry, so position sizing should be small.
Target
The first major target would be the **moving average support level**, roughly in the **$3,000 - $3,100** zone. The ultimate target for a full correction would be the order block from late 2024, around **$2,800**.
2. Conservative Entry (Long)
Rationale
The long-term trend is still bullish. The current move is a correction. The most prudent approach is to wait for a high-probability long entry at a key support level.
Entry/b]
Wait for price to reach the **purple moving average support zone (around $3,000 - $3,100)**. Look for a clear reversal signal on this level, such as a large bullish "pin bar" or "engulfing candle" on the monthly or weekly chart. This would be a high-probability demand zone for a reversal.
Stop Loss
A stop-loss should be placed below this key support level, perhaps around **$2,850 - $2,900**, giving the trade room to breathe.
Target
The first target for a new bullish leg would be the New swing high around **$3,800**. The ultimate long-term target would be a new all-time high above **$4,000**.
Conclusion
The Gold market is in a crucial phase. The bullish party from earlier in 2025 is over for now, and a healthy correction is underway. **The most logical and safe approach is to wait for the market to complete its corrective move.** Do not attempt to catch a falling knife. Instead, be patient and wait for price to reach a key institutional demand zone (our moving average support or the late 2024 order block) and show a clear sign of reversal. This will present a high-probability, low-risk long entry for the next impulsive move up.
Disclaimer
This is not financial advice. Please perform your own due diligence and risk management. Trading involves a significant risk of loss.

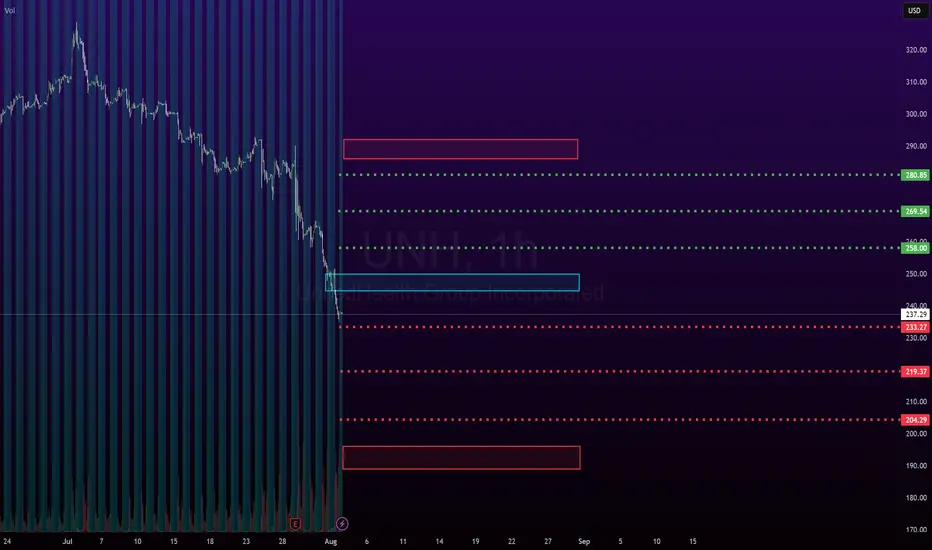
UNH: Monthly outlook UNH is an interesting case study, fundamentals vs technicals vs math.
If you were sleeping, here are the cliff notes on UNH:
UNH is alleged to have commited the following violations/criminal offences
Medicare Overbilling: The U.S. Department of Justice has accused UNH of overcharging Medicare by more than $2.1 billion, allegedly by manipulating diagnosis codes to inflate payments.
Securities Fraud: A class action lawsuit claims UNH misled investors by denying coverage to boost profits, which allegedly contributed to a sharp drop in stock value.
Undisclosed Payments: Reports suggest UNH made secret payments to nursing homes to reduce hospital transfers, potentially compromising patient care.
How did it come to light, you ask?
From whistleblowers, investigative journalists and a DOJ probe (department of justice).
While the investigation is ongoing, if they are found guilty of any or all of these allegations, the penalties could be:
Billions in fines
Civil damages
Criminal charges
Sanctions that can fundamentally interfere with how they do/conduct business
With that out of the way, ask yourself: Am I buying this while there is an ongoing criminal investigation that could very well result in the insolvency of an organization?
I know a lot of people think the charts tell the news, but something this serious unfortunately can't be foretold by a chart, in my opinion.
But let's humour the fallacy that these traders have, and entertain whether or not UNH could theoretically be a buy.
Technicals:
Oversold, obviously.
No clear bottom pattern.
No clear chart pattern at all.
Massive investor exodus, with the current selling volume being almost as much as the flash crash we had the beginning of this year and the third highest in UNH's long, long life on the NYSE.
Math:
While UNH is below is quadratic mean, it has not triggered a bullish mean reversion signal yet.
Forecast into next week is bullish with some upside bouncing expected.
Mid term forecast (over the next month) has it coming down to 220.
The math levels are posted in the chart and 220 is actually the second low target on the month, so that's interesting.
This will go lower obviously if guilt is found or damming evidence comes forth in the media over the next days. I say this because UNH popped up on my sweep alerts. Four (4) very large option orders have popped up on my order flow screener for UNH, totaling over 7 million in short premiums (puts).
First is the 480 put strike expiry 08-15 of this year with 4.2 million in premiums bought.
Second is the 530 put strike, expiry 09-19 of this year with 634 k in premiums bought.
Third is the 540 put strike, expiry 09-19 with 815 k of premiums bought.
Last is the 600 put strike, expiry 01-16-2026 with 554 k of premiums bought.
This obviously has me interested that someone knows something about stuff.
But this is not advice, just reporting what I see.
Safe trades everyone!

NZDUSD: Look Out for Bullish Movement This Upcoming WeekThe NZDUSD currency pair is showing signs of potential bullish movement as we approach the new trading week. Several technical and fundamental factors align to support a possible upward momentum, making NZDUSD a pair to watch closely.

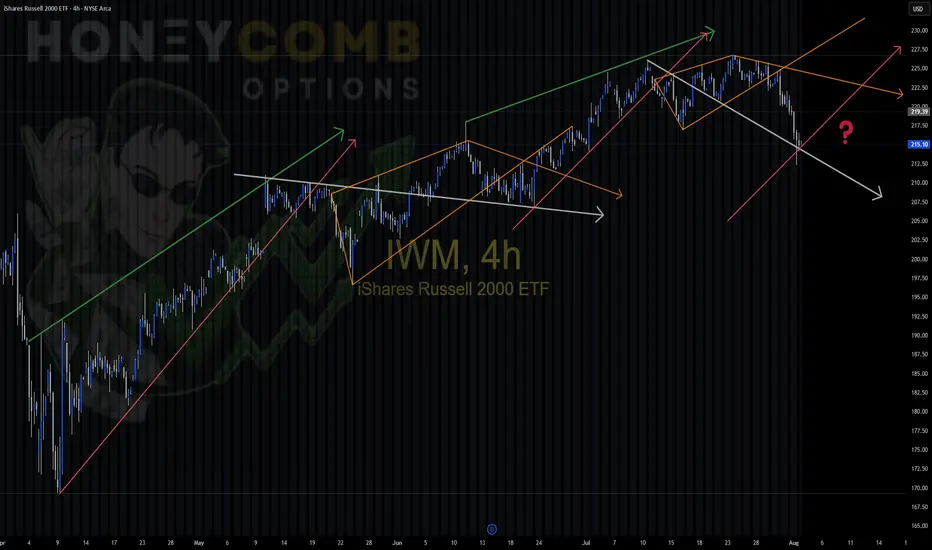
IWM repeating patterns IWM Playing around today noticed similar patterns in this uptrend, color coded for you convenience. Different sizes,, but the patterns are the same. Will we enter a new trend and start a different pattern, or will we stay in the same cycle?
CADJPY still bearish to expect
OANDA:CADJPY strong bearish fall in week behind us, for next week still having bearish expectations.
SUP zone: 108.000
RES zone: 105.900, 105.500


BTC190000 soonthis is way to btc going to 190000 soon or late after that i say btc should have very massive sell
but befor that we nead to btc go to up 190000

Apple Stock looking bearishThe positive earnings brought enough buyside liquidity to be taken by the short sellers and im having this almost 3 RR trade idea that I executed on Friday

Bitcoin Structure in Stillness, Power in Silence, Just Control?⊣
⟁ BTC/USD - BINANCE - (CHART: H1) - (Aug 02, 2025).
◇ Analysis Price: $113,869.77.
⊣
⨀ I. Temporal Axis - Strategic Interval - (1H):
▦ EMA9 - ($113,889.32):
∴ The price is trading just below the EMA9, which acts as immediate reactive resistance;
∴ The short-term slope remains negative, with no breakout signal;
∴ Buyers are unable to push the price above this threshold, indicating technical weakness.
✴️ Conclusion: Momentum remains capped; the EMA9 has not been reclaimed.
⊢
▦ EMA21 - ($113,896.52):
∴ The EMA21 stands as a tactical compression line in this range;
∴ The close proximity of EMA9 and EMA21 forms a technical knot - indecision zone;
∴ Past rejections in this region reinforce it as a powerful barrier.
✴️ Conclusion: Mid-range resistance holds; continuation is blocked unless breached with volume.
⊢
▦ EMA50 - ($114,128.22):
∴ EMA50 defines the current macro resistance on the 1H chart;
∴ The price has yet to test this level directly after the last drop;
∴ For structural recovery, this line must be broken cleanly with follow-through.
✴️ Conclusion: Primary obstacle on the path to reversal - decisive zone.
⊢
▦ BB (21 + EMA9) - Status: Compression:
∴ Bands are tightening around the price, signaling low volatility;
∴ Price action is contained within the central channel;
∴ Indicates upcoming volatility spike - direction still unknown.
✴️ Conclusion: Volatility compression is active; no directional bias confirmed.
⊢
▦ Volume + EMA21 - (3.84 BTC):
∴ Trading volume remains below the EMA21 period average;
∴ No surge of bullish commitment visible;
∴ Momentum lacks conviction without participation.
✴️ Conclusion: Absence of volume undermines the strength of any move.
⊢
▦ RSI (21, 9) - (42.37):
∴ RSI hovers in the lower neutral band - weak momentum;
∴ Slight upward curve suggests a modest rebound;
∴ No divergence or strength signal confirmed.
✴️ Conclusion: Minor relief rally underway - structurally weak.
⊢
▦ MACD (9, 21, 9) - (MACD: -238.89 / Signal: -340.58):
∴ Bullish crossover confirmed, histogram positive;
∴ Both lines remain in bearish territory - (below zero);
∴ Trend momentum is building but not strong enough to reverse.
✴️ Conclusion: Technical rebound in play - not a structural shift.
⊢
▦ Stoch RSI (3, 3, 21, 9) - (%K: 58.90 / %D: 52.70):
∴ Positive crossover established and advancing in neutral-upper zone;
∴ No overbought signal;
∴ Possibility of further upside if confirmed with price action.
✴️ Conclusion: Oscillator supports continuation - contingent on volume.
⊢
▦ OBV (21, BB2) - (26.35K):
∴ OBV remains flat, indicating market indecision;
∴ No divergence with price movement;
∴ No fresh buying pressure detected.
✴️ Conclusion: Neutral volume behavior - flow not favoring bulls.
⊢
🜎 Strategic Insight - Technical Oracle:
∴ The 1H chart of (BTC/USD) reveals a battlefield sealed in compression and anticipation.
The price is locked beneath converging exponential resistances (EMA9, EMA21, EMA50), forming a triple entrenchment zone. None have been broken - each rejection reinforces the stronghold;
∴ The Bollinger Bands constrict like a ritual binding. Volatility is silent - too silent - awaiting the spark. Yet no participant steps forward with force; volume remains suppressed, showing that neither side has declared war;
∴ Momentum oscillators (RSI, Stoch RSI) hint at an upward drift, but these are echoes, not proclamations;
∴ The MACD crossover is not a trumpet - it is a murmur in the underworld, below the zero line, concealed from the living trend;
∴ The OBV confirms it: no one is entering the field with conviction. This is not a battlefield - it is a waiting room;
✴️ And yet, amidst this silence, the Code speaks:
∴ If the zone between ($114.1K and $114.6K) is breached with volume and confirmation, this will mark the first true structural challenge to the prevailing descent. If it fails - the repique folds into another trap, devoured by gravity.
⊢
∫ II. On-Chain Intelligence - (Source: CryptoQuant):
▦ Exchange Inflow Total + EMA9 - (All Exchanges) - (6.2K BTC):
∴ The total Bitcoin flowing into centralized exchanges remains subdued, with no signs of aggressive sell-side pressure;
∴ The EMA9 confirms a flat, low-intensity behavior, distinct from capitulation spikes;
∴ The absence of major inflows during price compression implies a strategic wait state.
✴️ Conclusion: No incoming threat detected - institutions are not preparing to sell.
⊢
▦ Exchange Netflow Total + EMA9 - (All Exchanges) - (-644.5 BTC):
∴ Netflow remains negative, indicating Bitcoin is being withdrawn from exchanges rather than deposited;
∴ A negative netflow during a price downtrend reflects silent accumulation behavior or rotation into cold storage;
∴ The EMA9 shows a consistent drainage pattern, not episodic outflow.
✴️ Conclusion: This confirms defensive posture by large holders - supporting the technical compression.
⊢
▦ Spent Output Profit Ratio - (SOPR) + EMA9 - (1.003):
∴ The SOPR hovers just above 1.0, suggesting coins moved on-chain are being sold at or near cost basis;
∴ No signs of aggressive profit-taking or panic selling - rather, equilibrium behavior;
∴ The 9-period EMA confirms stability in this zone.
✴️ Conclusion: Market psychology is suspended - no one is winning or losing.
⊢
🜎 Strategic Insight - On-Chain Oracle:
∴ All on-chain signals reflect preparation without declaration;
∴ No pressure enters, and no blood leaves;
∴ The field is not empty - it is coiled;
∴ Withdrawals - (Netflow) - suggest protective accumulation;
∴ Low Inflow signals no new panic supply;
∴ SOPR near 1.0 says: (We're all waiting - and none are ahead);
∴ The technical compression in price is not betrayed by the chain;
∴ The silence is consistent;
∴ But silence is not peace - it is a veil.
✴️ Conclusion: If volume does not breach $114.6K - all remains a ghost echo beneath resistance.
If broken - the coil unwinds.
⊢
⧉ III. Contextvs Macro-Geopoliticvs - Interflux Economicvs - (Aug 02, 2025):
⟁ All movements of the market's breath are influenced not only by price, nor volume, but by the tides beyond the chart. Here begins the reading of the outer realm:
▦ EVENTVM I - (Wall Street Silent Accumulation) - (U.Today + Coindesk):
∴ Institutional actors are actively acquiring BTC and ETH through stealth operations - not OTC spikes, but ETF inflows and treasury balance shifts;
∴ Tom Lee (Bitmine/Fundstrat) confirms: Wall Street is not waiting for clarity, it is accumulating in silence;
∴ SEC’s Project Crypto and “in-kind” ETF mechanisms further reduce friction for institutional entry.
✴️ Conclusion: Price stagnation conceals power transfer - retail hesitates while funds consolidate control.
⊢
▦ EVENTVM II - (SEC’s “Project Crypto” Activation):
∴ Regulatory framing under “Project Crypto” unfolds in phases: transparency, compliance infrastructure, and institutional bridges;
∴ Despite its regulatory mask, the program facilitates liquidity channels into crypto markets;
∴ Legalized ETF's now serve as strategic vacuum points for Bitcoin supply.
✴️ Conclusion: What appears as regulation is in fact an alignment mechanism - structure over rebellion.
⊢
▦ EVENTVM III - (July ETF Flows (US) - $12.8B Inflow):
∴ U.S.-based crypto ETF's report record-breaking $12.8 billion inflows in July alone;
∴ Largest flows tracked in BlackRock, Fidelity, and VanEck vehicles - no signs of reversal;
∴ These flows occurred during price weakness, not during breakout - a signature of accumulation.
✴️ Conclusion: The public hesitates while custodians act - the veil of weakness conceals a new floor.
⊢
🜎 Strategic Interpretation - Macro Context:
∴ The charts compress. The flows retract;
∴ But the outer forces converge - Wall Street is no longer watching. It is acquiring;
∴ Through structure, silence, regulation, and engineering of access;
∴ This is no longer the market of peer-to-peer rebellion;
∴ This is the codification of power into institutional hands;
✴️ Conclusion: Price may appear static - but ownership is shifting.
⊢
𓂀 Stoic-Structural Interpretation:
∴ The chart does not lie. The data does not beg. The market does not care. Bitcoin remains trapped beneath resistance - not by force, but by inaction, by lack of intention, by silent contest;
∴ On-chain signals whisper: no one is selling in panic, no one is buying in euphoria;
∴ The macro realm reveals: the hands of power are moving beneath regulation, using silence as shield;
∴ Thus we see a paradox - the technical shell compresses, the on-chain bloodstream circulates without fever, the macro structure redefines.
⚖️ The Stoic mind recognizes this not as chaos, but as necessary stillness.
∴ The Arcane practitioner does not chase a move - he maps the pressure points and waits;
∴ He acts only when the veil thins;
∴ To act prematurely is to violate the structure;
∴ To wait blindly is to betray the will;
∴ The Stoic Arcane path demands this: know the boundary, seal the insight, then act - once - with clarity;
∴ At ($114.6K) the veil may part. If it does not - the silence continues.
⊢
✦ Structure Bearish.
▦ This is a bearish containment, not a breakdown.
∴ The market is not collapsing - it is being held below by absence of volume, of intention, of structural reversal;
∴ The EMA's are stacked above like iron gates;
∴ The price has failed to break $114.6K - the veil remains intact;
∴ On-chain data confirms neutrality, not optimism;
∴ Macro signals suggest accumulation by institutions - but not defense for the public.
⊢
🜎 Therefore:
∴ Technically Bearish - (structure not yet reversed);
∴ Tactically Neutral to Bearish - (fragile repique);
∴ Strategically in Transition Phase - (institutions buying beneath silence).
✴️ Conclusion: Until ($114.6K) is broken with conviction, the structure remains bearishly biased - wrapped in stillness.
⊢
⧉
· Cryptorvm Dominvs · MAGISTER ARCANVM · Vox Primordialis ·
⚜️ ⌬ - Silence precedes the next force. Structure is sacred - ⌬ ⚜️
⧉
⊢

LIVE BTC/USD, XAUUSD TRADING, 02/08/2025 SIGNALS PRICE ACTION TRLive BTC/USD, XAUUSD TRADING, 02/08/2025 signal price action trading strategy

Stock Allocation IdeasIf you're building a stock portfolio, how you allocate your money matters as much as what you buy. Here’s a practical, risk-aware approach for retail traders and investors:
1. Core and Satellite Approach
Core (60–70%): Stick with strong, stable companies—large-cap names with reliable earnings like AAPL, MSFT, or JNJ. These form the foundation of your portfolio.
Satellite (30–40%): Use this portion for high-potential ideas—growth stocks, emerging tech (like AI or EV), or small caps. Higher risk, but higher potential return.
2. Mix Between Defensive and Growth Stocks
In volatile markets, lean toward defensive sectors (healthcare, consumer staples, utilities).
In bull markets or improving conditions, increase exposure to growth sectors (tech, consumer discretionary).
3. Blend Growth and Value
Balance high-growth stocks with undervalued, stable companies.
When interest rates are high or inflation is rising, value stocks often perform better.
When rates fall or the economy picks up, growth stocks usually lead.
4. Don't Ignore International Exposure
While U.S. stocks are strong, consider adding 20–30% exposure to global markets (Europe, Japan, or select emerging markets).
5. Stay Disciplined with Rebalancing
Check your portfolio every 3 months.
Take profits where gains have outpaced, and reinvest in areas that are still fundamentally strong but lagging.
Final Tip: Focus on position sizing and risk management. You don’t need to hit every trade—preserving capital and staying in the game is the priority.
why not eh doodling on the chart, I can change my mind depends on how price moves
key levels and 4 trendlines to gauge the stenght of the waves

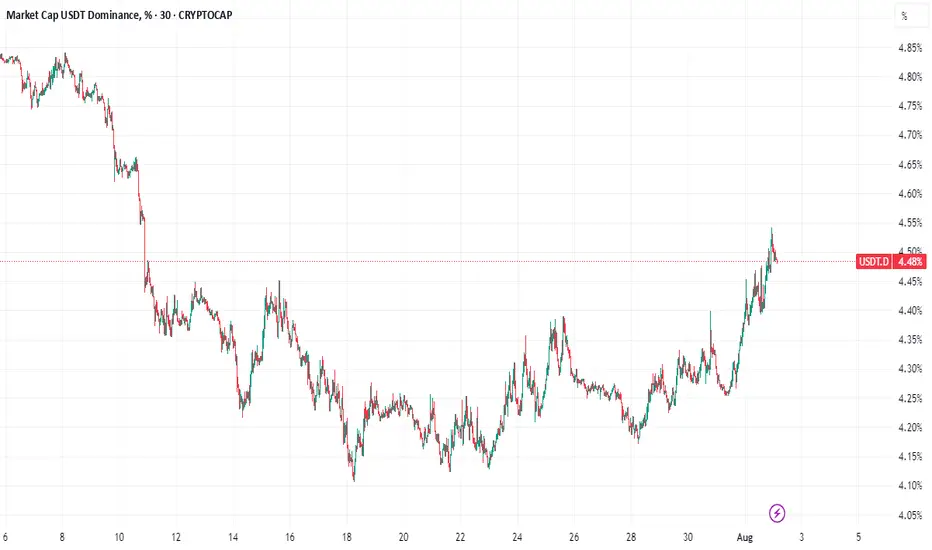
Tether Rakes in $4.9B Q2 Profit, Cementing Its Reign as Crypto’sTether Q2 Net Profit Hits $4.9 Billion, Pushing Total Earnings to $5.7 Billion: What It Means for the Crypto Industry
Tether Holdings Ltd., the issuer of the world’s largest stablecoin USDT, has once again made headlines with its Q2 2025 earnings report, revealing a staggering net profit of $4.96 billion. This brings the company’s total profits for the first half of the year to $5.7 billion—a record-breaking milestone for both the company and the broader stablecoin ecosystem.
This article explores the implications of Tether’s Q2 performance, the sources of its revenue, its impact on the crypto markets, and the growing significance of stablecoins in the evolving financial landscape.
________________________________________
A Record-Setting Quarter for Tether
Tether’s Q2 2025 results have astonished even seasoned analysts. The company’s reported $4.96 billion in net profit in a single quarter represents one of the most profitable periods in the history of any fintech or crypto-native company. What’s even more remarkable is that this profit was not driven by speculative trading or token sales, but by conservative, yield-generating strategies rooted in traditional finance.
The company’s Q1 earnings were already impressive at $0.76 billion, but Q2’s results eclipse those numbers entirely. Tether’s cumulative profit year-to-date now stands at $5.72 billion, putting it on track to potentially exceed $10 billion in earnings for the full year if current trends continue.
________________________________________
What’s Driving Tether’s Massive Profit?
Tether’s incredible profitability is primarily fueled by one key factor: the interest earned on its reserves. As the issuer of USDT, Tether is responsible for maintaining a 1:1 backing of every token in circulation. These reserves are primarily held in short-term U.S. Treasury Bills (T-Bills), reverse repos, and cash equivalents.
Here’s a breakdown of the main profit drivers:
1. High Interest Rates on U.S. Treasuries
With the U.S. Federal Reserve maintaining elevated interest rates to combat inflation, short-term T-Bills have become highly lucrative. Tether holds tens of billions of dollars in these instruments, generating billions in annual interest income.
For example, the yield on a 3-month Treasury bill in Q2 2025 averaged around 5.2%, and Tether’s reserve base has hovered near $90 billion to $100 billion. Even a conservative allocation can earn several billion dollars in annual yield.
2. Reverse Repurchase Agreements (Reverse Repos)
Tether has also expanded its use of reverse repos, which allow it to lend cash to counterparties in exchange for securities, earning a premium on the transaction. This has contributed significantly to its earnings, especially in a high-yield environment.
3. Gold Holdings and Bitcoin Exposure
Tether has acknowledged that a small portion of its reserves includes gold and Bitcoin holdings. These assets appreciated in Q2, contributing to the overall profit. While not the primary revenue source, their performance added notable value during the quarter.
4. Equity Investments
The company has begun investing in infrastructure and technology firms related to blockchain and AI. While these investments are not liquid, mark-to-market gains may have also contributed to the net profit figure.
________________________________________
A Closer Look at Tether’s Reserve Report
Tether’s Q2 attestation report, published alongside its earnings update, provides transparency into how its assets are allocated. Here are some highlights:
• Over 85% of reserves are held in U.S. Treasury instruments
• $5.4 billion in excess reserves—a buffer above the value of circulating USDT
• $3.3 billion in gold and Bitcoin holdings
• Minimal exposure to unsecured commercial paper or riskier debt instruments
Tether has continuously emphasized its commitment to transparency and risk management. Unlike in its early years, when it faced criticism over opaque reserve practices, the company now releases quarterly attestations audited by third-party firms such as BDO Italia.
________________________________________
USDT’s Growing Dominance
Tether’s profits are closely tied to the growth of its flagship product: USDT, the world’s largest stablecoin by market cap. As of August 2025, USDT has a circulating supply exceeding $110 billion, giving it a dominant share of the stablecoin market.
This growth can be attributed to several factors:
1. Increased Adoption in Emerging Markets
USDT is widely used in countries with unstable fiat currencies, such as Argentina, Nigeria, and Turkey. For many users, USDT represents a dollar-denominated safe haven in environments plagued by inflation and capital controls.
2. DeFi and Cross-border Payments
USDT continues to be a core asset in decentralized finance (DeFi) protocols, serving as a stable medium of exchange and collateral. It's also a preferred tool for cross-border remittances, given its speed and low transaction costs compared to traditional banking systems.
3. Institutional Integration
Major crypto exchanges, custodians, and payment processors have incorporated USDT into their platforms, driving further liquidity and utility. In many cases, USDT is preferred over fiat due to its 24/7 availability and blockchain-native nature.
________________________________________
What Does This Mean for the Crypto Industry?
Tether’s Q2 performance is more than just a corporate milestone—it’s a bellwether moment for the crypto industry. It signifies the maturation and institutionalization of digital assets and stablecoins. Here’s what it means for the broader ecosystem:
1. Stablecoins as Profitable Financial Products
Tether’s profitability proves that stablecoins are no longer just “crypto plumbing.” They are now financial products generating billions in yield, much like money market funds. This is reshaping how investors and regulators think about stablecoins—not as speculative tools, but as interest-bearing assets backed by real-world securities.
2. Regulatory Scrutiny Will Intensify
With Tether generating profits that rival traditional banks, expect regulators to increase oversight. Stablecoins have long been in the crosshairs of the U.S. Treasury, SEC, and global central banks, and Tether’s dominant market share will likely place it under further examination.
However, Tether’s transparency efforts, including quarterly attestations and reserve disclosures, may help it navigate these regulatory waters more effectively than in the past.
3. Competition Will Escalate
Tether’s extraordinary profits will likely attract new entrants and existing competitors to the stablecoin arena. Circle’s USDC, PayPal’s PYUSD, and even central bank digital currencies (CBDCs) are all vying for market share.
Tether’s early-mover advantage, global reach, and deep liquidity make it hard to displace, but increased competition could pressure margins in the long term.
4. Decentralized Alternatives Will Seek Market Share
Decentralized stablecoins like DAI, FRAX, and USDD aim to offer alternatives to centralized issuers like Tether. While they remain relatively small, the ethos of decentralization might gain appeal, especially in regulatory-heavy environments.
Still, decentralized stablecoins have struggled to maintain pegs during market stress, giving Tether an edge in terms of trust and resilience.
________________________________________
The Road Ahead for Tether
As Tether moves into the second half of 2025, several strategic themes will define its trajectory:
Continued Profitability
If interest rates remain elevated and USDT circulation continues to grow, Tether’s annual profit could reach or exceed $10 billion—putting it in league with the most profitable fintech firms globally. This surplus could be reinvested in:
• Infrastructure expansion
• Strategic acquisitions
• Reserve diversification
• R&D for stablecoin innovation
Expansion into Emerging Markets
Tether has hinted at expanding its presence in Latin America, Africa, and Southeast Asia, where demand for dollar-denominated assets is high and banking infrastructure is limited. Expect to see more localized partnerships and on-ramp/off-ramp solutions.
Embracing Blockchain Innovation
Tether is already deployed on multiple blockchains—Ethereum, Tron, Solana, and more. The company is likely to support new Layer 1s and Layer 2s to enhance speed, reduce costs, and maintain competitiveness in the DeFi space.
There are also rumors that Tether may be exploring tokenized asset offerings and programmable money features, allowing USDT to integrate more deeply with smart contracts and enterprise use cases.
________________________________________
Criticisms and Controversies: Still Lingering?
Despite its success, Tether continues to face criticism from parts of the crypto community and regulatory world. Concerns include:
• Lack of full audits (attestations are not the same as full financial audits)
• Opaque ownership structure
• Past legal issues, including settlements with the New York Attorney General and the U.S. CFTC
However, it’s worth noting that Tether has addressed many of these concerns over the past two years. Its transparency has improved, and its operations have become more conservative and professional.
Still, its scale and impact on the crypto market mean that any misstep could have systemic consequences. Investors and regulators alike will continue to scrutinize its activities.
________________________________________
Final Thoughts: Tether’s Moment of Ascendance
Tether’s Q2 2025 net profit of $4.96 billion doesn’t just reflect a successful quarter—it marks a paradigm shift in crypto finance. What began as a controversial stablecoin project has evolved into a global financial powerhouse, rivaling traditional banks and asset managers in profitability.
More than just a win for Tether, this moment signals the growing legitimacy of stablecoins in the global financial system. It shows that crypto-native firms can not only survive but thrive in traditional financial environments, leveraging yield, transparency, and blockchain infrastructure to create sustainable business models.
As the world watches, Tether’s next chapters will likely be shaped by innovation, regulation, and global expansion. But for now, with $5.7 billion in profits in just six months, one thing is clear:
Tether is no longer just a stablecoin issuer—it’s one of the most powerful financial entities
in the digital age.
________________________________________
Disclaimer: This article is for informational purposes only. It does not constitute financial advice. Always conduct your own research before making investment decisions.