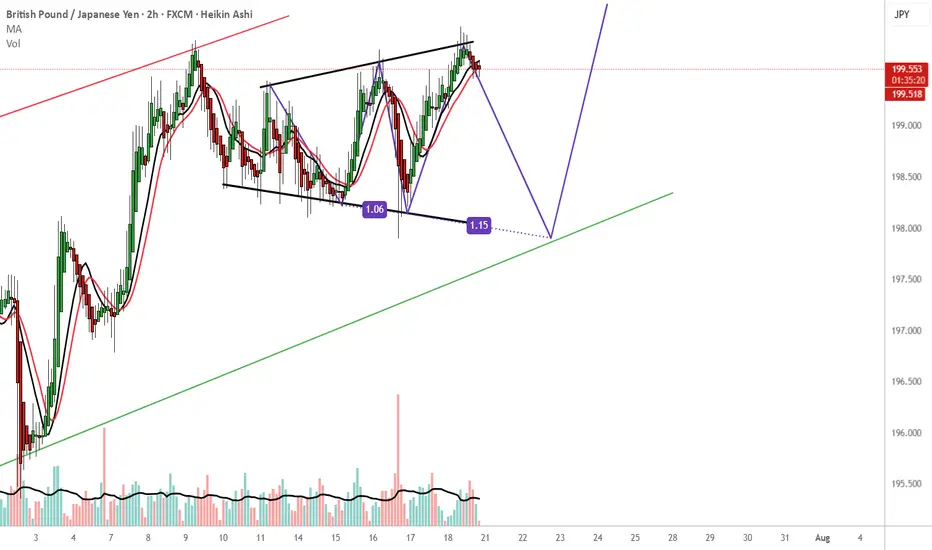
GBPJPY - How i see the market. WHAT DO YOU THINK?A channel within a channel .
Short-term bearish pressure to complete the 3-drives pattern, which ultimately suggests a long bullish setup. I'd only consider this setup if the trend continues to 198.000.
side note
198.000 I'll be looking for buying opportunities to the upside probably until we hit the red channel trendline. That should guarantee approx. 350pips.
You could take advantage of the current bearish move and rejoin when the bulls hit the ground running. Remember use your own trading plan and enjoy the ride . It can go either way but hopefully it respects PA and goes with this flow.
Beyond Technical Analysis
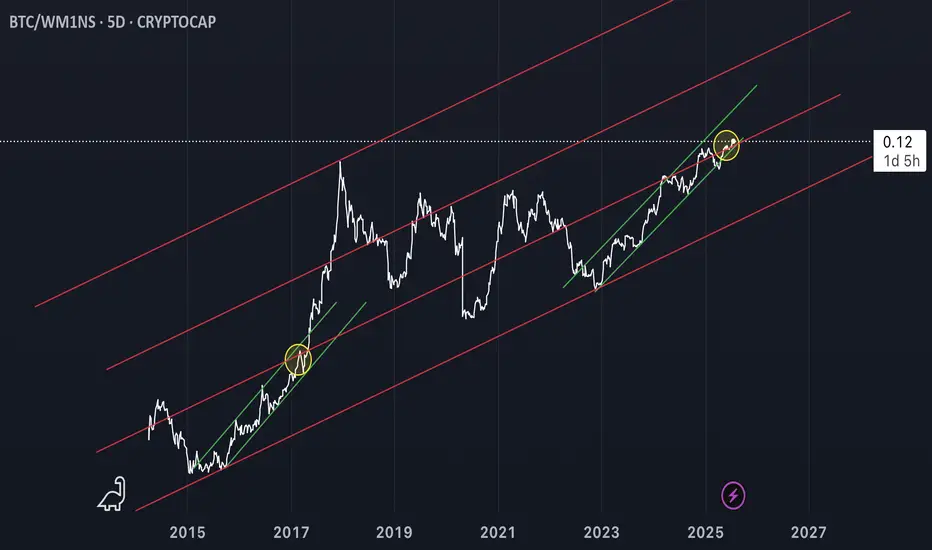
Bitcoin now on 2017 supportNot a chart I’ve shared before. Previous historical resistance in 2017, is now support. (BITCOIN divided by M1. BTC/WM1NS)
BTCUSDT - Short Term Buy Cycle BTCUSDT
Short term buy cycle
TP at 120558
% bubble ratio
Currently in a negative bubble either fair value at 120558, the cycle is a short term and expected to be closed within maximum 6 months
Spot trading plan:
Start to buy from (-10%) bubble ratio and below

bullish on golda retracement to lower support levels on h4 and h1 then price is expected to shoot to the weekly levels on this coming week

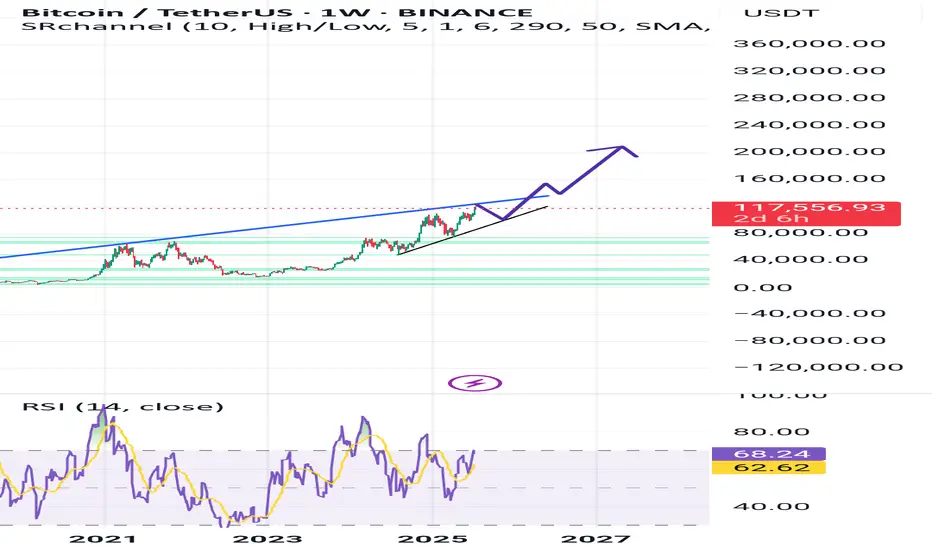
Need to retest $91k before next big moveI think now Bitcoin can take healthy correction before to takeoff 🛫 for major upside move.
And if BTC break $124k than we can see $134.5k before take correction..
Let's see what will happen next..
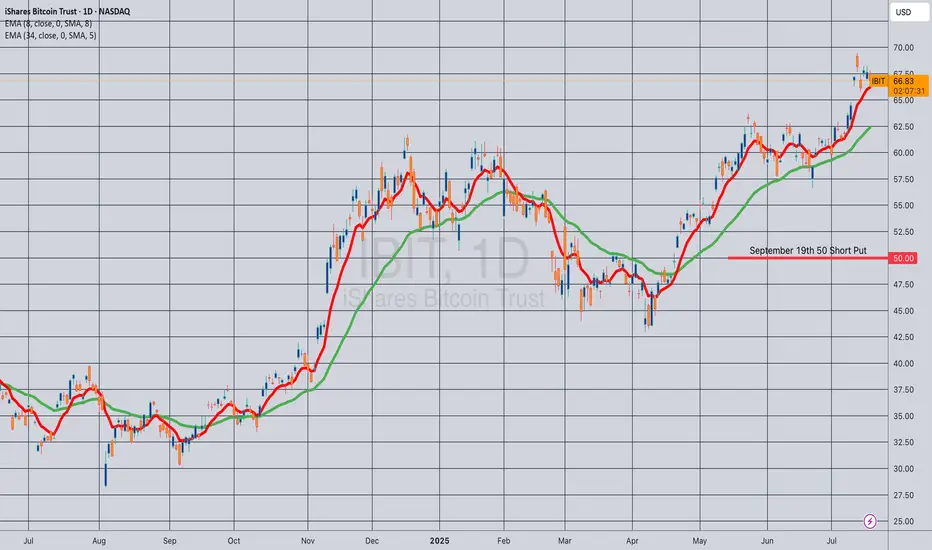
Opening (IRA): IBIT September 19th 50 Short Put... for a .52 credit.
Comments: Laddering out/adding at strikes better than what I currently have on, targeting the strike paying around 1% of the strike price in credit.
Will generally look to roll up at 50% max at > 45 DTE (Days 'Til Expiration).
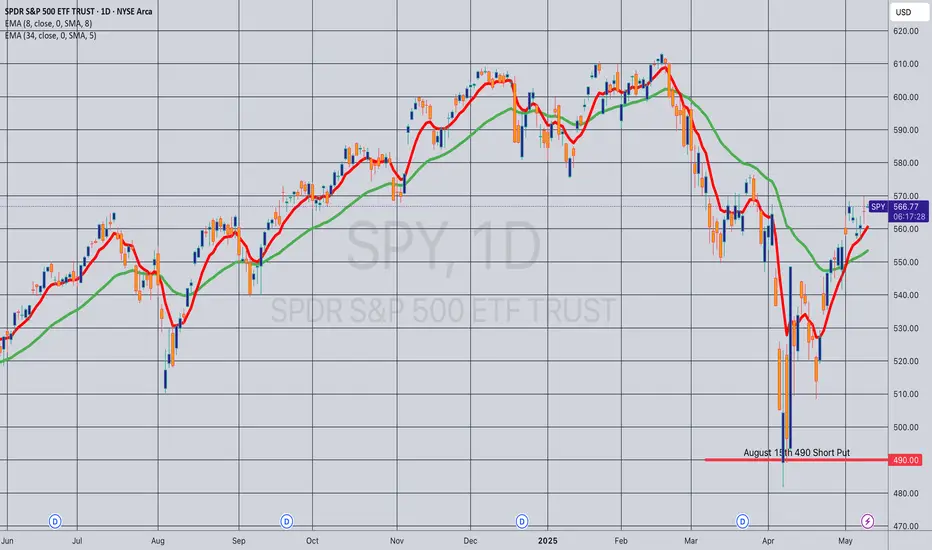
Opening (IRA): SPY August 15th 490 Short Put... for a 5.00 credit.
Comments: Laddering out, targeting the strike paying around 1% of the strike price in credit ... .
Will generally look to roll up to the shortest duration <16 delta strike paying 1% of the strike price if in profit.
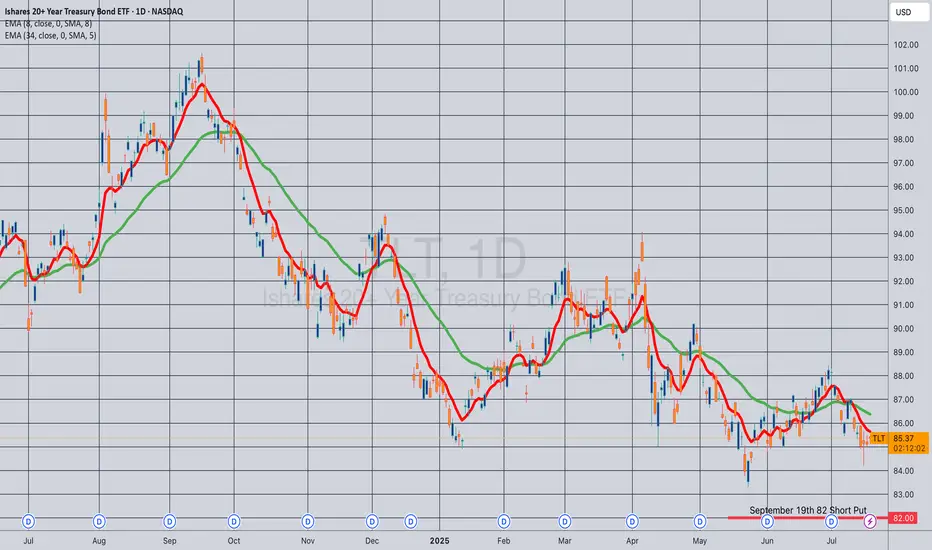
Opening (IRA): TLT September 19th 82 Short Put... for a .90 credit.
Comments: Adding to my position at strikes slightly better than what I currently have on ... .
Euro LongsI've been waiting for euro to reach discount of its daily range and deliver into a daily BISI.
Mon - Wed trade lower into key arrays. Intraweek reversal confirmed with 4h and 1h CISD. Paired with Pound SMT at the daily lows.
LRLR built up from last weeks pullback. That bsl looks too obvious to me.
Entering off 1h cisd at 1.16650. Stop at Wednesday low. Targeting manipulation leg STD levels and relative equal highs at 1.19045
If the weekly draw on liquidity is to the upside, this intraweek reversal will hold. I know im wrong on direction if Wednesday low doesnt hold. The framework and logic line up with what I look for. Midweek Reversal daily profile. Thursday continuation in play.

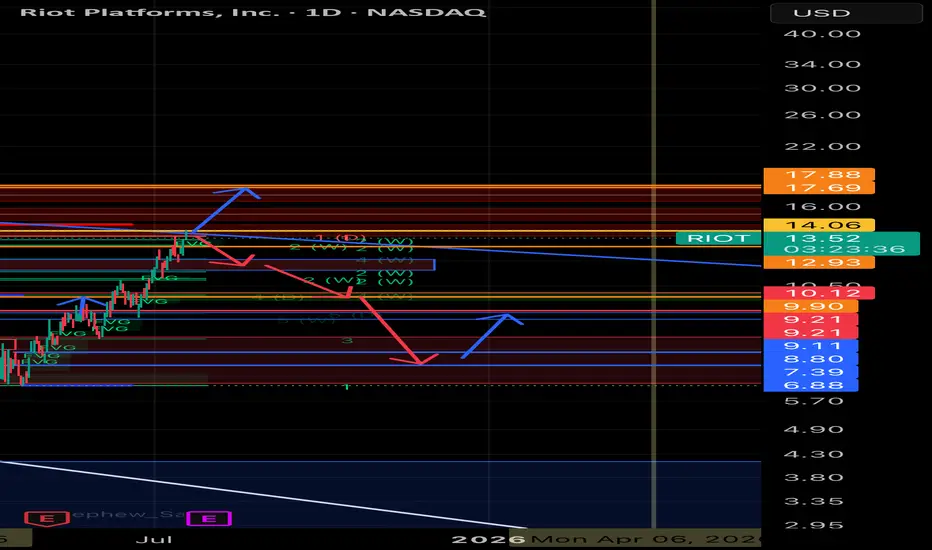
RIOT Platforms, Inc. ($RIOT) – Price Decision Point Near: $17 Br
📆 Timeframe: Daily (1D)
📈 Current Price: ~$13.56
🪙 Key Correlation: Moves in strong tandem with Bitcoin ( CRYPTOCAP:BTC )
⸻
🔧 Chart Analysis Summary
NASDAQ:RIOT has approached a major confluence zone just below $14.06, where several resistance levels, order blocks, and fair value gaps converge. Historically, this zone has rejected price multiple times, making it a critical inflection point.
The technicals suggest a binary outcome is likely in the near term:
⸻
🟢 Upside Scenario – Target: $17.35 to $17.88
If RIOT breaks above the $14.06 resistance with conviction:
• Price could push quickly toward $17.35–$17.88, where:
• Multiple historical supply zones exist
• Large prior rejection candles originated
• LuxAlgo and order block indicators flag institutional interest
• Momentum would likely align with a concurrent breakout in Bitcoin above $120K
⸻
🔴 Downside Scenario – Target: $10.12 to $9.70
If RIOT fails to close above $14 and loses $12.93 support:
• Expect retracement toward:
• $12.05
• $11.50
• Key demand near $10.12–$9.70
• These zones are backed by previous price consolidation, fair value gap fills, and historical bounce levels.
⸻
🔗 Bitcoin ( BITSTAMP:BTCUSD ) Connection
📉 Current BTC Price: ~$117,747
BTC has recently:
• Tagged a long-standing resistance band ($119,182–$120,000)
• Rejected sharply with multiple fair value gaps below
• Holding trendline support, but weakening structure is visible
If Bitcoin breaks below its trendline, a move toward $91K–$92K becomes likely — this would drag RIOT down with it.
If Bitcoin breaks above $120K, momentum could surge across crypto-exposed stocks, and RIOT may follow with a rapid leg up.
⸻
🎯 Conclusion
Scenario Trigger RIOT Target
✅ Bullish BTC breaks $120K $17.35–$17.88
❌ Bearish BTC rejects + loses trendline $12.05 → $11.50 → $10.12–$9.70
⸻
❓Your Turn:
Do you think RIOT breaks out or breaks down?
Let’s see how this unfolds.
Bitcoin Forecast 🔁 I use a unique time-based cycle method built around the universal law of 3-6-9:
3 = Impulse wave
6 = Correction
9 = Cycle end
we are at the higher time frame cycle 9
each cycle of the 3, 6 ,9
contain a smaller one 3 ,6 , 9
This isn’t just about charts — the number 9 governs all natural cycles:
Pregnancy, learning, lunar cycles, economic growth, etc.
---
🗓️ These are the key monthly turning points I track every year:
> Jan 8 – Feb 7 – Mar 6 – Apr 5 – May 5 – Jun 4 – Jul 2 – Aug 1 – Aug 31 – Oct 30 – Nov 29 – Dec 6
📍 This month, July 2nd was a critical time pivot. From there, Bitcoin entered a new time cycle.
📌 Time Is More Powerful Than Price
Most traders focus on price action, waves, or indicators…
But the reality? Time is the real market driver.
⏳ Entry signals based on time outperform those based on price.
Why? Because price is a reaction — time is the cause.

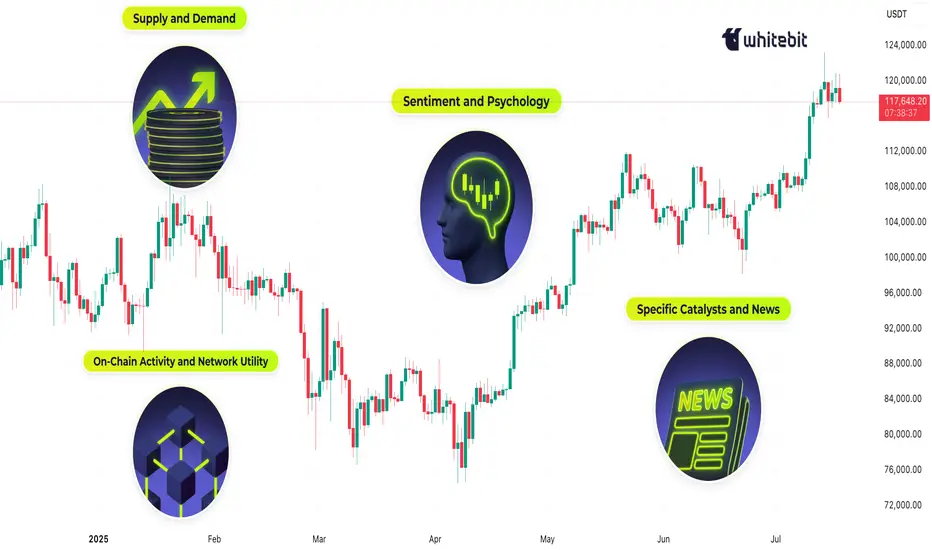
What Moves the Crypto Market?Hello, Traders!
If you’ve spent any time staring at crypto charts, you’ve probably asked: “Why is this happening?” And the truth is… there’s never one simple answer.
Crypto markets are complex, global, 24/7 systems. The forces behind a price move can be technical, fundamental, psychological or all at once. So let’s unpack what really moves this market.
1. Supply and Demand — The Fundamentals Behind the Volatility
At its core, crypto prices are governed by supply and demand. If more people want to buy than sell, the price goes up and vice versa. But it’s not that simple.
Take Bitcoin. It has a fixed max supply of 21 million, and most of those coins are already mined. But available liquidity on exchanges is much smaller and this is where things get interesting. During bull markets, demand surges while liquid supply dries up. That creates parabolic moves. Then you have supply unlocks, token vesting schedules, and inflationary emissions all of which affect how much of a coin is flowing into the market.
Example: When Lido enabled ETH withdrawals in 2023, it shifted the ETH supply dynamics, some saw it as bearish (more unlocked supply), others bullish (greater staking confidence).
2. Sentiment and Psychology: Fear & Greed Still Rule
If you want to understand the crypto market, start by studying people. Emotions drive decision-making, and crypto is still largely a retail-dominated space. Bull runs often start with doubt, accelerate with FOMO, and end in euphoria. Bear markets move from panic to despair to apathy. The crypto psychology chart rarely lies, but it always feels different in real time.
The classic “psychological numbers in trading”, like $10K, $20K, $100K BTC, often act as invisible walls of resistance or support. Why? Because traders anchor to these round levels.
👉 We’ve covered this phenomenon in detail in a dedicated post “The Power of Round Numbers in Trading.” Highly recommend checking it out if you want to understand how these zones shape market psychology and price action.
3. On-Chain Activity and Network Utility
Fundamentals matter. But in crypto, fundamentals are on-chain. The transparency of blockchain networks provides valuable insights into fundamental usage and investor behavior, which often foreshadow price trends. On-chain metrics such as active addresses, transaction volumes, and wallet holdings offer insight into the health and sentiment of the crypto ecosystem:
Network Usage (Active Addresses & Transactions): A growing number of active addresses or transactions might indicate rising network demand and adoption. Empirical studies have found that BTC’s price strongly correlates with its on-chain activity – increases in the number of wallets, active addresses, and transaction counts tend to accompany price appreciation.
Exchange Inflows/Outflows: Tracking the movement of Bitcoin or Ether in and out of exchanges provides clues to investor intent. Large outflows from exchanges are often bullish signals – coins withdrawn to private wallets imply holders are opting to HODL rather than trade or sell, tightening the available supply on the market. For example, in late March 2025, as Bitcoin neared $90,000, exchange outflows hit a 7-month high (~11,574 BTC withdrawn in one day) mainly by whale holders, indicating strong confidence.
Mining Activity and Miner Behavior: In Proof-of-Work coins like Bitcoin, miners are forced sellers (regularly selling block rewards to cover costs), so their behavior can impact price. Periods of miner capitulation, when mining becomes unprofitable and many miners shut off or sell holdings, have historically aligned with market bottoms.
For example, in August 2024, Bitcoin experienced a miner “capitulation event”: daily miner outflows spiked to ~19,000 BTC (the highest in months) as the price dipped to around $ 49,000, suggesting that miners had dumped inventory as profit margins evaporated. Shortly after, the network hash rate quickly recovered to new highs, indicating that miners’ confidence was returning, even as the price was low.
Final Thoughts
In conclusion, the crypto market’s price movements are driven by a complex interplay of factors… Market sentiment and psychology can override fundamentals in the short run, leading to euphoric rallies or panicked crashes. On-chain metrics provide the ground truth of user adoption and big-holder behavior, often signaling trend changes before they happen. Halvings and tokenomics remind us that the code underlying these assets directly affects their value by controlling supply. And finally, specific catalysts and news events encapsulate how all these forces can converge in real time.
For enthusiasts, understanding “what moves the crypto market” is crucial for navigating its volatility. Crypto will likely remain a fast-evolving space, but its price movements are not random. They are the sum of these identifiable factors, all of which savvy market participants weigh in their quest to predict the next move in Bitcoin, Ethereum, and beyond.
What do you think? 👇🏻
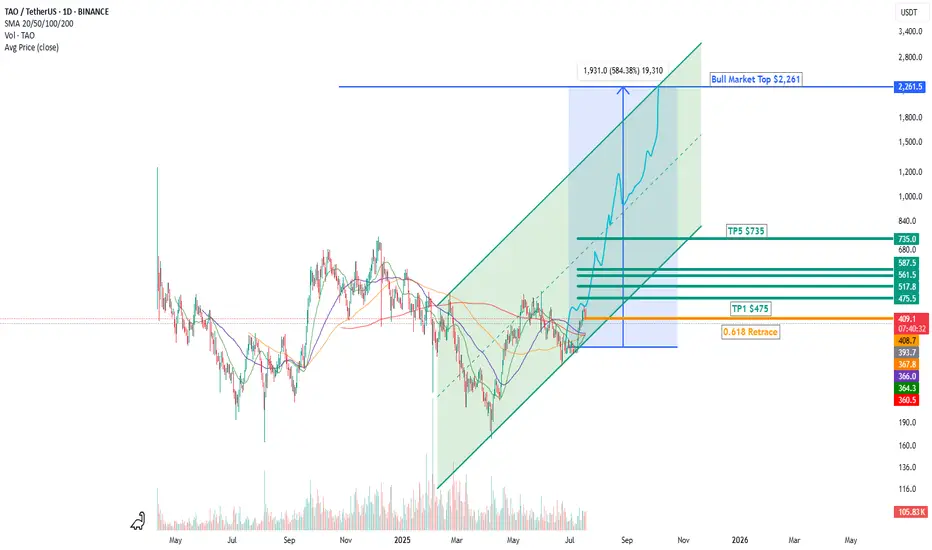
TAO Primed for Liftoff: Crypto AI Juggernaut TP $2,261 6x Min🚀 TAO Primed for Liftoff: Why This Crypto AI Juggernaut Could Be Headed to $2,261 (and Beyond)
The stars are aligning for Bittensor ( GETTEX:TAO ), one of the most structurally important and undervalued assets in the entire crypto AI sector.
📈 Technical Breakout Incoming
Let’s start with the chart. TAO has cleanly bounced off the golden Fibonacci 0.618 retracement—a classic signal that the correction is over and the next bullish impulse is underway. From here, the path of least resistance is up.
The price is hugging the bottom of a well-defined ascending channel. As long as the structure holds, TAO is set to target the next key levels:
✅ TP1: $475
✅ TP2: $517
✅ TP3: $561
✅ TP4: $587
✅ TP5: $735
💥 Ultimate Cycle Top: $2,261 to $2,505
That's a +584% move from current levels — not a meme, but a mathematically clean technical projection. The high timeframe structure supports this move into Q4 2025, where altcoin dominance typically peaks.
🧠 AI + Crypto = Trillions in Flow
TAO isn’t just riding technicals. It’s also the kingmaker of decentralized AI compute. As the base layer that incentivizes AI model training across a permissionless network, TAO is building the future of open-source intelligence—something no other crypto project is doing at this level.
🧬 But here’s where it gets nuclear...
📜 Regulatory Green Lights = Institutional Surge
In the past two weeks, two massive regulatory catalysts dropped:
🇺🇸 The U.S. Congress passed landmark digital asset legislation that legally distinguishes between commodities (like Bitcoin, Ethereum, and AI protocols like TAO) and securities. This unlocks compliance-friendly pathways for major institutional capital to flow into select altcoins.
🇨🇳 China issued regulatory clarity on AI and blockchain convergence, approving several pilot programs that incorporate decentralized machine learning. Bittensor’s model fits perfectly into this new regime, especially if TAO becomes a de facto backbone of Asian open-source AI development.
Together, this sets up a trillion-dollar liquidity wave—and tokens with utility, clear tokenomics, and AI narrative momentum like TAO will be first in line.
💡 Why TAO Stands Out in the AI Meta
✅ Scarce supply: TAO has a capped supply and deeply embedded utility.
✅ Real yield: Miners (subnets) earn TAO by providing real-world machine learning services.
✅ Community-first: Bittensor is open-source, censorship-resistant, and run by a decentralized validator set.
✅ Already powering an entire ecosystem of AI projects (not just vaporware).
🔮 What Comes Next
Expect TAO to grind its way through the targets—$475, $561, $735—and eventually break into parabolic mode toward $2,261–$2,500 as institutional capital rotates out of BTC/ETH and into deep narrative tokens during the cycle blow-off top (likely by late Q4 2025).
If you missed Bitcoin at $1,000 or ETH at $30, this is your second chance.
🧠 TAO is not a trade. It’s the neural backbone of the decentralized AI economy.
📌 Conclusion:
🟢 Technically primed (0.618 bounce, channel structure)
🟢 Regulatory tailwinds (U.S. + China)
🟢 AI narrative apex
🟢 Structural tokenomics
🔵 Price Target: $2,261–$2,505 this cycle
TAO is not just a coin. It’s the protocol layer for the AI-powered internet.
📡 Get positioned. This is where narrative, structure, and capital flow converge.
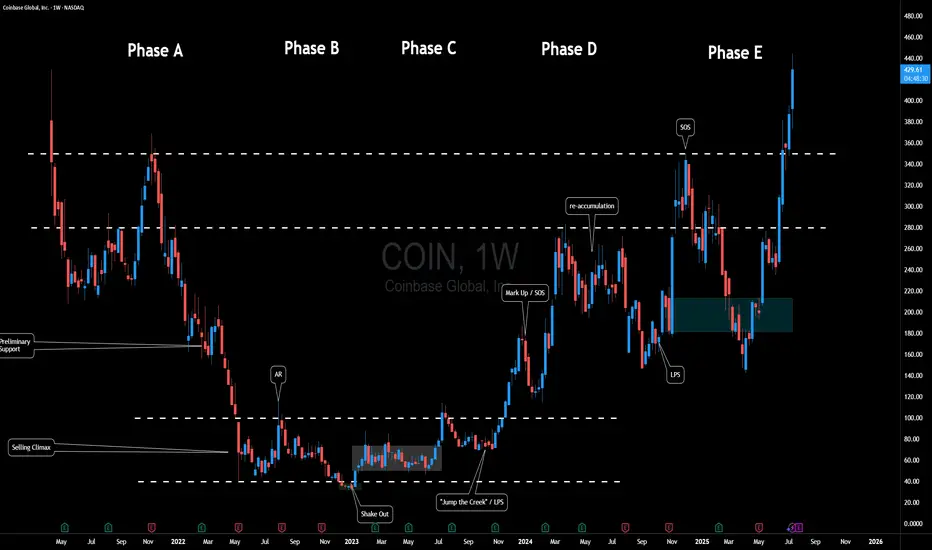
$COIN Fun Wyckoff InterpretationHere's a fun Wyckoff-inspired take on Coinbase Global ( NASDAQ:COIN ) over the past few years, mapping its weekly chart to the classic Accumulation Schematic. Wyckoff's method, envisioning the "Composite Man" quietly scooping up shares during weakness before blasting off... fits COIN perfectly, especially in crypto's wild swings.
We can see a textbook multi-year accumulation from mid 2022, a breakout into markup in 2024, and even a cheeky re-accumulation mid-2024 to fuel the latest highs.
Phase A: Stopping the Downtrend
After the initial IPO Coinbase experienced quite a bit of downside pressure.
Eventually price began to range between $40 and $100.
Phase B: Building Cause
Months of boring sideways chop.
Sellers exhausted because let's think for a moment... If crypto was truly going to stick around - how much lower could this thing go?
Smart money absorbs.
Phase C: The Trap
That shakeout low at ~$32 in early 2023. If you study Wyckoff, this is Schematic #1 vibes.
Phase D: Demand Dominates
Explosive rally (SOS) to ~$280 in early 2024, breaking the range on surging volume.
Mid-2024 pullback to ~$150 acts as a mini Re-Accumulation with its own LPS at the low. Higher lows / mitigation confirm no real distribution yet. Another SOS post-re-accumulation, pushing toward $400+.
Phase E: Markup Phase
Where will the composite man be eyeing for the next target?
Overall, Crypto adoption's heating up (BTC ETF flows, regulatory, etc), and the chart's still in a strong uptrend. But remember, Wyckoff's not crystal ball... it can however be used as a roadmap to navigate the chart.
Fun fact: COIN often mirrors BTC, so keep an eye out for correlation.
What's your opinion - accumulation complete or more shakeouts ahead? 🚀📈
Disclaimer: Not financial advice; DYOR! Chart based on weekly data up to July 2025.
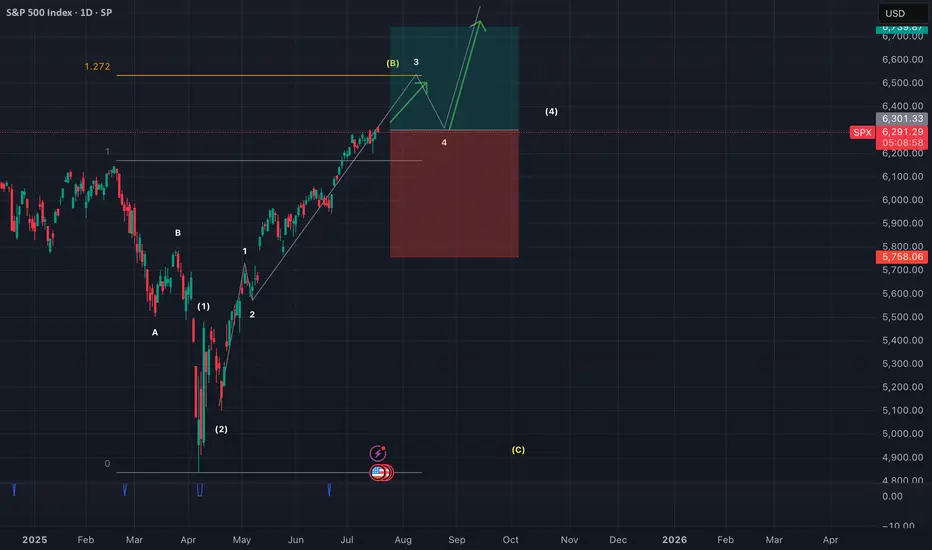
SPX500 in bullish impulseSPX500 currently at 3rd wave of wave (3) (both 2.618% extended). Expecting a retrace at 6517 region for wave 4.
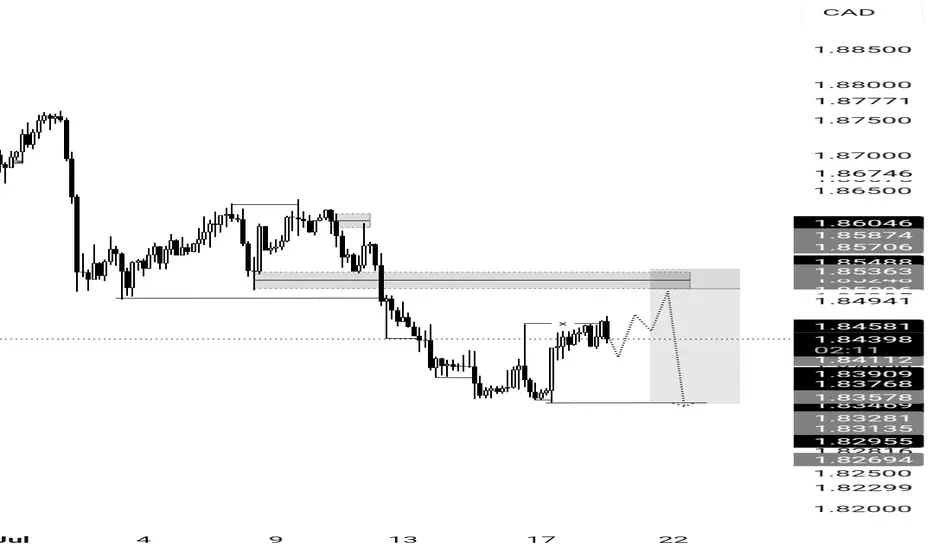
GBPCAD SELL IDEAFundamental:to cut rates thrice this year, in August, November and December. Money markets are pricing in a total of 48.6 basis points of BoE rate cuts by the year-end, with a 77.3% probability of a 25 basis point move in August.
Technical:A classical Breakerblock entry type to continue move lower
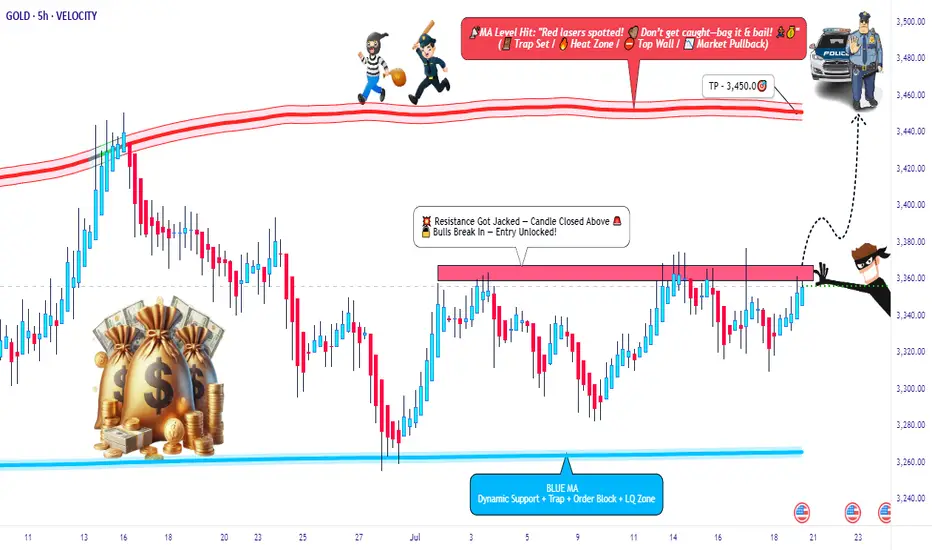
XAU/USD Breakout Playbook – Rob the Market!🚨💰 GOLD HEIST IN MOTION! | XAU/USD Thief Trading Strategy (Breakout Edition) 🏴☠️
🧠 Strategic Mindset | Not Your Average Chart Talk
Yo Market Bandits & Pip Hunters – welcome to the underground playbook!
This isn't your grandma’s chart breakdown – it’s a Thief Trading Takedown on XAU/USD (Gold), where we’re not chasing the market… we’re outsmarting it.
THE MASTER PLAN: Enter Like a Ghost, Exit Like a King 👑
📍 ENTRY POINT – The Break-In Begins!
💥 Breakout Level: Watch for 3370.00 resistance to crack – this is our green light.
🕵️♂️ Entry Style:
• Buy Stop above MA resistance zone (fast & clean)
• OR Buy Limit near swing low zones after confirmation pullback (sniper entry)
🧠 Thief Tip: Wait for the breakout to happen. No orders, no SL before it. Patience is profit.
🔄 Layer the Entry:
• Deploy DCA (Dollar Cost Averaging) or scaling entries with precision
• Build positions like stacking cash bags — smart, silent, and calculated
🛡️ PROTECT THE LOOT – Stop Loss Logic 💣
📍 SL Guide: 3310.00 (4H swing low – update as price structure evolves)
🔥 SL ONLY comes after breakout. Set it too early? That’s how you get caught.
⛔ No pre-breakout orders. No early SL. Stay invisible till it's go time.
🎯 THE ESCAPE – Profit Like a Phantom 🚀
💸 Take Profit: 3450.00
📉 Scalpers: Trail SL as price pushes – never give back stolen pips
🌀 Swing Traders: Monitor resistance layers – don’t let the bulls turn on you
🧭 CONTEXT – Why This Setup?
🔍 Macro Snapshot:
• Trend: Neutral/Bullish Lean
• Influencers: COT reports, geopolitical tension, dollar flows
• Sentiment Shifting – watch the herd, but don’t run with it
🗞️ News Risk: Don’t get wrecked by events! Avoid entries during high-impact news.
🚨 Trailing SL is your best weapon during volatility.
⚡ POWER UP THE CREW – Support the Movement
💬 Drop a comment, hit the 🔥 like button, and share with your trading gang
More Thief Trading blueprints coming soon – bigger breakouts, cleaner setups
⚠️ STAY SHARP, THIEVES!
This ain't financial advice – it’s an outlaw’s edge on the market.
Trade smart. Risk well. Protect the bag.
🏴☠️ XAU/USD GOLD HEIST IN PROGRESS... Join the Movement. Let’s Rob the Market.
China50 Target Locked | Long Setup via Thief Strategy🏴☠️ CHINA50 Market Robbery Blueprint 🔥 | Thief Trading Style (Swing/Day Plan)
🌍 Hey Money Makers, Chart Hackers, and Global Robbers! 💰🤑💸
Welcome to the new Heist Plan by your favorite thief in the game — this time targeting the CHINA50 Index CFD like a smooth criminal on the charts. 🎯📊
This is not your average technical analysis — it's a strategic robbery based on Thief Trading Style™, blending deep technical + fundamental analysis, market psychology, and raw trader instincts.
💼 THE SETUP — PREPARE FOR THE ROBBERY 🎯
We're looking at a bullish operation, setting up to break into the high-value vaults near a high-risk, high-reward resistance zone — beware, it's a high-voltage trap area where pro sellers and bearish robbers set their ambush. ⚡🔌
This plan includes a layered DCA-style entry, aiming for max profit with controlled risk. Chart alarms on, mindset ready. 🧠📈🔔
🟢 ENTRY: "The Robbery Begins"
📍 Zone-1 Buy: Near 0.63700 after MA pullback
📍 Zone-2 Buy: Near 0.62800 deeper pullback
🛠️ Entry Style: Limit Orders + DCA Layering
🎯 Wait for MA crossover confirmations and price reaction zones — don’t chase, trap the market.
🔻 STOP LOSS: "Plan the Escape Route"
⛔ SL for Pullback-1: 13540 (4H swing low)
⛔ SL for Pullback-2: 13350
📌 SL placement depends on your position sizing & risk management. Control the loss; live to rob another day. 🎭💼
🎯 TARGET ZONE: “Cash Out Point”
💸 First TP: 14100
🏁 Let the profit ride if momentum allows. Use a trailing SL once it moves in your favor to lock in gains.
👀 Scalpers Note:
Only play the long side. If your capital is heavy, take early moves. If you’re light, swing it with the gang. Stay on the bullish train and avoid shorting traps. Use tight trailing SL.
🔎 THE STORY BEHIND THE HEIST – WHY BULLISH?
CHINA50 shows bullish momentum driven by:
💹 Technical bounce off major support
🌏 Macroeconomic & geopolitical sentiment
📰 Volume + sentiment shift (risk-on)
📈 Cross-market index confirmation
🧠 Smart traders are preparing, not reacting. Stay ahead of the herd.
👉 For deeper insight, refer to:
✅ Macro Reports
✅ COT Data
✅ Intermarket Correlations
✅ CHINA-specific index outlooks
⚠️ RISK WARNING – TRADING EVENTS & VOLATILITY
🗓️ News releases can flip sentiment fast — we advise:
❌ Avoid new positions during high-impact events
🔁 Use trailing SLs to protect profit
🔔 Always manage position sizing and alerts wisely
❤️ SUPPORT THE CREW | BOOST THE PLAN
Love this analysis? Smash that Boost Button to power the team.
Join the Thief Squad and trade like legends — Steal Smart, Trade Sharp. 💥💪💰
Every day in the market is a new heist opportunity — if you have a plan. Stay tuned for more wild robbery blueprints.
📌 This is not financial advice. Trade at your own risk. Adjust based on your personal strategy and capital. Market conditions evolve fast — stay updated, stay alert.

Is Genius act , really genius ?!In my view GENIUS act is really harmful for crypto. It will force stablecoin issuers to buy a huge amount of U.S. treasuries/debt to stay in the U.S.
For the largest stable coin tether, we have two scenarios here:
1. Tether complies:
If the largest stablecoin, Tether, complies, the entire crypto market will become tightly bound to the U.S. economy. So, if the U.S. economy takes a dive, crypto will follow—hard. We already see correlation, but this will supercharge it.
On top of that, a crypto selloff could trigger one of these stablecoins to go bankrupt, forcing them to dump their U.S. treasuries, which would send shockwaves through the U.S. economy itself.
2. Tether refuses:
If Tether rejects this requirement, the U.S. might ban it. That could trigger a massive market crash. Worse, Tether might start to depeg from the dollar, like Luna did — and we all remember how that ended: absolute bloodbath.
Also it's fun to know how Chatgpt as an unbiased viewer thinks about genius act and it's relation with alt coins pump :
1. “Regulation = legitimacy” hopium
People see the GENIUS Act and think:
"OMG crypto is finally legal in the U.S. Let’s YOLO into everything that’s not a stablecoin!"
So even though the law targets stablecoins, it gives the illusion that altcoins are now “safe” to buy. Spoiler: they’re not.
2. USDC & Tether under pressure → people rotate into altcoins
Smart money’s thinking:
"If stablecoins get frozen or boring, let's ride the volatility wave elsewhere."
➡️ So they ditch stablecoins or high-cap BTC/ETH and ape into altcoins for bigger upside (or gambling addiction, whichever).
3. Low-cap alts pump on hype & narrative
Always happens. Whenever a big regulatory event hits:
ETH L2s pump (Polygon, Arbitrum)
Privacy coins get spicy (Monero, Zcash)
Meme coins go nuts (because why not)
Layer-1s and DEX tokens get love (Solana, Avalanche, Uniswap)
Everyone's front-running some imaginary future utility.
4. Retail sees green candles and FOMOs in
You know how it goes:
Twitter says “GENIUS Act = bullish for crypto”
TikTokers scream “ALT SEASON BABY 🚀”
People ape into garbage with 12 commas in the name
So prices go up. Until they don’t.
⚠️ WARNING: This pump is not based on fundamentals
It’s pure:
Misinterpretation
Speculation
Short-term rotation
a sprinkle of dumbass energy
It can reverse fast if market digests the actual legal implications.
Altcoins are pumping because people mistakenly think regulation = approval = pump season. Also because crypto traders have the attention span of a goldfish on Adderall.

Explosion Imminent?As Bitcoin ( BINANCE:BTCUSDT ) is digesting price action towards further continuation of its preceding trend (Up), BINANCE:XRPUSDT is a prime candidate to gain great percentages to the upside, as a saying goes....
"A rising tide lifts all boats"


EURUSD 1st Sell EntryEntry: 1.16216
Stop Loss (R): 1.16516
Take Profit (4R): 1.15016
*Disclaimer: I will not accept liability for any loss or damage, including without limitation to any loss of profit, which may arise directly or indirectly from use of or reliance on such information.

buy ideahi all. price return at 11 from middle of the know where and will react to a special level. be happy(wink)
