AMZN Earnings Flush — Gamma Flip to the Downside. 8/1AMZN Earnings Flush — Gamma Flip to the Downside, Eyes on $215 Support!
🔍 GEX & Options Flow Insight (1st Image Analysis)
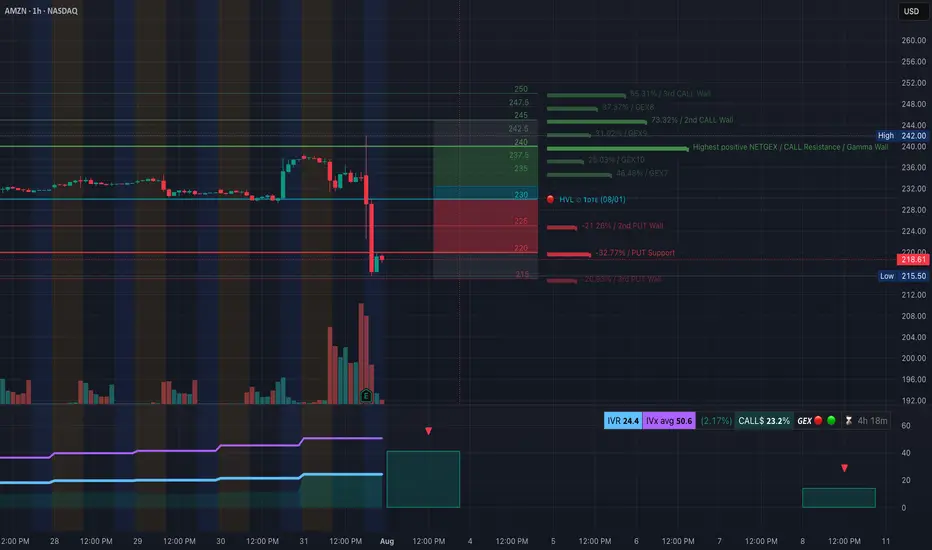
AMZN collapsed post-earnings, breaking through major gamma support levels and flipping into a negative gamma environment. Price is now pressing against a critical $215–218 demand zone, with GEX showing heavy put concentration.
* Call Walls & Resistance:
* 📍 $230.00–$234.00 → Former gamma pivot now acting as strong resistance
* 📍 $237.50 → Prior support zone; now a sell wall
* 📍 $244.00 → Highest Positive NET GEX / Gamma Wall (too far for immediate recovery unless momentum shifts)
* Put Walls & Support Zones:
* 🛡️ $222.18 → 2nd Put Wall resistance-turned-support
* 🚨 $218.00 → Current price — key defense line
* 📉 $215.50 → Hard put wall support — losing this could accelerate selloff toward $210
* Volatility Insight:
* IVR 24.4, IVx Avg 50.6 → Elevated IV post-earnings
* Call flow 23.2% → Bearish options flow bias
* GEX sentiment: 🔴🟡🔴 = Negative gamma = higher volatility risk to downside
✅ Option Trading Suggestion:
Bias: Bearish unless AMZN reclaims $224+
Strategy: Bear put spread
* Entry Idea: Buy 220P / Sell 215P for Aug 2 or Aug 9 expiry
* Invalidation: Strong daily close above $224
* Target: $215 → $210
Why this works: Negative gamma positioning means market makers hedge by selling into weakness, accelerating downside moves. The inability to reclaim $224 confirms the bearish structure.
🧠 Technical Analysis (1H Chart) (2nd Image Analysis)
Market Structure & SMC:
* 🟥 CHoCH confirmed after earnings drop
* ❌ Lost all recent BOS levels in one sharp flush
* Price trapped under former OB resistance at $224–230
Trendline Dynamics:
* Broke out of prior bullish channel to the downside
* New descending channel forming with lower highs
SMC Zones:
* 🟩 Demand Zone: $215.50–$218.00 → Immediate defense
* 🟥 Supply Zone (Purple Box): $224–$230 → Sell wall
🔄 Price Action & Key Levels
* Support:
* ✅ $218.00 → Current defense
* ✅ $215.50 → Last line of gamma support
* 🚨 Below $215.50 → Sell momentum can accelerate to $210
* Resistance:
* 🚩 $224.00 → First reclaim needed for relief rally
* 🚩 $230.00–$234.00 → Heavy resistance
🧭 Scalping / Intraday Trade Setup
🟥 Bearish Setup (Preferred):
* Entry: Failed reclaim of $224
* Target 1: $218.00
* Target 2: $215.50
* Stop: Above $224
🟩 Bullish Reversal Setup:
* Entry: Strong reclaim of $224 with volume
* Target 1: $230.00
* Target 2: $234.00
* Stop: Back under $222
🔁 Summary Thoughts
* AMZN flipped from bullish gamma to negative gamma — puts are now driving price action.
* As long as price stays under $224, rallies are sell opportunities.
* Losing $215.50 risks an accelerated drop to $210 or lower.
* Bears remain in control unless buyers step in aggressively at support.
🚨 Disclaimer:
This analysis is for educational purposes only and does not constitute financial advice. Always do your own research and manage your risk accordingly.
Beyond Technical Analysis
MSFT Post-Earnings Surge. 8/1MSFT Post-Earnings Surge — Consolidation Before Another Leg Up or First Sign of Exhaustion?
🔍 GEX & Options Flow Insight (1st Image Analysis)
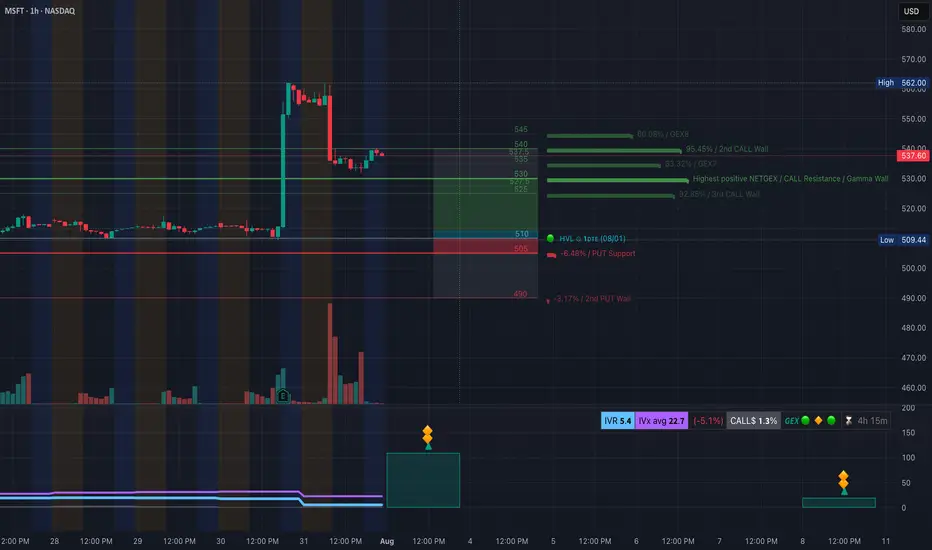
Microsoft exploded higher after earnings, reaching the mid-$530s before pulling back slightly. It now sits between strong gamma support and a major Call Wall cluster, indicating a consolidation phase that could lead to either a continuation move or a deeper retracement.
* Call Walls & Resistance:
* 📍 $537.60 → Current price zone, right under minor gamma resistance
* 📍 $540.00 → 2nd Call Wall (95.45% GEX7)
* 🧱 $545–$562 → GEX8/extension zone for a bullish breakout target
* Put Support Zones:
* 🛡️ $530–$525 → Gamma pivot area; losing this would weaken bullish positioning
* 📉 $510.00–$505.00 → Strong HVL + PUT wall support
* 🚨 $490 → Second PUT wall = major breakdown trigger
* Volatility Insight:
* IVR 5.4, IVx Avg 22.7 → Low IV = cheaper premium for spreads
* Call flow 1.3% = Low aggressive bullish positioning
* GEX sentiment: 🟢🟡🟢 = Still supportive for consolidation with bullish lean
✅ Option Trading Suggestion:
Bias: Bullish consolidation, but near-term capped under $540 unless volume expansion
Strategy: Debit call spread for limited risk
* Entry Idea: Buy 540C / Sell 550C for Aug 2 or Aug 9 expiry
* Invalidation: Daily close under $525
* Target: $545 short-term, $562 on breakout
Why this works: MSFT is supported by gamma positioning above $525 and could make a clean push toward $545+ if earnings momentum continues. Spreads help protect from IV crush after earnings.
🧠 Technical Analysis (1H Chart) (2nd Image Analysis)
Market Structure & SMC:
* ✅ Clear BOS (Break of Structure) on earnings gap
* 🟢 Price is consolidating within the post-gap range
* ⚠️ Potential CHoCH forming if price fails $525, which would indicate weakness
Trendline Dynamics:
* Holding above short-term uptrend support line
* Still in a steep post-gap bullish channel
SMC Zones:
* 🟩 Demand / OB Zone: $530–$525 → High-probability bounce area
* 🟥 Supply Zone (Purple Box): $538–$545 → Overhead resistance from post-gap highs
🔄 Price Action & Key Levels
* Support:
* ✅ $530–$525 → First defensive zone
* ✅ $517–$513 → Secondary support
* 🚨 $510–$505 → Hard gamma floor
* Resistance:
* 🚩 $540 → 2nd Call Wall resistance
* 🚀 $545–$562 → Extension zone if breakout occurs
🧭 Scalping / Intraday Trade Setup
🟩 Bullish Setup:
* Entry: $530–$532 dip reclaim
* Target 1: $540
* Target 2: $545–$550 extension
* Stop: Close under $525
🟥 Bearish Pullback Setup:
* Entry: Rejection at $540
* Target 1: $530
* Target 2: $525
* Stop: Breakout above $540 with volume
🔁 Summary Thoughts
* MSFT has post-earnings momentum but is consolidating just below a Call Wall cluster.
* Holding $525–$530 keeps the bullish case alive toward $545+.
* Options are cheap enough for defined-risk bullish spreads, but caution if $525 breaks.
* Expect range-bound chop until a decisive breakout over $540 or a breakdown under $525.
🚨 Disclaimer:
This analysis is for educational purposes only and does not constitute financial advice. Always do your own research and manage your risk accordingly.
META’s Monster Gap — Gamma Ceiling. 8/1META’s Monster Gap — Gamma Ceiling at $785 or Room to Run Past $800?
🔍 GEX & Options Flow Insight (1st Image Analysis)
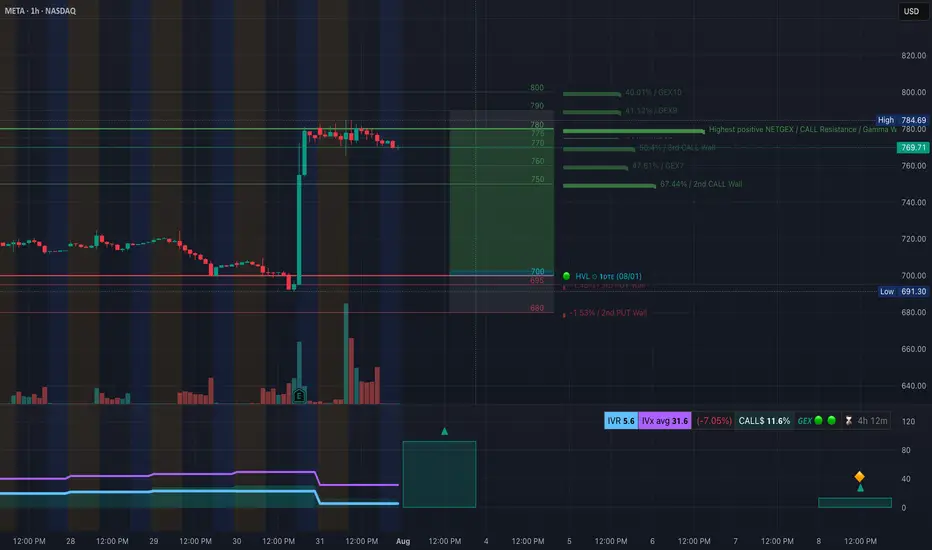
META ripped higher on earnings momentum, gapping from the $690s into the $770s, and is now stalling just under the Gamma Wall / Highest Positive NET GEX at $784.69. Options positioning shows bullish gamma support but overhead resistance could trigger a stall or pullback before another leg up.
* Call Walls & Resistance:
* 📍 $784.69 → Highest positive NET GEX / Gamma Wall
* 📍 $800.00 → GEX10 & GEX9 ceiling = ultimate squeeze target if momentum continues
* Put Support Zones:
* 🛡️ $750.00 → Key 2nd Call Wall zone now acting as gamma support
* 📉 $700.00 / $691.30 → HVL zone + hard put support
* 🚨 Breakdown below $691 opens the door to a deep retracement
* Volatility Insight:
* IVR 5.6, IVx Avg 31.6 → Low IV = cheaper premium for directional plays
* Call flow 11.6% = Not euphoric, but bullish sentiment
* GEX sentiment: 🟢🟢🟢 = Long gamma environment, supportive of dips
✅ Option Trading Suggestion:
Bias: Bullish but extended — watch for consolidation before breakout
Strategy: Debit call spread (protects from IV crush)
* Entry Idea: Buy 780C / Sell 800C for Aug 2 or Aug 9 expiry
* Invalidation: Breakdown under 750 with volume
* Target: 785 → 800 on continuation
Why this works: META is riding strong bullish gamma positioning. As long as it holds above $750, dealer hedging supports price. Break above $785 could trigger short gamma acceleration to $800. But extended after earnings, so controlled size is key.
🧠 Technical Analysis (1H Chart) (2nd Image Analysis)
Market Structure & SMC:
* ✅ BOS + CHoCH sequence with a massive impulsive move from liquidity grab under $700
* 📈 Price is currently in the supply zone (purple box $768–$784) from historical resistance alignment
* 📊 First consolidation post-gap — watching for either breakout or gap-fill attempts
Trendline Dynamics:
* Strong bullish breakout from long consolidation
* Price is riding the upper slope of a sharp post-gap channel
SMC Zones:
* 🟩 Demand / OB Zone: $750–$724 → Ideal dip buy zone if retested
* 🟥 Supply Zone (Purple Box): $768–$784 → Current battle zone
🔄 Price Action & Key Levels
* Support:
* ✅ $750 → Former resistance, now key support
* ✅ $724 → Fib retracement confluence
* 🚨 $700 / $691.30 → HVL & hard gamma put wall
* Resistance:
* 🚩 $784.69 → Gamma Wall + supply top
* 🧨 $800 → Ultimate squeeze ceiling
🧭 Scalping / Intraday Trade Setup
🟩 Bullish Setup:
* Entry: $770–$772 dip reclaim
* Target 1: $784.69
* Target 2: $800 extension
* Stop: Close under $750
🟥 Bearish Pullback Setup:
* Entry: Rejection at $784.69
* Target 1: $760
* Target 2: $750
* Stop: Breakout above $785
🔁 Summary Thoughts
* META just printed a post-earnings breakout that could keep running into $785–$800 if gamma fuel continues.
* First consolidation after the gap is critical — if bulls defend $750, breakout setups remain strong.
* Caution chasing highs; better reward/risk comes from pullback buys into $750–$760.
* Dealers are long gamma, which supports range-bound chop with bullish bias.
🚨 Disclaimer:
This analysis is for educational purposes only and does not constitute financial advice. Always do your own research and manage your risk accordingly.
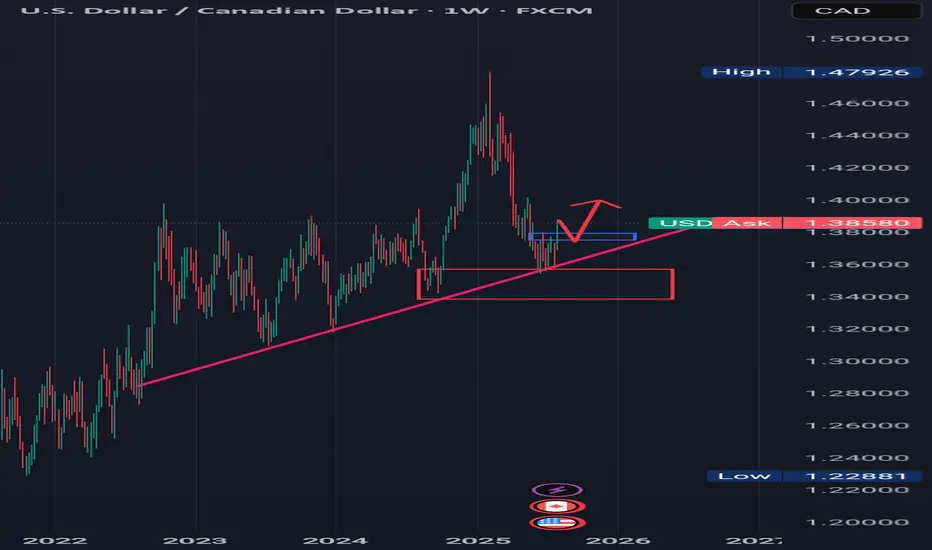
TREND REVERSAL CONFIRMATION Looking at the weekly timeframe for USDCAD, we can see that price action has respected a rising trendline and also reacted to a weekly bullish order block.
The Sell momentum for USDCAD has come to an end, so now we saw price action accumulating around the rising trend line and bullish order block.
Now there's a minor resistance which is indicated with a small blue rectangle in which price action has broken to the upside, I'm expecting price to complete an impulse correction leg or retrace to the blue rectangle or minor resistance and then from there continue to the upside.
........,...,.............................................
Please share your thoughts on this analysis, do you think the downward trend is over.
EURGBP: Bearish Continuation from Reclaimed Order Block!Greetings Traders,
In today’s analysis of EURGBP, we observe that institutional order flow on the H4 timeframe has recently shifted bearish. This provides us with a clear directional bias to look for shorting opportunities in line with the prevailing higher timeframe trend.
Higher Timeframe Context:
On the weekly timeframe, price action is currently drawing towards a Weekly Fair Value Gap (FVG). This bearish draw on liquidity confirms the macro-level bearish sentiment. With the recent bearish market structure shift (MSS) on the H4, we now have strong confluence between the weekly and intraday order flow, favoring continued downside.
Key Observations on H4:
Reclaimed Bearish Order Block: After shifting structure to the downside, price has retraced into a bearish reclaimed order block—a region previously marked by institutional selling. This return to the origin of prior sell-side imbalance offers institutions the opportunity to mitigate earlier positions and reinitiate shorts. The failure of price to break higher confirms bearish intent.
Confluence with Weekly Draw: The reclaimed order block aligns with the broader draw towards the weekly FVG, providing an optimal zone for bearish confirmation entries.
Trading Plan:
Entry Strategy: Look for lower timeframe confirmation entries within the H4 reclaimed order block.
Target: The short-term target remains the Weekly Fair Value Gap, supporting a discount-side delivery.
As always, remain disciplined in execution. Let the market confirm your bias before entering, and manage risk according to your rules.
For a detailed market walkthrough and in-depth execution zones, be sure to watch this week’s Forex Market Breakdown:
Kind Regards,
The Architect 🏛️📉

RDDT Earnings Setup (2025-07-31)
### 🔥 RDDT Earnings Setup (2025-07-31)
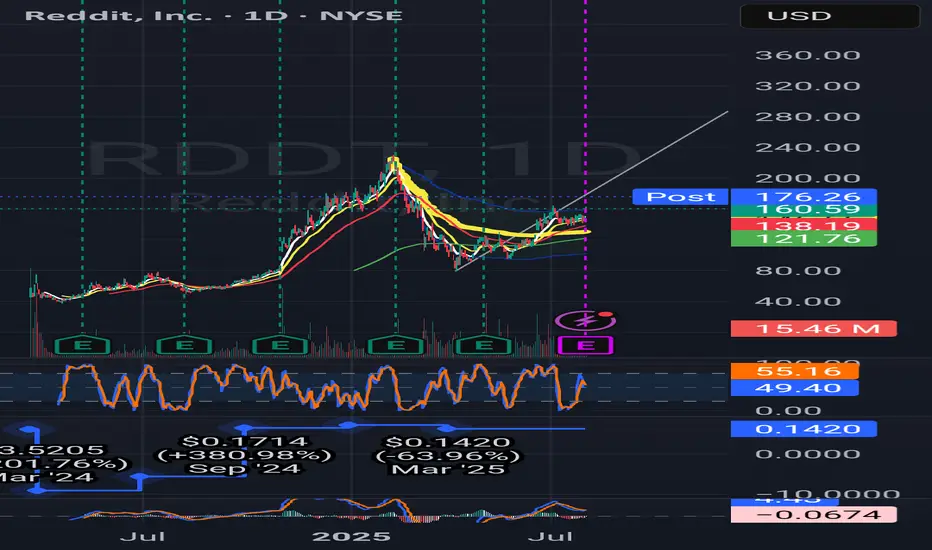
📈 **Bullish Bias | Confidence: 75%**
🎯 Target: \$165+ | 🔒 Resistance: \$155.58
---
### 📊 FUNDAMENTALS
* 📈 **Revenue Growth (TTM): +61.5%**
* 💰 **Gross Margin**: 90.8%
* ⚠️ **Op Margin**: 1.0% (Thin runway)
* 💥 EPS Surprise Avg: **+191% (5/5 beat streak!)**
* 📉 EPS Growth Est: **-86.6%** → low bar = potential upside
**🧠 Fundamental Score: 7/10**
---
### 🧠 OPTIONS FLOW
* 🔵 **\$172.00C** building OI
* 💸 IV Rank \~0.75 (Move priced in!)
* 🧲 Bullish call activity > puts
* 🛡️ Put skew = hedged upside
**📊 Options Score: 7/10**
---
### 📈 TECHNICAL SETUP
* ✅ Above 20DMA
* 🔥 RSI: 62.2 = strength but not overbought
* 📦 Accumulation spike
* 🔐 Resistance: \$155.58
* 🧲 Break = squeeze setup
**📉 Technical Score: 8/10**
---
### 🌍 MACRO BACKDROP
* 🌐 Digital ad sector = support
* 🚨 Regulatory overhang = minor risk
* 🧬 Growth stock rotation helps RDDT
**🌐 Macro Score: 7/10**
---
### 🎯 TRADE IDEA
**💥 RDDT \$172.00C** (Aug 1 Exp)
* 💵 Entry: \$6.15
* 🎯 PT: \$18.45
* 🛑 SL: \$3.08
* 📈 Risk/Reward: \~3:1
* ⏱ Exit: 1–2 hrs post-earnings
* ⚖️ Sizing: 1 contract = \~\$615 risk
---
### ✅ SUMMARY
🧬 Strong rev growth + historical beat streak
🎯 Technical breakout setup + bullish flow
🚀 Potential squeeze toward **\$165+**
📣 Tag: #RDDT #EarningsPlay #OptionsFlow #RedditIPO #SwingTrade #TradingViewViral #EarningsSeason #TechStocks #CallOptions

$BTCUSDT: Fictitious Fractal 136KSo. I see we are having a relatively difficult time.
My expectations are in this range for the next appx. 125 days - 365 days.
Downside: 68.6k-69.9k
Topside: 100k to 136k (round to 150k)
I drew this fractal by hand and I want to watch it closely.
I expect in the next few weeks we hit 100k and then do a nice rug to 69k range.
This is probably wrong.
I pretty much extrapolated the red brush circle into a weeks long fractal.
I am longing all the dips to 68k.
Enjoy.
Mr. Storm.

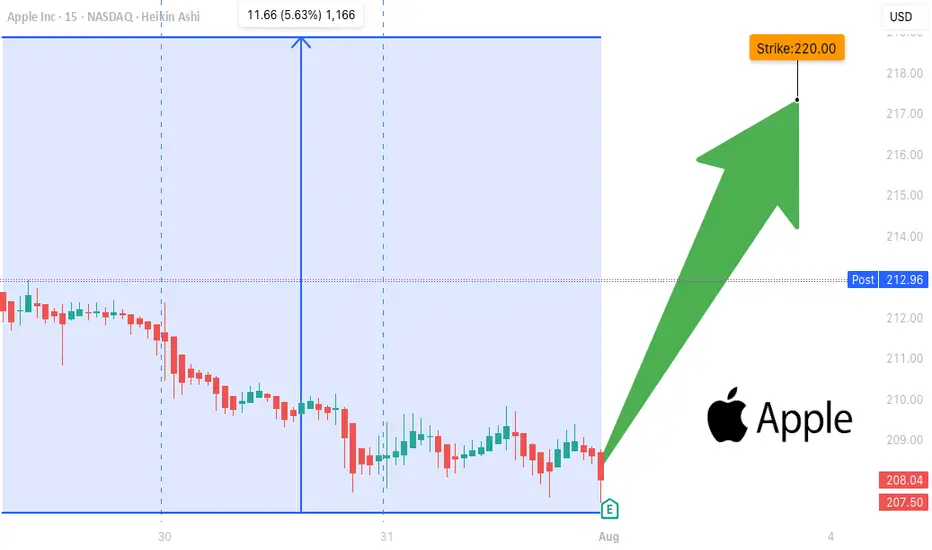
AAPL EARNINGS TRADE SIGNAL (JULY 31)
### 🍏 AAPL EARNINGS TRADE SIGNAL (JULY 31) 🚀
📊 **AAPL Call Play** — Earnings Strategy
🧠 Multi-model conviction: **75% Bullish Bias**
---
### 🔍 Fundamental Drivers
✅ TTM Revenue: +5.1%
✅ Gross Margin: 46.6%
✅ 8 straight earnings beats
⚠️ Sector shift: growth → value = caution
📉 TTM EPS Est: \$8.31 (+29.4% growth est.)
🧮 **Score**: 8/10
---
### 💰 Options Flow Breakdown
🔥 IV Rank: 0.70
🔵 Bullish OI @ \$220C = 25,950 contracts
🔻 Skew: Heavy puts @ \$197.5 / \$200
⚠️ Gamma squeeze possible near \$220
📈 **Score**: 8/10
---
### 📉 Technicals
📍 RSI: 39.3 (Oversold)
📉 Trading below 20DMA (\$211.64)
🟥 Low volume pre-earnings = low conviction
📌 Support: \$207.5 | Resistance: \$220
📉 **Score**: 6/10
---
### 🌐 Macro Setup
⚠️ Supply chain pressures
⚠️ Regulatory risk ongoing
🔄 Growth → Value rotation still underway
🌐 **Score**: 5/10
---
### 🧠 Trade Setup (Call Option)
* 🎯 **Strike**: \$220
* 💵 **Entry**: \$0.87
* 📅 **Expiry**: 08/01 (2DTE)
* 📈 **Target**: \$2.61
* 🛑 **Stop**: \$0.43
* ⚖️ **Risk**: 2% of portfolio
* ⏰ **Timing**: Enter before close, report after market
🧮 Expected Move: ±5.0%
🔒 Confidence Level: 75%
---
### ⚙️ Exit Plan
✅ Profit: Exit @ \$2.61
❌ Stop: Exit @ \$0.43
🕒 Time Exit: Force close within 2 hours post-earnings
---
📣 **EARNINGS SCALP PLAY**
— AAPL is oversold w/ strong EPS beat history
— Bullish OI stacking at \$220
— High gamma setup, low IV risk = 💥
\#AAPL #EarningsTrade #CallOption #TradingView #0DTE #OptionsFlow #GammaSqueeze #UnusualOptions #AppleEarnings #SwingTrade #TechStocks
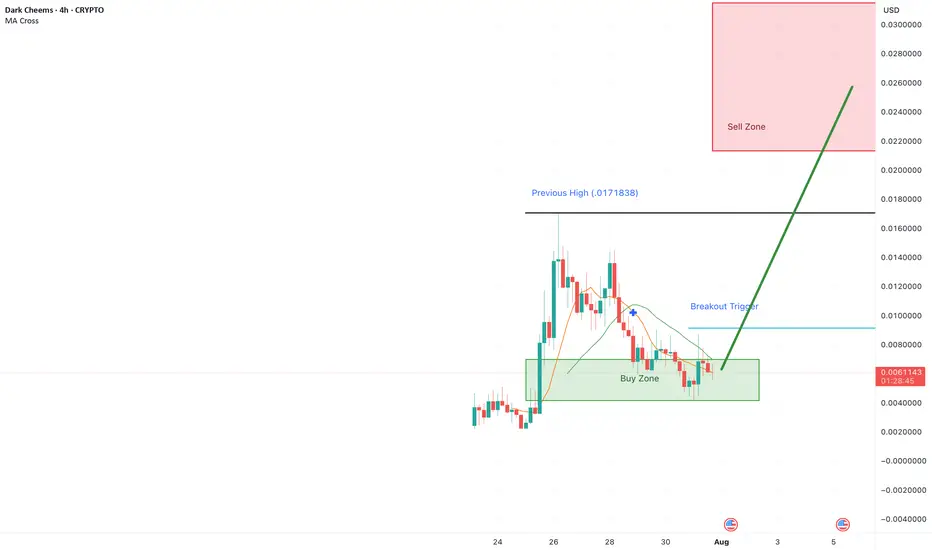
$TOTAKEKE – Dark Cheems Building Momentum? Meme Bull Run SetupOverview
Totakeke (aka Dark Cheems) is positioning itself as the “brother coin” to the well-known meme Cheems on BSC. It’s been quietly gaining attention. It has been tweeted by PancakeSwap, Trust Wallet, Four Meme, and even interactions from CZ on X! HOLY SHIII! With meme coins leading this market cycle, Totakeke’s early-stage market cap of $6.2M puts it in prime territory for explosive moves if narrative momentum holds.
Initial discovery pump around July 25–26 → price surged to 0.025 before sharp retrace.
Current -75% pullback into accumulation zone (0.0058–0.007) matches classic meme cycle setups (PEPE, BONK patterns).
Liquidity at $408K = thin books; big buys/sells swing price 20%+ easily.
Key Levels
Accumulation Zone: 0.0058–0.007
Breakout Trigger: 0.009–0.01 (close above signals next wave)
Previous ATH: 0.025 (first upside target)
Meme Extension Target: 0.04–0.05 (6–8x potential if bull run continues)
Narrative Catalyst
Strong ties to BSC meme culture (Cheems brother narrative).
Engagement by top ecosystem accounts (PancakeSwap, Trust Wallet, CZ).
Community buzz forming → potential for “viral rotation” if meme bull run expands.
Play Idea (Meme Bull Logic)
Accumulate quietly in base range; position size small due to volatility.
No tight stop-loss: meme coins wick hard; manage risk via exposure, not micro stops. aka nut up or shut up
Upside targets: 0.01 / 0.025 / 0.04 (scale out as narrative develops).
Lose 0.0058? Next support ~0.0045 (still viable base in meme context).
Totakeke fits the early-stage meme cycle template.. strong narrative tie-ins, early ecosystem attention, and chart structure that mirrors successful meme plays pre-run. If meme momentum continues across BSC, this could be one to watch for multi-x potential.
Not financial advice. Meme coins are extremely volatile... play size and timing matter more than tight TA.
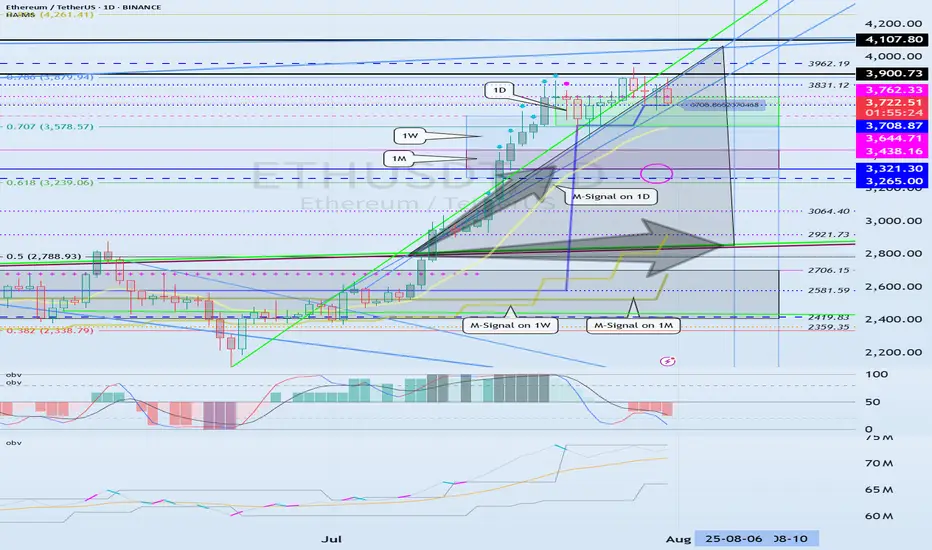
The key point to watch is whether it can rise to 3900.73-4107.80
Hello, traders. Nice to meet you.
If you "Follow," you'll always get the latest information quickly.
Have a great day.
-------------------------------------
(ETHUSDT 1D Chart)
The upward trend continues, with the M-Signal on the 1D chart > M-Signal on the 1W chart > M-Signal on the 1M chart.
Therefore, if the price holds above 3265.0-3321.30, a medium- to long-term uptrend is likely.
Currently, the HA-High ~ DOM(60) range is formed across the 3265.0-3762.33 range on the 1M, 1W, and 1D charts.
Therefore, the key question is whether support is found within the 3265.0-3762.33 range.
-
While the price is trending upward along the short-term trendline, if it falls below the short-term trendline and encounters resistance by falling below the M-Signal indicator on the 1D chart, a decline to the 3265.0-3321.30 range is likely.
ETH's volatility period is expected to last from August 6th to 10th.
The key point to watch is whether it can rise above the 3900.73-4107.80 range after this volatility period.
-
Since the StochRSI indicator has entered an oversold zone, the downside is likely to be limited.
Since the OBV indicator of the Low Line ~ High Line channel remains OBV > OBVEMA, a significant decline is unlikely.
However, since the TC (Trend Check) indicator is below zero, selling pressure is dominant.
Therefore, a decline below 3708.87 could lead to further declines. However, as previously mentioned, the decline is likely to be limited, so a significant decline is not expected.
Once the M-Signal indicator on the 1D chart is encountered, the trend is expected to re-establish itself.
-
Thank you for reading to the end.
I wish you successful trading.
--------------------------------------------------
- This is an explanation of the big picture.
(3-year bull market, 1-year bear market pattern)
I will explain in more detail when the bear market begins.
------------------------------------------------------
Please comment your opinion Greetings and respect to the analysts
This btcusd chart is on bitstamp I know the general analysis of what exists in the market, but please comment your opinion on this chart and the fractal and ascending channel that the price has always respected.

NQ GC ES, Daily Orderflow and Weekly OutlookCME_MINI:NQ1! COMEX:GC1! CME_MINI:ES1!
Time for the final AMDX

JPY/USD — Long-Term Technical Setup & Market Outlook💱 JPY/USD — Long-Term Technical Setup & Market Outlook
1. 🧭 Market Context & Catalysts
US-Japan monetary divergence: The Fed remains rate-tight while the BoJ maintains ultra-loose policy, putting persistent downside pressure on the yen.
Economic drivers: Strong US economic data (growth, labor, inflation) supports USD strength; Japan’s macro data remains soft.
Sentiment signals: Hawkish Fed tone continues; safe-haven flows may limit further USD gains in geopolitical risk shifts.
2. 🧱 Technical Structure (Daily Timeframe)
Break of structure (BOS) below 0.00700 signaled the dominant bearish regime.
The price retraced into the 0.786–0.886 Fibonacci zone (~0.00676–0.00679), then resumed selling—textbook re-entry into areas of liquidity (Equilibrium).
Current price sits near 0.006631, just below BOS and equilibrium zone—suggesting continuation of bearish order flow.
Fibonacci extensions show projected targets at 0.006632 (1.236), 0.006588 (1.382), 0.006517 (1.618), and potential support area at ~0.006400.
A stronger support zone exists near 0.006276 (Weak low / domain demand zone).
3. 📝 Trade Plan & Risk Controls
Continuation Setup: Look to enter on a clean bearish candle close near ~0.00665. Target the Fibonacci extensions at 1.236, 1.382, and 1.618—approximately 0.006632, 0.006588, and 0.006517 respectively. A deeper extension into the 0.006400 zone is also possible. Place the stop-loss just above 0.00670, as this level invalidates the recent break of structure and implies rejection of downside continuation.
Pullback Re-entry Setup: If price retraces higher, consider a re-entry short near ~0.00680. Use the same Fibonacci targets as above. Invalidate the setup if price breaks above 0.00680, which would suggest a shift toward bullish structure or absorption of the prior supply zone.
4. ⚠️ Watch Key Risks & Signals
If price breaks above the 0.786 zone or creates a higher high above equilibrium, bearish thesis fails.
Monitor US data releases: FOMC minutes, inflation or jobs data—shifts could accelerate USD momentum.
Geopolitical shocks or risk-off flows could trigger yen strength reversal.
✅ Summary Outlook
JPYUSD remains firmly bearish with technical integrity intact.
Valid corrective levels now become sell zones toward continuation targets.
Extended downside toward 0.00640 area is plausible, with further drop to 0.006276 zone if trend continues strongly.

NQ : Buy levelsAll right, the stops are off like I said in my prev NQ post.
Turns out there was an important FOMC news that I didn't notice. I don't usually trade on the news.
Now the levels where the green arrows are from are back in play. You can pips, you can scalp, you can look for longer trades from them. I usually scalp them.
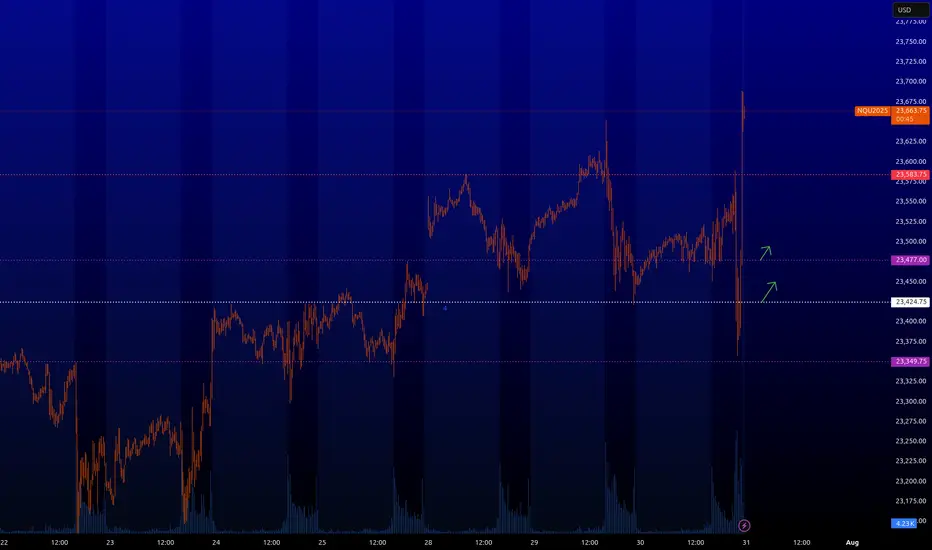
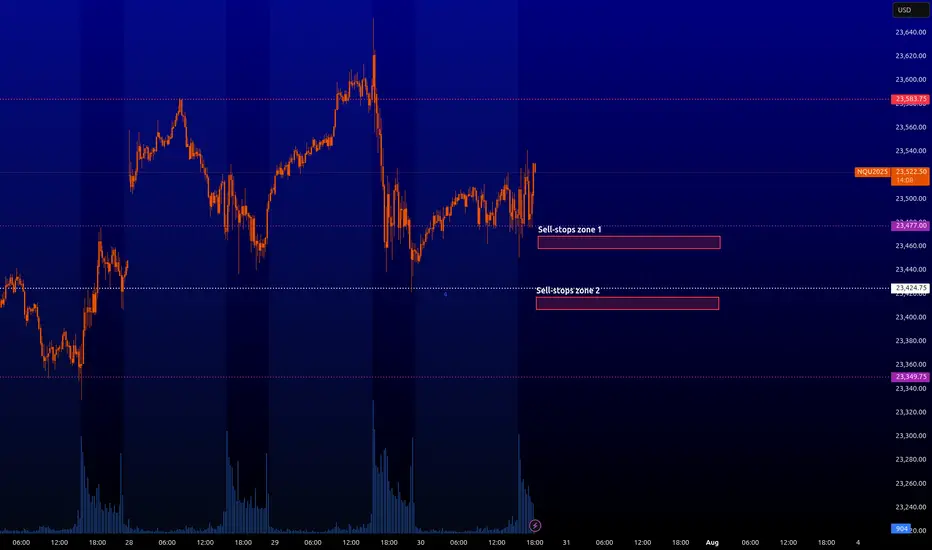
NQ : enormous amount of sell-stopsI have highlighted two zones where a lot of sell-stop orders are currently concentrated. Those who trade robots with fast buybacks, you can put your algorithms there. When entering these zones there will be a quick dropdown of the price if it comes to these zones in liquid time (American session).
Those who do not have robots, I will inform you when it will be possible to get some profit from these zones with limit trades.
31/07/25 Price break downSame again people although different model this time, kept it simple with a two stage SMT and a 4hr TPD although it arguably got indvalidated plus my 6hr tpd analysis was wrong but youll see when you hopefully watch


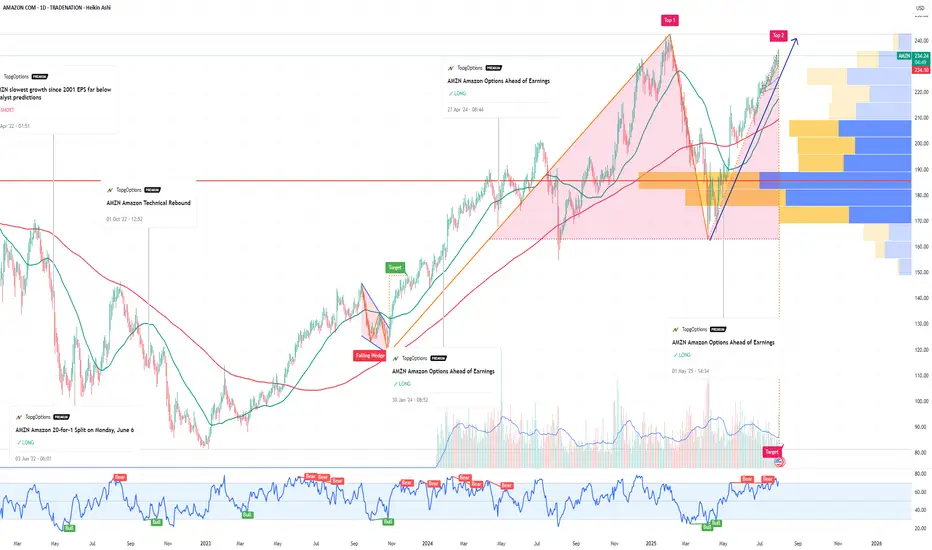
AMZN Amazon Options Ahead of EarningsIf you ahven`t bought the recent dip on AMZN:
Now analyzing the options chain and the chart patterns of AMZN Amazon prior to the earnings report this week,
I would consider purchasing the 245usd strike price Calls with
an expiration date of 2025-9-19,
for a premium of approximately $7.02.
If these options prove to be profitable prior to the earnings release, I would sell at least half of them.
Disclosure: I am part of Trade Nation's Influencer program and receive a monthly fee for using their TradingView charts in my analysis.
CRCL WEEKLY TRADE SIGNAL (JULY 31)
### 🚨 CRCL WEEKLY TRADE SIGNAL (JULY 31) 🚨
**Call Option Setup – Based on Multi-Model Consensus**
📈 **Momentum**:
🟡 RSI Daily: 46.7 (Neutral)
🟥 Volume: 0.4x last week = 🚨 Weak participation
🟢 Options Flow: Bullish (C/P Ratio = 1.42)
🌤️ VIX: Low (15.4) → Low volatility = 💰 opportunity
🔍 **Model Summary**:
✅ **Grok**: Bullish setup → RECOMMENDED TRADE
❌ Claude, DeepSeek, Gemini, Llama: No trade (weak volume + gamma risk)
🤝 ALL agree: Weak volume & mixed trend = caution
---
### 💥 Trade Setup 💥
🎯 **Direction**: CALL (Bullish bias)
💸 **Strike**: \$200
💰 **Entry**: \$0.85
📆 **Expiry**: Aug 1 (1DTE – high gamma 🔥)
🎯 **Profit Target**: \$1.11
🛑 **Stop Loss**: \$0.51
📊 **Confidence Level**: 65%
📍 **Entry Timing**: Market Open
---
### 🧠 Key Insight
📉 Weak volume = 🚫 no institutional conviction
📈 Bullish options flow = 🔥 potential short squeeze
🕓 Time-sensitive 1DTE = Fast hands needed!
---
👉 If you trade momentum, watch CRCL at open.
🧠 **Strategy**: scalp the move or exit near \$1.11
💥 High risk, high gamma, tight leash.
\#OptionsFlow #CRCL #CallOption #TradingSignal #UnusualOptionsActivity #0DTE #GammaScalp #TradingView #SwingTrade #TFlow

High Tight FlagDefinitive released an update to their trading product and a roadmap as well, which seemed to be well received by the market. Now developing a high tight flag on lower time frames. RSI reset.
Backed by Coinbase Ventures, among others


S&P 500 ETF & Index Hit Resistance – A Technical Warning Shot 📉⚠️ S&P 500 ETF & Index Hit Resistance – A Technical Warning Shot 🔍🧠
Following up on the video I just posted , I had to share this updated chart of the VOO ETF (Vanguard S&P 500) and US500 Index , now that both are testing key resistance levels.
On the left: AMEX:VOO has reached the very top of a multi-year ascending channel—a zone that has historically triggered sharp corrections. The level at 590.85 marks a major resistance zone.
On the right: The US500 Index is showing a similar technical overextension, trading just under 6,450, with 5,928.25 as the nearest support below.
🎯 Technicals at play:
VOO could retrace toward 526.17 and potentially 465.72, both of which are solid technical supports within this channel.
This setup doesn't mean panic—but it does argue for caution, especially after such an extended run.
🧠 And yes, the Buffett Indicator (Stocks-to-GDP) continues to point toward an overheated market . While it's not a timing tool, it adds macro weight to the technical signals.
In the video, I also touched on:
Taking profits on NASDAQ:NVDA after a near-perfect technical rejection at target.
Reviewing Rolls Royce nearing upper channel resistance.
Gold and Silver at inflection points—likely to be impacted if equities begin to unwind.
Rotational potential into Bitcoin and Ethereum, which may benefit from macro shifts.
This is how I trade: respect structure, stay proactive, and prepare before the move—not after. Let me know how you’re positioning or if you’re sitting on hands waiting for a dip.
One Love,
The FX PROFESSOR 💙
Disclosure: I am happy to be part of the Trade Nation's Influencer program and receive a monthly fee for using their TradingView charts in my analysis. Awesome broker, where the trader really comes first! 🌟🤝📈
