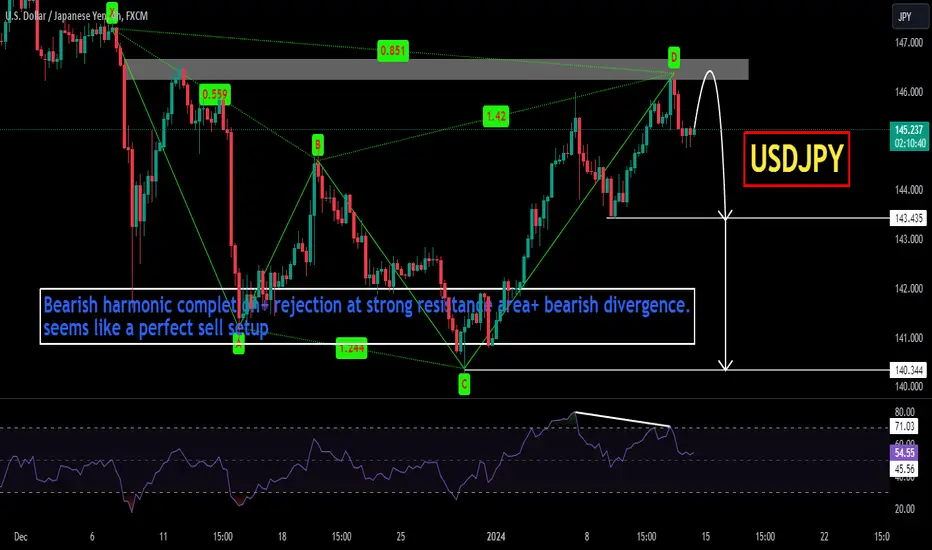
USDJPYIs USDJPY exhausting at strong resistance level?
As the price is been on high bull run but now it seems like price is lacking bullish momentum after reaching at resistance level and bearish divergence suggesting the sell pressure is about to start.
If the bears took control , the 1st target could be 143 followed by 140.
What you guys think of it?
Beyondtechnicalanalysis
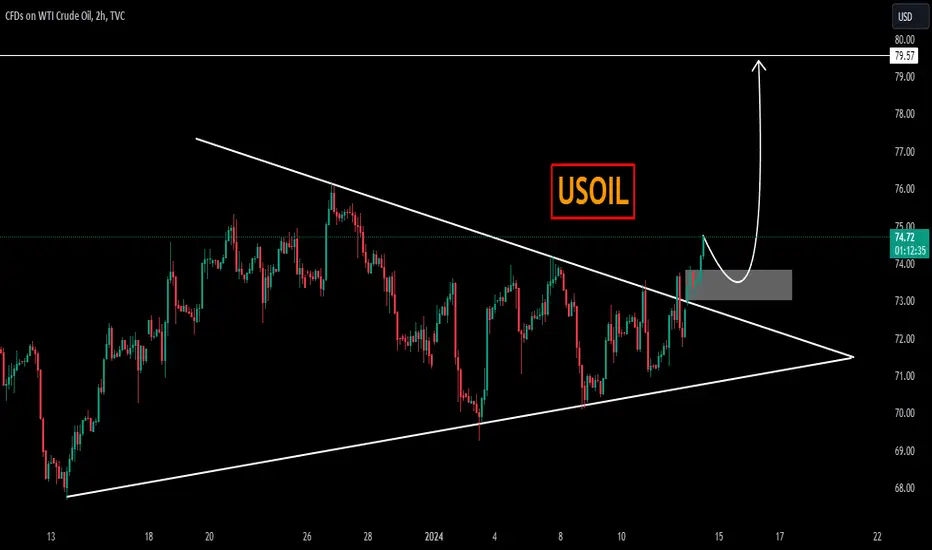
USOILUSOIL is trading in symmetrical triangle pattern. The price was reacting well the support and resistance of triangle.
Currently the price is trading at the apex of the triangle and is about to give the breakout of triangle and now retesting the broken level where it is also forming a local support zone and seems like the price may go for another leg higher.
If the breakout sustain to upside the optimum target could be 79.
What you guys think of this idea?
Buy GBPJPY Bullish ChannelGBP/JPY - Bullish Channel formation in M30 Chart
UK - GDP, Industrial Production, Manufacturing Production and Trade Balance in Next 40 Mins
Thank you

BUY GBPUSD H4 ChannelCentral Bank Meetings:
Bank of England Monetary Policy Committee (MPC): This takes center stage on Wednesday, January 10th. A 50 basis point (bps) rate hike is widely anticipated, but the market will be looking for any hints about the future trajectory of rates. A more aggressive tightening path could strengthen the pound against the dollar.
Economic Data:
US Non-Farm Payrolls (NFP): Released on Friday, January 6th, a strong jobs number could strengthen the dollar and weigh on GBP/USD. Conversely, a weak reading could have the opposite effect. 400,000 new jobs are expected, which would be positive for the US economy.
UK GDP: The Gross Domestic Product (GDP) data for December on January 10th. Consistent economic growth could support the pound, while a slowdown could weaken it. The market expects a 0.3% month-over-month increase.
Weekly Forecast (Jan 8 to Jan 12) :
GBP/USD - H4 Chart - Channel Formation
Always wait for strong Conformation in Short term for entry. 👈👈👈
If you found my post helpful or informative, could you please leave a comment 💬🖌 and hitting that like button💚💚
“Markets are never wrong, but opinions often are.”-Jesse Livermore
Good Luck💛💛

XAUUSD H4 Triangle PatternEconomic Data:
US Non-Farm Payrolls (NFP): Released on Friday, January 6th, the NFP report showed stronger-than-expected job growth, potentially raising concerns about inflation and future interest rate hikes. This could push investors towards the safe-haven gold, providing it with some support.
US Consumer Price Index (CPI) (Jan 11, 2024): Inflation remains a key concern, and a higher-than-expected CPI could boost the dollar and put downward pressure on gold.
Geopolitical Events:
Tensions between Russia and Ukraine: The ongoing conflict in Eastern Europe continues to be a source of uncertainty for financial markets. Any escalation in tensions could lead to a flight to safety and boost gold prices.
Weekly Forecast (Jan 8 to Jan 12) :
XAU/USD - H4 Chart - Triangle Formation
Price must need to break Triangle and Retest, then only able to take Entry.
Always wait for strong Conformation in Short term for entry. 👈👈👈
If you found my post helpful or informative, could you please leave a comment 💬🖌 and hitting that like button💚💚
“Markets are never wrong, but opinions often are.”-Jesse Livermore
Good Luck💛💛

XAUUSDXAUUSD is trading in descending channel and printing consistent LLs LHs. Recently the price is broken the important support zone and now retesting the broken level, which is also the 50% Fib retracement level.
If the sell momentum continues the next target could be 2000
What you guys think of this idea?

EURJPYIs EURJPY exhausting at resistance zone?
As the price is been on high bull run but now it seems like price is lacking bullish momentum after printing double top pattern at resistance level and bearish divergence( on lower time frame) suggesting the sell pressure is about to start.
If the bears took control , the 1st target could be 157.
What you guys think of it?

NEARUSDTNEARUSDT was trading in descending parallel channel. The price was reacting well the support and resistance of descending channel.
Currently the price has given the breakout of channel and now retesting the broken level where it is also forming a local support zone and seems like the price may go for another leg higher.
If the breakout sustain to upside the optimum target could be 4.3.
What you guys think of this idea?

ONEUSDT ONEUSDT is trading in falling wedge pattern. The price was reacting well the support and resistance of wedge.
Currently the price is about to give breakout from falling wedge and after successful retest of the level will be bullish signal and seems like the price may go for another leg higher.
If the breakout sustain to upside the optimum target could be 0.01970 followed by 0.0214.
What you guys think of this idea?

MAVUSDTMAVUSDT is in strong bullish trend.
As the market is consistently printing new HHs and HLs.
currently the market is retracing a bit after last HH, which is very healthy retracement level and local support as well. if the market successfully sustain this bullish confluence the next leg high could go for new HH.
What you guys think of this idea?

CADJPYCADJPY is in strong bullish trend.
As the market is consistently printing new HHs and HLs.
currently the market is retracing a bit after last HH, which is very 50% fib retracement level and local support as well. if the market successfully sustain this bullish confluence the next leg high could go for new HH.
What you guys think of this idea?

EURCADEURCAD is trading in symmetrical triangle pattern. The price was reacting well the support and resistance of triangle.
Currently the price is trading at the apex of the triangle and is about to give the breakout of triangle and now retesting the broken level where it is also forming a local support zone and seems like the price may go for another leg higher.
If the breakout sustain to upside the optimum target could be 1.4720 followed 1.4770
What you guys think of this idea?

GBPJPYGBPJPY is trading in range bound with 500 pips range.
some time ranges are the best things to play just buy the support and sell the resistance.
as this one is 500 pips range which can deliver fine risk to reward.
currently the price is at resistance level and being rejected due to sell pressure.
will the pair head back to support area ?
what you guys think of this idea ?

DOTUSDTDOTUSDT is trading in descending channel and printing consistent LLs LHs. Recently the price is broken the important support zone and now retesting the broken level, which is also the 50% Fib retracement level.
If the sell momentum continues the next target could be 5.50
What you guys think of this idea?

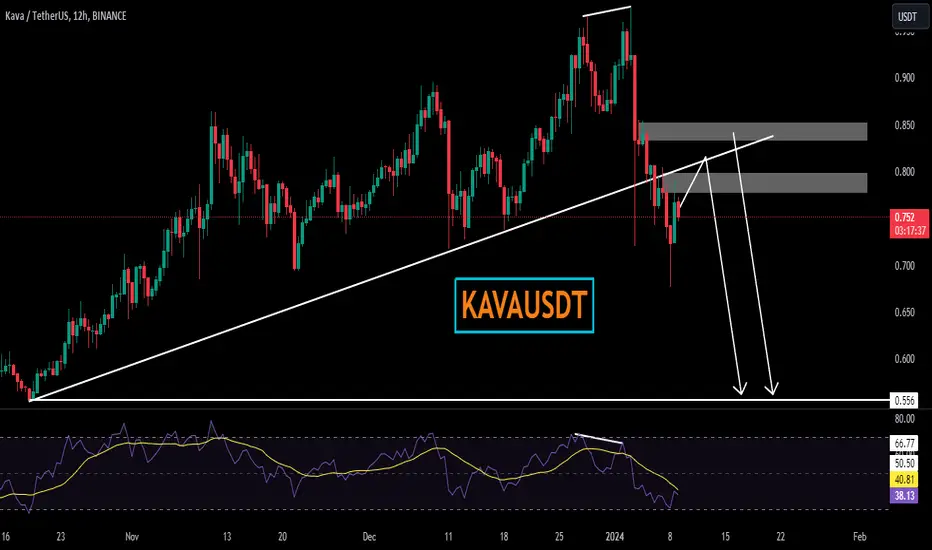
KAVAUSDTIs KAVAUSDT exhausting at highs?
As the price is been on high bull run but now it seems like price is lacking bullish momentum after printing double top pattern at resistance level and bearish divergence suggesting the sell pressure is about to start.
If the bears took control , the 1st target could be 0.55 .
What you guys think of it?
Sell EURJPY Wedge BreakoutEUR/JPY - M30 Chart - Rising Wedge Formation
Price Breaks the pattern now.
its Good chance to sell.
Lack of Major News: So far today, there hasn't been any major news impacting the EUR/JPY pair.
Thank You.

Buy USDCAD Triangle Breakout1. US Treasury yields climb, boost dollar: Rising US Treasury yields are providing some support for the dollar, putting mild upward pressure on the USD/CAD pair.
2. US employment data beats expectations: Positive US employment data released yesterday initially strengthened the US dollar, putting upward pressure on USD/CAD. However, concerns about rising US Treasury yields are now weighing on the dollar.
3. US/Canada employment data eyed: Both US and Canadian employment reports are due later today. Strong data from either side could significantly impact the pair's direction.
Its good time to buy now,
thank you

AUDUSDIs AUDUSD exhausting at highs?
As the price is been on high bull run but now it seems like price is lacking bullish momentum after printing double top pattern at resistance level and bearish divergence( on lower time frame) suggesting the sell pressure is about to start.
If the bears took control , the 1st target could be 0.6660.
What you guys think of it?

GBPUSDGBPUSD was trading in descending parallel channel. The price was reacting well the support and resistance of descending channel.
Currently the price has given the breakout of channel and now retesting the broken level where it is also forming a local support zone and seems like the price may go for another leg higher.
If the breakout sustain to upside the optimum target could be 1.2850.
What you guys think of this idea?

AUDJPYIs AUDJPY exhausting at highs?
As the price is been on high bull run but now it seems like price is lacking bullish momentum after printing double top pattern at resistance level and bearish divergence( on lower time frame) suggesting the sell pressure is about to start.
If the bears took control , the 1st target could be 95.5 What you guys think of it?

CADCHFCADCHF is trading under declining trendline and recently it seems like the sellers are bit exhausted then bulls took the charge and getting ready to break through declining trendline.
Currently the price has given the breakout from falling trendline and now forming a local support around 0.6450 region.
Will the bulls take charge again continue for leg higher?

NZDJPYNZDJPY was trading in symmetrical triangle pattern. The price was reacting well the support and resistance of triangle.
Currently the price has given the breakout of triangle and now retesting the broken level where it is also forming a local support zone and seems like the price may go for another leg higher.
If the breakout sustain to upside the optimum target could be 91.50
What you guys think of this idea?

EURJPYEURJPY is trading in descending channel and printing consistent LLs LHs. Recently the price is broken the important support zone and now retesting the broken level, which is also the 50% Fib retracement level.
If the sell momentum continues the next target could be 153
What you guys think of this idea?
