UNIUSDTUNIUSDT is in strong bullish trend and currently trading in bullish parallel channel. Currently the price is retracing to nearest level but seems like the instrument is getting ready for another bullish move.
what you guys think of it ?
Beyondtechnicalanalysis

NZDUSDNZDUSD seems to be in good bullish momentum. Currently the pair has completed the 4th retracement wave around FINB golden ratio. Will the pair continue bullish trajectory and complete 5th wave.?

AUDCADAUDCAD has formed double top with strong bearish divergence. Which is potential reversal pattern. Will these confluences put the pair in sell pressure.?

Understanding US Economic newsUS Economic Indicators:
We know about trends and trend changes, but why a trend changes?
The tops and bottoms of the market are determined by the fundamentals, like news releases, while the technicals show us how we get between those two points.
So a news release can be the cause or trigger of a trend change.
So it is to our advantage to at least be aware of upcoming news releases.
Here are some releases to watch for:
Non-Farm Payrolls
Non-Farm Payrolls have proven itself to be one of the most significant fundamental indicators in recent U.S. history. As a report of the number of new jobs created outside the farming industry each month, a positive or negative NFP can get traders to act very hastily. A better than expected figure is very bullish for the dollar, whereas a more sluggish number usually results in the dollar being sold off. There is another component of unemployment released on the same day: The Unemployment Rate. Unemployment measures the amount of people that are out of a job, but are actively seeking one. If this number is smaller, then it means that the people that are seeking jobs are finding them, possibly meaning that businesses are well off and that the economy is expanding. The NFP is a number, usually between 5-6 figures, whereas the Unemployment rate is a percentage. A higher NFP number and lower unemployment number are generally bullish for the dollar and vice versa. It is difficult to trade the NFP and Unemployment Rate only because many times traders will not pay attention to what seems to be the most significant components, but will instead focus in on what reinforces their bias. Also, the release causes a significant amount of volatility in the markets.
FOMC Rate Decision Interest
Rate decisions for the Fed Funds Rate are very important when trading the U.S. Dollar.
When the Fed raises interest rates, the yield offered by dollar denominated assets are higher, which generally attracts more traders and investors.
If interest rates are lowered, that means that the yield offered by dollar denominated assets is less, which will give investors less of an incentive to invest in dollars.
When the decision is made about the rate it is always accompanied by a statement where the Fed gives a brief summary of what they think of the economy as a whole. When reading the statement it is important to check the exact language.
Many times by the time that the decision is published, it is usually factored into the market. This means that only slight fluctuations are seen if the decision is as expected. The statement on the other hand is analyzed word for word for any signs of what the Fed may do at the next meeting. Remember the actual interest rate movement tends to be less important than the expectations for future interest rate moves.
Retail Sales
The Retail Sales figure is an important number in a series of key economic data that comes out during the month.
Because it measures how much businesses are selling and consumers are purchasing, a strong retail sales figure could signal dollar bullishness because it means strength in the US economy, whereas a less-than-expected number could lead to dollar bearishness.
Again, the logic behind this is that if consumers are spending more, and businesses are making more money, then the economy is picking up pace, and to keep inflation from creeping in during this time period, the Fed may have to raise rates, all of which would be positive for the US dollar.
Traders tend to use the Retail Sales figure more as a leading indicator for other releases such as Consumer Confidence and CPI, and thereby don’t usually “jump the gun,” unless the numbers are terribly out of proportion.
Foreign Purchases of US Treasuries (TIC Data)
The Treasury International Capital flow (TIC) reports on net foreign securities purchases measures the amount of US treasuries and dollar denominated assets that foreigners are holding.
A key feature of the TIC data is its measurement of the types of investors the dollar has; governments and private investors. Usually, a strong government holding of dollar denominated assets signals growing dollar optimism as it shows that governments are confident in the stability of the U.S. dollar. Looking at the different central banks, most important seems to be the purchases of Asian central banks such as that of Japan and China. Waning demand by these two giant US Treasury holders could be bearish for the US dollar.
As for absolute amount of foreign purchases, the market generally likes to see purchases be much stronger than the funding needs of that same month’s trade deficit. If it is not, it signals that there is not enough dollars coming in to match dollar going out of the country.
As a side note, purchases by Caribbean central banks are generally seen to be less consistent since most hedge funds are incorporated in the Caribbean.
Hedge funds generally have a much shorter holding period than other investors.
US Trade Balance
The Trade Balance figure is a measure of net exports minus net imports and tends to be negative for the U.S. as it is primarily a “consuming” nation. However, a growing imbalance in the Trade Balance suggests much about the current account and whether or not if the U.S. is “overspending” on foreign goods and services.
Traders will understand a decreasing Trade Balance number to implicate dollar bullishness, whereas a growing disparity between exports and imports will lead to dollar bearishness.
Because the figure precedes the Current Account release, it pretty much helps project the direction of change in the Current Account and also begins to factor in those expectations.
Current Account Balance
The U.S. Current Account is a figure representing the total accrued deficit of the U.S per quarter against foreign nations. Traders will interpret a greater deficit as bad news for the U.S. and will consequently sell the dollar, whereas a shrinking deficit will spark dollar bullishness.
Usually, the Current Account Deficit is expected to be funded by the net foreign securities, but when ends don’t meet in these data, the Current Account could signal a big dollar sell-off. Additionally, because the Current Account data comes out after the Trade Balance Numbers, a lot of its expectations begin to get priced into the market, so a surprise to either side of expectations could result in big market movements for the dollar.
Consumer Price Index (CPI)/Producer Price Index (PPI)
The Consumer Price Index is one of the leading economic gauges to measure the pace of inflation. Many investors and the Fed constantly monitor this figure to get an understanding about the future of interest rates. Interest rates are significant because not only do they have a direct impact on the amount of capital inflow into the country, but also say much about dollar-based carry trades.
If the inflation number comes in higher than expected, traders will interpret that to mean that an interest rate hike is more likely in the near future and will thus buy dollars, whereas a figure that falls short of expectations may cause traders to wait on the sideline until the Fed actually makes a decision. Essentially, trading a negative change in CPI is much more difficult than trading a positive change due to the nature of different interpretations. A significant increase in the CPI will result in much dollar bullishness, but a decrease will not necessarily result in dollar bearishness.
The CPI measures inflation at the retail level (consumers), while the PPI measures the inflation at the wholesale level (producers).
Gross Domestic Product (GDP)
The U.S. Gross Domestic Product is a gauge of the overall output (goods & services) of the U.S. economy. If the figure increases, the economy is improving, and often the dollar will strengthen. If the number falls short of expectations or meets the consensus, dollar bearishness may be triggered.
This sort of reaction is again tied to interest rates, as traders expect an accelerating economy to be mired by inflation and consequently interest rates will go up. However, much like the CPI, a negative change in GDP is more difficult to trade; just because the pace of growth has slowed does not mean it has deteriorated. On the other hand, a better than expected number will usually result in the dollar rising as it implicates that a quickly expanding economy will sooner or later require higher interest rates to keep inflation in check.
Overall though, the GDP has fallen in significance and its ability to move markets since most of the components of the report are known in advance
Durable Goods
The Durable Good figure measures the amount of capital spending the U.S. is doing, such as on equipment, transportation, etc., both on a business and personal level.
Essentially, the more the U.S. spends the more the dollar stands to benefit; the opposite is also true. This is because increased spending could very well be a harbinger for inflation, and thus consequently, interest rate hikes.
Traders will usually focus in on the durable goods figure, but not too deeply, as it usually precedes data regarding housing starts and the annualized GDP figure release. Therefore trading based on the Durable Goods number is only voluminous when stagnancy in other key economic releases has been confirmed by a market consensus.

NZDUSDNZDUSD is moving in an ascending channel. The market has reached the major resistance level at 0.64000. The market is overbought. It dropped from the resistance, and we'll see at least a pullback. The price is near the psychological level, and if it rejects the level, then we might see a massive drop from it

ALPHAUSDTALPHAUSDT was respecting the falling trendline but recently it break the trendline along with bullish divergence. Currently the instrument is making support zone but it seems like it is getting ready for some serious bullish momentum.

NZDCHFNZDCHF is testing a wide horizontal zone of demand.
The price formed a double bottom pattern on that
and currently retesting the broken neckline.
I think that the pair may bounce from the underlined area

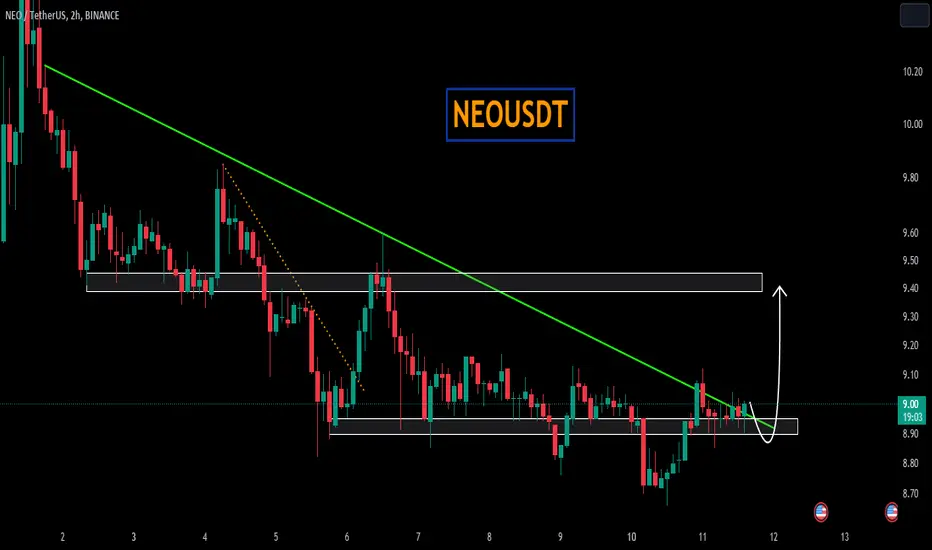
NEOUSDTNEOUSDT was trading in downtrend and the finally breakthrough falling trend line.
Currently the pair is forming a strong demand zone and seems like it is getting ready for bullish trajectory.
🧠 THE CYCLE OF MARKET EMOTIONS📍 When starting a trading career, much emphasis is placed on trading strategies, technical analysis, and indicators, which is important. However, as traders gain experience, they may discover that analysis and strategy become more intuitive as they find their specialization in the market. On the contrary, trading psychology often demands significant effort from most traders.
It is often overlooked that trading psychology is developed through practice. Some argue that simulated trading lacks realism and cannot adequately prepare traders for the emotional aspects of trading. However, this holds true only if traders have not yet learned to trust a tested strategy.
The market emotions run the gamut from fear, despair, hope, anxiety, and even euphoria. It is so common to experience these emotions that you can actually expect them to occur in a predictable cycle. We call it the market of emotional cycle.
📌 Think of it this way: we all start out with optimism – optimism that we are going to make lots of money in the market. Over time we may have trades go in our favor and make lots of money. However, if we aren’t in tune with the normal price cycle of the market, we can ride our profits all the way back down, leading us to despair.
The goal, of course, is to become a trader who learns to manage his emotions and make wise decisions. Instead of hope and fear and greed, become a process-oriented trader who can trust his judgment on the market. In the upcoming TV ideas, we will make a deep dive on each parts that effect the trader's psychology and why it does so.
👤 @QuantVue
📅 Daily Ideas about market update, psychology & indicators
❤️ If you appreciate our work, please like, comment and follow ❤️

USDCADUSDCAD was trading in bullish channel and has formed Head and Shoulder in channel and then break through channel and also break the HnS neckline.
All these things joined and predicting a bearish move for USDCAD.

LTCUSDTLTCUSDT is respecting well the inclining trendline and currently trading at 60% fib retracement level. Will the price bounce from this demand zone.

GBPUSDGBPUSD spiked during NFP because of softer USD data. The pair is trading at weekly supply zone and now being rejected from zone for deeper correction.

GBPNZDGBPNZD has break bullish channel and currently respecting the falling trendline. Price may test the falling trendline for one more time and then it may fall.

GBPJPYif you look at this pair at a glance, it looks like there is an opportunity to short, because the price has broken out of the trendline. it is better to wait a while, if the price can go down deeper than the blue line below, then the price will most likely go to the support area. this analysis is valid as long as the price does not rise back more than the invalid area

EURAUDWill EURAUD complete AB=CD pattern. As the pair is currently trading at strong support zone, will this support provide a bullish impulse to pair?

XAUUSD predicting until Sep 2027 with important days ! Hello traders this is the most important analysis that I uploaded and my predicting about the future direction of gold and important price pivots and predicting the dates of the main gold pivots as well as the return points of gold until 2027.This analysis is followed by my last analysis about gold in longtime period but today I added some important dates for changing the gold direct in future ! the red lines are important reversal point for gold and the blue line are the most important and major dates for changing the gold market direct. for more easily using I wrote the exact days dates here . you can judge it in future !
day/month/year !
19.06.2022 / 20.11.2022/ 01.05..2023(major) 18.10.2023(major) 13.04.2024/ 16.10.2024(major) 28.04.2025/ 16.11.2025
14.06.2026/ 18.01.2027 1.09.2027( major)
This analysis based on Harmonic Elliot and Harmonic patterns ( Three Drive pattern ) and time prediction analysis !

ARBUSDTARBUSDT has formed Head and Shoulder , a reversal pattern and also break the neckline as well. Will All these confluences put sell pressure on instrument?

INJUSDTINJUSDT is playing in harmonics and has completed the bearish bat. Will the bearish bat play its role and make price to downward direction?

NZDJPYNZDJPY is moving in an ascending channel. The market has reached the major resistance level. The market created a divergence at a major resistance zone. The price is near the 89.000 psychological level, and if it rejects the level, then we might see a massive drop from it

AUDJPYAUDJPY is been on enormous bullish trend. Recently the pair formed bullish flag pattern and now break the pattern, Will the pair respect the pattern and continue to much higher?

XAUUSDXAUUSD has formed reversal pattern, inverted Head and shoulder, and retesting the neckline of HnS. The commodity also respecting the inclining trendline which is also a bullish sign.
Will Gold continue its bullish trajectory?

Power of Psychology TradingIn the dynamic world of trading, it is widely acknowledged that strategy and market knowledge are essential for success. However, there is a critical aspect that often goes unnoticed but holds immense power in shaping trading outcomes: the psychological dimension. The psychological aspect of trading encompasses understanding and effectively managing emotions, biases, and mental states that can significantly impact trading decisions. Neglecting this facet can lead to costly mistakes driven by emotional decision-making, such as panic selling during market dips or clinging onto losing trades fueled by hope or fear. Thus, it is crucial to cultivate a clear and disciplined mindset to achieve more profitable and consistent trading outcomes. This tutorial aims to delve into the psychological landscape of trading, offering invaluable insights and practical tips to help you master your mind and, consequently, conquer the market.
Common Psychological Traps in Trading
Traders frequently fall into various psychological traps that can severely undermine their trading performance. One such trap is overconfidence. After experiencing a string of successful trades, it becomes easy to develop an invincible mindset, leading to riskier behaviors and impulsive decisions.
Fear and greed are two emotions that often dictate trading decisions. They serve as key drivers behind market trends but, if not managed properly, can result in significant financial losses. The fear of missing out (FOMO) can drive traders into hasty, poorly thought-out trades, while greed can create a reluctance to sell even when all signs point to a market downturn.
Another common psychological pitfall is anchoring. This occurs when traders become fixated on specific price points or values, distorting their perception of a security's true worth and hindering rational decision-making.
Understanding Your Trading Emotions
To effectively manage your trading emotions, it is essential to first understand them. One practical approach is to maintain a trading journal. In addition to recording your trades and their outcomes, this journal should document your emotions and thoughts at the time of each trade. Over time, patterns may emerge, revealing how your emotions influence your trading decisions.
Another crucial factor is knowing your risk tolerance. Each trader possesses a unique level of comfort when it comes to taking risks, and comprehending this can significantly shape your trading strategy. A risk-averse trader might prefer more stable assets, while a risk-tolerant trader may be comfortable with higher volatility.
Strategies for Managing Trading Emotions
Being in the right mental state before engaging in trading is paramount. Developing a pre-trade routine that helps you calm down and focus can prepare you for the trading day ahead. This routine could include activities such as meditation, exercise, or reviewing the latest market news and your trading plan for the day.
Having a clear trading plan also provides a solid foundation for managing your emotions. This plan should outline your strategy, encompassing risk management tactics, potential entry and exit points, and your objectives for each trade. It serves as a roadmap, grounding you when market volatility triggers emotional responses.
Additionally, learning stress management techniques can be invaluable in the trading arena, often laden with stress. Taking regular breaks, practicing deep breathing exercises, and maintaining a balanced lifestyle outside of trading can help maintain your mental equilibrium.
Conclusion and Further Reading
Trading psychology is a vast and intricate field, but understanding its fundamental principles can profoundly enhance your trading performance. By familiarizing yourself with common psychological traps, comprehending your own emotions and risk tolerance, and employing effective strategies to manage your trading emotions, you can make more informed and profitable trading decisions.
Continuous learning and emotional self-awareness are key to successful trading. There are numerous resources available for those who wish to delve deeper into trading psychology, risk management, and market analysis. While the journey to master your trading psychology may present challenges, the potential rewards - improved trading outcomes and personal growth - far outweigh the effort invested.

⚖️ How Much You Need To Recover LossesWhen an investment's value fluctuates, the amount of money required to bring it back to its initial value is equal to the amount of change, but with the opposite sign. When expressed as a percentage, the gain and loss percentages will be different. This is because the same dollar amount is being calculated as a percentage of two different initial amounts.
📌The formula is expressed as a change from the initial value to the final value.
Percentage change = ( Final value − Initial value ) / Initial value ∗ 100
Examples:
🔹 With a loss of 10%, one needs a gain of about 11% to recover. (A market correction)
🔹 With a loss of 20%, one needs a gain of 25% to recover. (A bear market)
🔹 With a loss of 30%, one needs a gain of about 43% to recover.
🔹 With a loss of 40%, one needs a gain of about 67% to recover.
🔹 With a loss of 50%, one needs a gain of 100% to recover.
(If you lose half your money you need to double what you have left to get back to even.)
🔹 With a loss of 100%, you are starting over from zero. And remember, anything multiplied by zero is still zero.
As the plot graph showcased on the idea, after a percentage loss, the plot shows that you always need a larger percentage increase to come back to the same value
To understand this, we can look at the following example:
$1,000 = starting value
$ 900 = $1,000 - (10% of $1,000), a drop of 10%
$ 990 = $ 900 + (10% of $900), followed by a gain of 10%
The ending value of $990 is less than the starting value of $1,000.
🧠 Psychological Aspect:
Investors should be able to mentally admit that they have incurred a loss, which is expected in trading. The investor should give some time to heal the process and only keep a close watch on the market situation. Huge losses incurred might disrupt the decision-making skill and stop trading for a few days until the confidence is regained. There should be the right focus to approach the right opportunities, and there should not be any regrets of any loss during trading.
👤 @QuantVue
📅 Daily Ideas about market update, psychology & indicators
❤️ If you appreciate our work, please like, comment and follow ❤️
