Bhpbilliton
BHG showing downside to come but with a LOW probability - SMCInv Cup and Handle (Bearish) formed which the price broke below.
Price>200 - Bullish This is conflicting which shows sideways movement.
Target R451.27
Low prob trade due to SMC Read below
SMC
The price is at the moment in an Order Block (Sell Side Liquidity) Look at previous levels of supports (it's all around here at R514.70.)
This is where Orders get the long (buyers) out of the market which sells their positions and the Big Guys buy which pushes the price up.
With price above 200SMA and with the Order Block - It's for this reason the long trade is a LOW probability one. WHich I'm probably going to leave alone as there can be chop in the next few days.
3 Short signals for BHP Billiton Group OUCHThis is NOT The year for Resources I must say. BHG is showing 3 patterns of downside to come. 1. Inverse Cup and Handle large. 2. Medium Inverse Cup and Handle and 3. Descending Triangle... If it breaches below the neckline (brim level), we can see an easy target to R325.00
BHP Group to explore new territory of $53 per share?This week is one of the busiest for the Australian Securities Exchange, with many of its biggest names delivering their respective earning reports. Among those reporting is the country’s largest mining company, BHP Group (ASX: BHP). BHP are expected to deliver their FY2022 results on 16 August 2022.
In addition to BHP’s results, the miner announced an AU $8.4 billion to acquire OZ Minerals (ASX: OZL) last week. As OZ Minerals have already rejected the take-over offer, additional rounds of bids will likely follow over the next week or two.
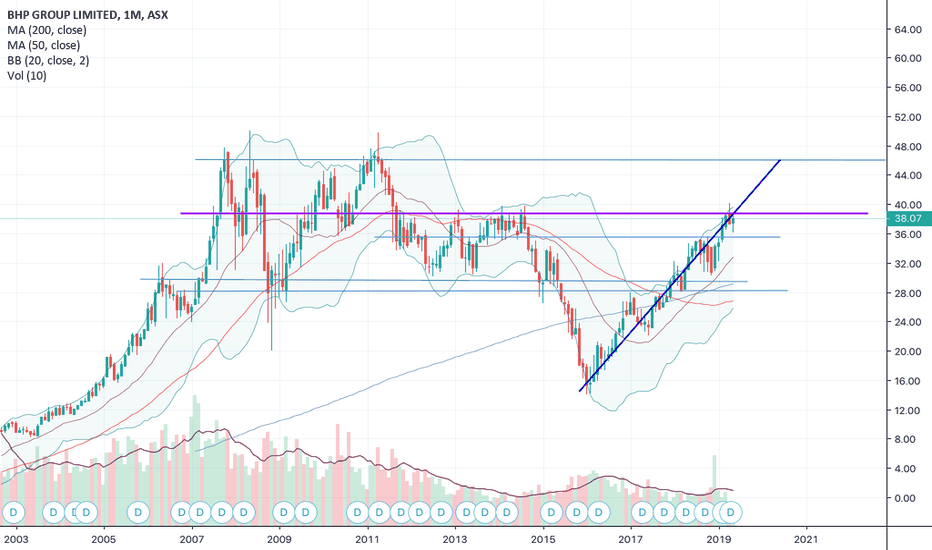
The monthly chart indicates that BHP is currently in a bullish trend and has tested a key resistance just above $48 a share twice in the past month and a half.
BHP is currently trading inside a parallel channel, and it looks like it might be about to bounce from the support, in confluence with the 50-DMA.
Fibonacci extension levels indicate that the price might reach an all-time high of $53, if bullish fundamentals continue.
From the perspective of the daily time frame, BHP looks a little more vulnerable with the suppression of Iron Ore prices, one of its primary exports. It was only last month that the mineral rebounded from a multi-month low, from $101 USD/T to $110 USD/T but is still contending with the dark clouds hanging over the Chinese construction sector. However, Iron Ore is mor eon the side of oversold rather than overbought according to the RSI indicator.
BHP - Awaiting for buy opportunitiesG'day Traders and Investors,
Note: Before reading this, I would like to declare that this is not a financial advice, I am not financial advisor. Any mentioned information is for education and entertainment purposes only and based on my trading and investing strategy. . I may or may not act according to this analysis.
Facts:
- As of 2022, BHP is the largest mining company in Australia, by market capitalisation and It is one of the very profitable business as
most of BHP products are essential for global economic growth.
- The company primary operational units are: Coal, Copper, Iron ore and Petroleum. But many are key to the energy transition, to
lower carbon world, for example:
Copper - has electricity conducting, corrosion resistance and antimicrobial properties and is used in everyday household products.
Iron ore - is one of the most sought after commodities in the world and is integral to the steel-making process.
Nickel - is a key ingredient is stainless steel and major component in the lithium-ion batteries that are helping power the electric
vehicle revolution.
Potash - is a group of potassium compounds that will be vital link in the global food supply chain.
- BHP also committed to Sustainability and Social responsibility. Read more on www.bhp.com
Source: www.bhp.com
If you like the idea, please like and comment. Many thanks for your support.
Cheers!
Jimmy
Is it time to consider RIO or BHP?
Fundamentally sound - both BHP and RIO
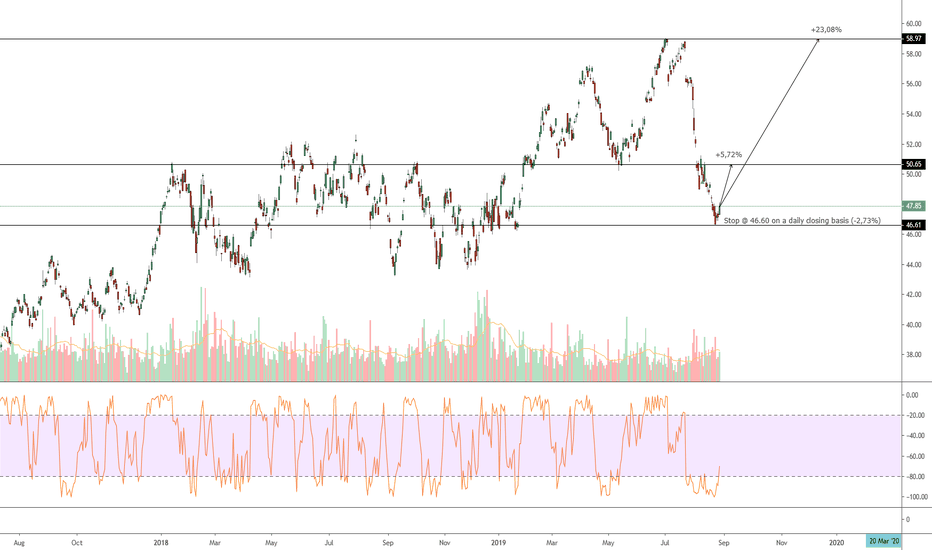
Iron ore prices testing key trend line support on longer-term charts Weekly
BHP is testing 0.618 and RIO 0.5 FIBs
Gold miners NST and NCM testing support but need more confirmation as they are sensitive to USD fluctuations.
Possible trading options:
Leaps
Put sell
BHP daily close at H&S neckline, bullish vibes zero JSE:BHP close today resting right at the neckline of a textbook H&S. I wish it were not so, as I'm positioned for a bounce, but alas resources are not giving off good vibes at the moment, not good at all :-(
BHP - Full Breakdown Using The Main Indicies PatternIn this special idea I apply the AriasWave methodology to a stock by incorporating the main pattern in Global Markets.
See related idea below for the DOW JONES to understand this pattern. I will post an idea shortly for the FTSE 100.
Using the AriasWave framework and the main pattern which a TYPE-2 ZIG ZAG I apply careful and precise wave analysis to this stock.
This will help you with targets and what the rest of the pattern will look like.
Please LIKE and FOLLOW to get notification of updates and future posts.
BHP - Head & ShouldersJSE:BHP has formed a Head and Shoulders pattern and has broken through the neckline on its way downwards. If the pattern plays out, we could see a move down to the target at around the 28900 level
BHP GROUP (BHP) BUYIf prices break above the previous 34 156 resistance, this should be a good opportunity to buy into this market. The price is above the 100-day exponential moving average on the weekly chart and also seems to be bouncing off the 400-day EMA on the daily chart, as this seems to present a support zone. Our good old trendline shows the price making a series of higher highs and higher lows, however, the slope of the trendline is not that steep, meaning this stock will be a slow mover, if it moves to the upside at all.
Buy: When the price breaks above the 34 156 level. '
This trade will be invalidate if prices break well below the trendline or the 400-day exponential moving average on the daily chart. Proper risk management should be exercised.


