Bhpbilliton
BHP Billiton's bullish run is taking a breatherBHP Billiton has had a solid bullish run since the start of 2016. After falling to a low of R136.30, the share price has steadily risen, reaching a recent high of R326.73. But the mood on the stock might just have changed...
If you look at the short-term trend-line, you can clearly see it's been broken. Where it found support before, it has now found resistance.
In addition, you can also see a clear divergence on the MACD. As BHP Billiton was reaching new highs, the MACD was continuously moving lower. The MACD is also now firmly in bearish territory, indicating BHP Billiton is in a bearish trend.
The Slow Stochastic also recently indicated the stock was overbought. And although it is no longer in overbought territory, I do think the share price will continue to weaken.
With all of this in mind, I am going to short BHP Billiton .
Action: Place a Limit order to SELL at R297 with a Stop Loss set at R312. I will aim to take profit at R280 and R270 respectively.
Margin: 14%
Gearing: 7.14x
Gain: +64.94%
Risk: -36.08%
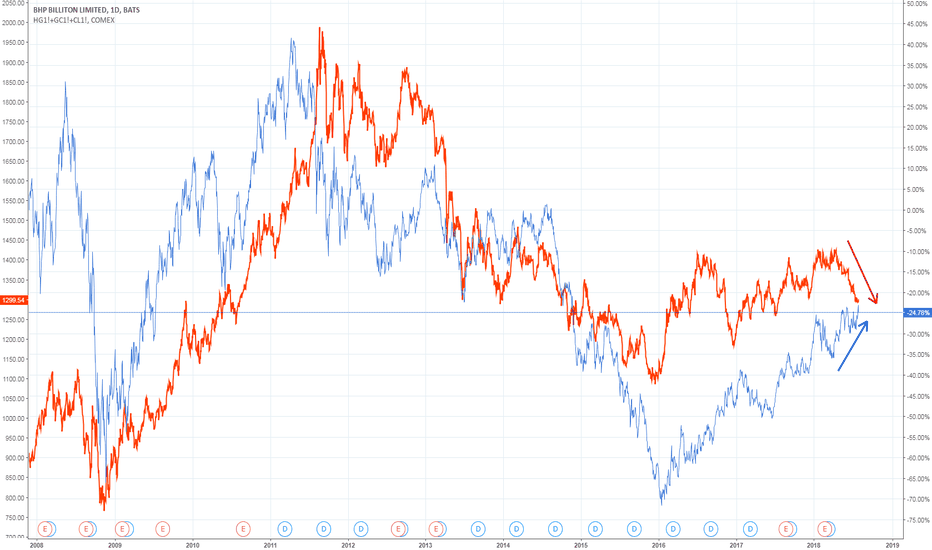
BHP BILLITON | Heading Towards 16.00 ???BHP for the last two years has been quite the bullish pick of the ASX , after it's bear run from late 2014 it was an obvious investment for the long haul trader.
-
Now into late 2018 , we can see that price is currently retesting structure at the range of DEC 201 3 and JUL 2014 . Currently ranging in the structure zone as displayed, accompanied by an RSI divergence, we have a strong reason to believe that price has completed its pullback and is headed on back down to the low of JAN 2016 .
-
A break and close over the trend-line would place us in an ideal position to short the stock.
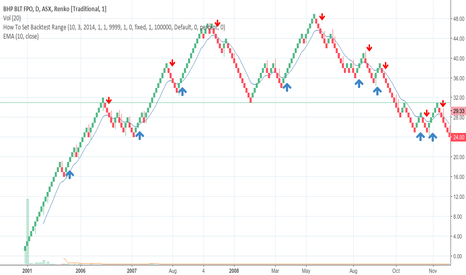
Renko Manual Back Test with BHPTesting basic Renko system.
Enter Long when:
- 2 green bricks (top of 2nd brick + 5% brick size)
- Top of 2nd brick is above 10EMA
Stop:
- bottom of 1st full brick under 10EMA -5% brick size
Exit:
- 2 red bricks (bottom of 2nd brick - 5% brick size)
- close under 10EMA
Enter Stop Exit R Profit R Mulitple
19.05 15.95 28.95 3.1 9.9 3.1935483871
27.05 24.95 35.95 2.1 8.9 4.2380952381
36.05 33.95 43.95 2.1 7.9 3.7619047619
37.05 33.95 45.95 3.1 8.9 2.8709677419
39.05 36.95 37.95 2.1 -1.1 -0.5238095238
38.05 35.95 35.95 2.1 -2.1 -1
28.05 25.95 25.95 2.1 -2.1 -1
28.05 25.95 27.95 2.1 -0.1 -0.0476190476
So far so good.
BHP Billiton – LT falling trend line breachedDaily chart pattern – Two year long falling trend line has been breached
RSI eyeing bullish break
Money flow index suggesting further gains
Prices thus appear on track to test next major hurdle seen directly at 1156.27 levels (38.2% Fibo of 2014 high – 2016 low).
Bullish invalidation is see only if prices see a day end close below 1030.50.
Missed the breakout waiting for pullback I am short this one at 1032 let us see a move towards the flag as looking aewsome i am not seeing any kind of bull volume so staying in short is a good idea
Let me know if u have similar or other views about it.
Trade Safe
LON:BHP Sell Setup Hi Everyone, there is a sell setup playing out here for BHP on the London Stock Exchange.
We are waiting for the break of the lower trend line and then will watch it on a lower time frame for a retest and rejection.
There is also a potential for it to bounce up to the top trend line where there would be another opportunity to sell although that would be higher risk.
BHP Billiton - Buyers could come-in around 880Weekly chart shows
Falling trend line breached
Trades above 23.6% Fibo of July 2014 high-Jan 2016 low) = 932.85
Confluence of trend line support (rising+larger falling) seen around 880. Correction could run into fresh demand around 880 levels.
Another scenario - Rebound from 23.6% followed by a break above 1039 (last week's high) would open doors for a test of 38.2% Fibo.


