BIDU

THE WEEK AHEAD: TEVA, BIDU, RIG, XOPBIDU (44/42), RIG (33/56), and TEVA (49/53) announce earnings this week, with TEVA looking for a March to April volatility contraction of about 15%, BIDU, approximately 7.7%, and RIG, 6.9%. Instead of looking to play these pre-announcement for a volatility contraction (the contraction percentages aren't that compelling), I'll look to potentially short put/acquire/cover instead,* particularly since all of these underlyings have been hammered of late and are at the low end of their 52-week ranges.
Pictured here is a Plain Jane, TEVA 20-ish delta 16 short put in the April expiry; it's paying .51 with a break even of 15.49. The more aggressive 30 would be at the 17 strike and is currently paying .79 with a 16.21 break even. On margin, the 16 short ties up about 320 to put on, the 17, 340, with respective returns on capital of 16% and 23% at max. The break evens represent a 15% discount over current price for the 16 short put; an 11% discount for the 17.
The BIDU April 18th 155 (25 delta) is paying a 4.55 credit with a break even of 150.45, a potential 14.7% return on capital at max and a 11.4% discount over current price if assigned. As with TEVA, there is little point in holding shares if you don't have to, since it does not pay a divvy. If you end up in-the-money, roll as is and proceed to sell calls against to reduce cost basis.
If you're not into tying up 31.00 in buying power on Baidu, there is RIG. Unfortunately, due to its size, you're going to have to go closer to the money to make it worthwhile in dollar and cents terms: the April 15th 8 short put (40 delta) is paying .57 with a break even of 7.43 -- a 35.6% potential return on capital at max and a 10.3% discount over current price if assigned.
On the exchange-traded fund front, not much is hopping from a premium selling standpoint with VIX dropping into the 15's from its 2018 year-end highs of 36+, so I'll be looking to hand sit and keep powder dry for a higher volatility environment to get into nondirectional setups in broad market instruments. That being said, I will continue to sell premium in XOP, where the 30-day implied is over twice that of the broader market (34.1% versus SPY 15%).
* -- The natural alternative should you not be interested in acquiring shares would be to roll the short put out in time "as is" if it hasn't worked out and then proceed to cover with a short call. The last two dividends were a paltry .07, so I could see not wanting to tie up buying power to be in the shares unless you absolutely have to.


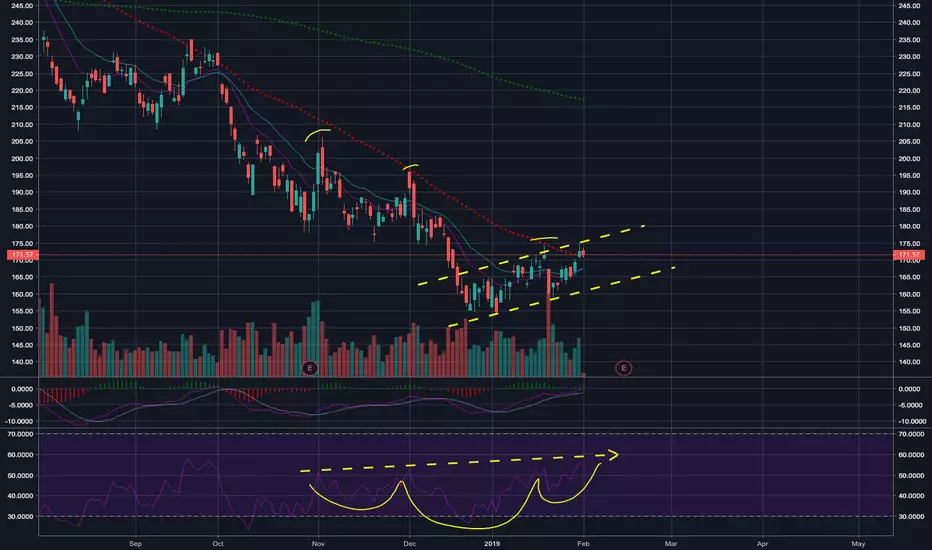
BIDU trend change $BIDU
Above Daily 50 MA
Uptrend channel
Bullish RSI divergence
RSI Inverse head and shoulders
IQ long idea this week on the Falling Wedge breakout Trade talks are scheduled this week and China small caps have been getting heavy volume. IQ has also had bullish flow the past week. $28 PT

BIDU Análisis Baidú se encuentra construyendo una zona de demanda bastante importante. Muy buena opción en LONG para los próximos meses.


The Bounce from Oversold Survives An Early TestAbove the 40 (November 2, 2018) – The Bounce from Oversold Survives An Early Test
November 4, 2018 by Dr. Duru
AT40 = 22.0% of stocks are trading above their respective 40-day moving averages (DMAs) – ends an 11-day oversold period that followed a 4-day oversold period
AT200 = 31.6% of stocks are trading above their respective 200DMAs
VIX = 19.5
Short-term Trading Call: bullish
Commentary
If you are a long-term passive index investor, you can return to your regularly scheduled programming. Just make sure to check back in if the S&P 500 (SPY) manages to break down below the low of this latest selling cycle (around 2600). For those interested in short-term trades, the drama continues apace.
Friday was a day of spills and thrills as the headlines from another strong jobs report faded fast in the wake of the Trump administration broadcast conflicting messages about the prospects for an imminent trade deal with China.
I was not aware of the headlines until after the close of trading; I am thankful I was not paying attention to that source of confusion and distraction. I was focused on executing my trading strategy for a market that I assume is moving away from oversold conditions and facing down its next challenges at 200-day moving averages (DMAs).
AT40 (T2108), the percentage of stocks trading above their respective 40DMAs, closed at 22.0%, a slight gain over the previous day. AT200 (T2107), the percentage of stocks trading above their respective 200DMAs, closed at 31.6%, essentially flat with the previous day. The S&P 500 (SPY) gapped up but sold off all the way below the intraday lows of the previous two trading days before bouncing back. Although the index netted a 0.6% loss, I call the day overall a small victory.
{The S&P 500 (SPY) almost challenged its now declining 200DMA resistance. The 0.6% loss was not enough to drop the stock market back into oversold territory.}
The NASDAQ and the Invesco QQQ Trust (QQQ) behaved like the S&P 500. Most importantly, QQQ directly challenged its 200DMA resistance and got rejected. This is the second day in a row with QQQ tussling with this critical trendline.
{The NASDAQ lost 1.0% as its downtrending 20DMA held as resistance.}
{The Invesco QQQ Trust (QQQ) lost 1.6% and also lost its battle with 200DMA resistance.}
The volatility index, the VIX, delivered another small victory. The VIX made a fractional gain after gapping down and then soaring past the previous day’s intraday high. It closed at 19.5 and remained below the 20 “elevated” level. As I wrote earlier, I expect volatility to implode after the election with no expectation for the outcomes. My put options on ProShares Ultra VIX Short-Term Futures (UVXY) teased me by going into the green soon after the open only to close the day back into red territory.
{The volatility index, the VIX, gained 0.9% but stayed below the 20 level which is the threshold to "elevated" levels.}
The intraday volatility on the day allowed me to flip call options on SPY. My core index play remains Shares Russell 2000 ETF (IWM) call options and now for a longer stretch shares of ProShares Ultra S&P500 (SSO). IWM out-performed the market with a 0.3% gain. Several hedges expired harmless last week. Looking back, I wish I was a little more aggressive in closing out some of them. Next week’s hedges are mainly the long side of calendar put spreads whose short sides expired harmless this week. I am not interested in adding fresh hedges and will remain aggressive on the long side (mainly for swing trades). I am particularly interested in accumulating shares and calls on companies that survived their earnings with gains with a preference for stocks trading above their 200DMAs. Swingtradebot is a great tool for scanning for such stocks. I will also do my best to post some ideas here.

LONG TKAT @ $.6954 for Chinese Internet (KWEB) UpsideTechnical Analysis:
1. KWEB (Chinese Internet ETF): Expect a relief bounce here for Chinese Internet stocks ( BABA BIDU JD ) with a Hong Kong ( HKDOW ) & Shanghai ( DJSH ) market rally.
a. Holding 200weekSMA and 50monthSMA support here at $44 with record volume twitter.com
b. Very oversold on weekly timeframe
c. Strong price support at $41.00
d. 4/24/18 gap filled at $43.53
e. Possible reversion to mean: 2018 Chinese Internet % Total Returns (negative) very divergent from US Internet % Total Returns (positive)
2. TKAT (Takung Art Co) showing strong correlation with KWEB with more volatility, conveying a higher beta to Chinese markets. This will result in exceeding KWEB’s % gains on upside price movement.
a. Potential price double bottom $.63-$.68
b. Extremely oversold on weekly/monthly timeframes
c. Daily RSI uptrend from 29 (8/9/18) to 34 (10/11/18)
d. Large accumulation volume on 10/2 and 10/12
e. Testing 10dayEMA @ $.75
Fundamental Analysis: TKAT - Takung Art Company:
1. Takung Art Company fundamentals convey undervaluation and thus provides great risk/reward for China Internet/Software market rally
a. Price to Book = .49
b. Price to Sales = .61
c. Net Current Asset Value = 1.24
d. Cash to Debt = 1.43 – Strong cash position to outlast market downturn
e. Poor 2018Q2 and 2018Q3 earnings coupled with an overall bearish Chinese investor sentiment already priced into stock price
f. Company is expected to resume Listing Revenue (primary revenue stream) end of October – temporarily loss of revenue could be short-lived
g. Company plans to reduce G&A expenses by 10% in 2018Q3

BABA Swing Long StalkingDirectional Bias: Long
Price Target: 175
Good Entry: 138-144
Risk/Reward: $5 max risk - $20 reward
If we see an opportunity at 138-144 area,we should take it with a risk of $5 a share. A nice short squeeze can get price back to 175 in quick order.

JD.com trading at a blatant valuation discount- LONGOne of the trends taking place in my portfolio is an increased weighting in China's technology sector.
Amid the trade-driven pessimism over China, clamp down on digital assets and increased control over online content China's economy is trading at a blatant valuation discount to the U.S.
Within the last few months the BAT stocks Baidu BIDU, Alibaba BABA and Tencent TCEHY have been among the biggest losers.
The recent arrest of JD CEO Richard Liu has caused JD stocks to tumble further relative to its e-commerce peers and is now almost 50% off its 52-week high. I view this as a risk-reward profile that is heavily tilted in favor of the bull.
All indicators explained on the graph.

BIDULook like Chinese names are improving since the news that talks will continue between US and China. I'd be looking for the test of the 38.2% resistance on the fib retracement before it pulls back again, longer term the chart is looking dangerous. It seems to have broke its uptrend from last earnings with a gap down back at the beginning of August. will be watching support around 210 if that breaks will see further weakness.

BIDUTrade war and entry of Google (with restriction abiding communist party) if it happens will change the balance of BIDU dominance in China

A Still Shaky But Now Stretched Stock MarketTechnical indicators keep flagging the stock market's underlying weaknesses. Still, the latest shallow selling is a bit over-stretched.
"A Still Shaky But Now Stretched Stock Market" drduru.com $SPY $QQQ #VIX #AT40 #T2108 $BA $BIDU $CAT $GLD $SLV $DXY $USDTRY #forex $M $NFLX $RIO $BHP $USO $WHR

China bearish: Buy the trade war tech dip BIDU NTES IQ TCEHY On Friday the 3rd August 2018 Chinese stocks ceded their ranking as the second-largest equity market in the world amid an elevation in trade tensions after the Trump administration said it was considering increasing the initial proposed tariff.
Buying the dip: Considering Chinese markets are at almost a one year low and under a temporary trade war, a knee jerk reaction will eventually take place causing an influx of capital across the market. I cant predict when this would happen or whether stocks have reached their bottom but I consider this another buy opportunity.

THE WEEK AHEAD: TSLA, AAPL, BIDU, X EARNINGSAn interesting earnings announcement docket ahead this week:
BIDU (rank 57/implied 39) announces Tuesday after market close; AAPL (rank 54/implied 26), Tuesday after market; TSLA (rank 87/implied 70), Wednesday after market; and X (rank 61/implied 53), Wednesday after market.
Out of these, TSLA has the kind of volatility metrics I'm looking for in an earnings related volatility contraction play, but due to size of the underlying, it'll have to be defined risk, if anything. Because it can be a mover and its weekly expiry liquidity isn't great, my tendency would be to go out to the monthly since it's not all that far away in time and is likely to yield a fairer price fill. Preliminarily, the Aug 17th, 20 delta 250/260/337.5/347.5 is paying 3.07 at the mid, but I'd only want to play if I could get at least 1/3rd the width of the 10-wide or 3.33.
For similar reasons, I'd use the August monthly with BIDU (weekly expiry liquidity): the Aug 17th 20-delta 225/235/277.5/287.5 is paying 3.03; go in a little tighter to the 23 delta, and you get paid 2.89 for the 7 1/2 wide 230/237.5/275/282.5. I'm frankly loathe to tighten these puppies up because as we've had a couple greater than one standard deviation movers this season (FB, TWTR), and no one (generally) likes to get whipped.
In all likelihood, however, if I play anything, it'll be X, since I feel comfortable going naked on that underlying due to size and just generally prefer managing a broken naked over a broken defined: the Aug 17th 37 short straddle is paying 3.83 at the mid with a 25% take profit target of .96 and the Aug 17th 33.5/41.5 paying 1.17 with a 50% take profit of .59; that >1.00 for a twenty-ish delta short strangle is decent for a $37 underlying.
AAPL just doesn't have the juice, with below 30% background implied ... .
On the exchange traded front, it's more of the same ... . Volatility can be found in EWZ and XOP, but even then, it isn't as great as it was a few weeks ago: EWZ is 30.6%; XOP at 26.2%. Nevertheless, I'm maintaining positions in those as core premium selling positions for the time being, since XOP has had comparatively decent premium in it over time, and EWZ is going on a several week binge of greater than 30% implied.
Major Food Group Trades: TLT has come off of 122.50 I've temporarily marked as the place to short from, so I'm waiting for a revisitation before re-upping. Gold has been absolutely hammered, but I'm unable to get into anything satisfactory in GLD; the upward call diagonal metrics always require me to pay more than 75% of the spread width, which makes a play unappealing. I'll look again this week, but have been repeatedly rebuffed. And, in spite of the little sell-off we had on Friday, broad market doesn't look all that sexy: SPY implied is at 12.2%, QQQ at 19%, IWM at 16.5% and EFA at 4.7% -- all well in the lower half of their 52-week ranges.


China's Double TopI posted about this a while back, so wanted to reiterate given the developments abroad.
The HSI appears to have formed a double top (with a potential bull trap, too) and I suspect selling pressure may escalate.
A decisive break in price above the top would need a few weeks of closing above to invalidate the pattern. Given the negative catalysts surrounding China regarding trade, I don't see how bulls reverse this train.

Alibaba drowning in bullish patternsBABA broke out yesterday of a big bullish pennant. Ater the breakout it formed another pennant on a small time frame. I entered some calls after the bullish breakout (didn't have time to update). Sold 4/5 of my calls on the way up and holding the rest for a breakout of the forming bullflag. Only trade after a breakout or, if you want to play it aggressively, on support.
Keep the NDX in mind. It's still trading in an upward channel but after a bearish breakout it can lower the whole market, including BABA.
The general conclusion remains bullish with caution.

BIDU Looking for 296 handle. Setup:
It was noted that BIDU stock heading to 296 handle.
Our setup is complemented by the following:
1. Multiple timeframe trend analysis
2. Divergence on H1.
3. Gap analysis
Approach:
Our trade strategy is as follow: We will open two consecutive trades, they will both have the same stop loss but different take profits.
Trade 1:
Entry: 243.89
SL: 225.51
TP: 267.41
Trade 1:
Entry: 243.89
SL: 225.51
TP: 296.84
It should be noted that once TP1 is hit, we will move the stop loss of trade 2 to breakeven.
Risk & Reward:
Total Risk:
2%
Total Reward:
4.2 %
Good Luck :-)

BIDU Daily - Long IdeaLonger term approach. Looks ready for next leg up. Very likely above 305 by end of this year.


$BIDU Overbought at ATH$BIDU nearing upper limits of long term bullish channel. Finding resistance around $275 prev ATH level. Not expecting much more upside in medium term.
