EURUSD TRADE 18.06.2018WEEKLY CHART EVALUATION
1. Price below Alligator
2. Previous Bar - Bearish
3. AO Red Below Zero, Momentum Downtrend
DAILY CHART EVALUATION
1. Price below Alligator
2. Previous Bar - Bullish Divergent Bar
3. AO Red Below Zero, Momentum Downtrend
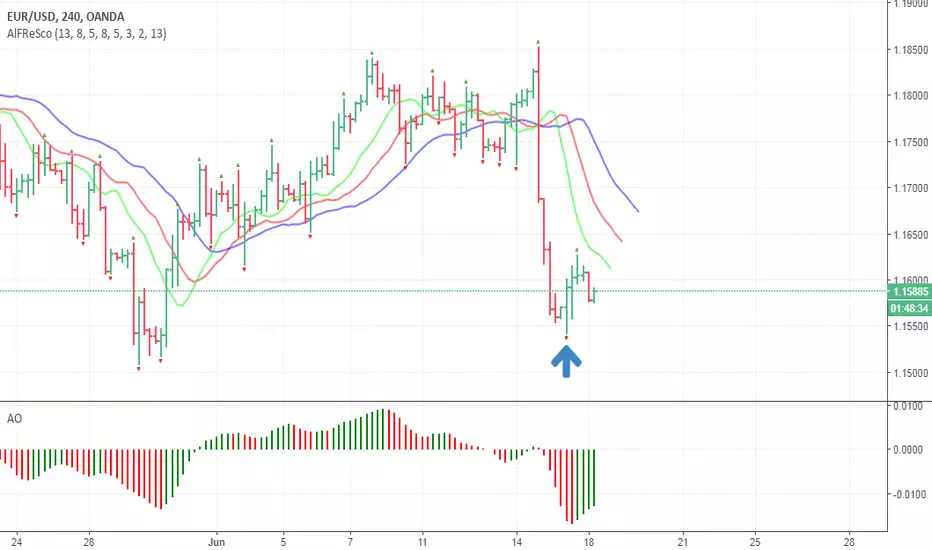
TRADING SETUP @ 4H TIME FRAME
1. Bullish Divergent Bar - Valid
2. AO Red, Below Zero - Valid
3. Angulation Between PRICE and ALLIGATOR - Valid
5. Divergence between PRICE and AO - Yes
6. Risk / SL = 58pip
Bill Williams Indicators
BTCUSD 4 hour chart DAILY UPDATE (day 114)Over the last seven days I have been calling for a reversion to the mean after overselling on the 9th and 10th. For me that means a retest of the 12 period EMA on the daily chart. That is where I expect to see strong resistance from the bears lead to an eventual breakdown of $6,000 support.
I have been holding onto my short since 6/4 and am still feeling very confident about my target of $4,975.
We are currently trading at a resistance cluster on daily chart: horizontal (white), trend (red), 12 day EMA (teal).
Over the past week I have been listing a number of trade setups. The one I like the most is opening a short for 50% of your desired position at the current level of resistance. If the price does rally through then you can add on the rest of your position at $6,950 - $7,150. If it doesn't then you can add the rest after getting a new swing low (below $6,300)
I do not expect the rally to be able to sustain through that price. My stop loss is still set slightly above that area. That is due to the Bill Williams Fractal on the daily chart.
The four hour chart just closed a shooting star at the resistance cluster mentioned above. That is a good indication of this rally coming to an end.
Thank you for your time! Have a question? Leave a comment! Smash the follow so that you don't miss out on future updates and remember that clicking the like is good karma!

AUDNZD ShortAUDNZD has crossed under its 89 EMA and retested it. A Fractal resistance has formed below the Williams Alligator as well as a trend line. The first price target is aiming for a recent level of support while the second is aiming for a major 2-week support.
SL: 1.07595
TP1: 1.07060
TP2: 1.06700

EOS end of correcion target zoneEOS last wave down (5)..
I have not written anything for a long time because these charts are ugly! ;)

BTC:USD 4 hour chart DAILY UPDATE (day 110)Two days ago I made a nice call that had me feeling very prepared for the price pump we got yesterday :
“I firmly believe that a short term bottom lies somewhere in the range of $5,964 - $6,123. From there I expect to see a 1-7 day rally that retests the short term daily EMA’s (12 & 26). If not currently in a trade then I strongly advise against opening a bearish position right now. Wait for the bounce, and/or multiple days of consolidation.”
I was tweeting like a mad man all day saying to sell BTC:USD, ETH:USD, ETH:BTC, and LTC:BTC. In the daily update I outlined those positions ahead of time so that there would be plenty of time for anyone who wanted to position themselves accordingly (refer to to day 107 ).
From here it is still possible to see the pump continue for another 1-5 days. The price is currently being squeezed in between the 12 & 26 period EMA’s and they could make a bullish crossover in the next day or so.
That would create a third higher low and would likely send the price right back to $7,000. If we get a close below the 26 period EMA, or the price falls below $6,350, then I would fully expect this pump to be over.
Entries
If you are not in a position then there are a few options still on the table.
1) Scale into a short or out of spot at upcoming levels of resistance - $6,950 | $7,150
2) Short or sell spot as soon as the price falls below $6,300
3) Short alts vs BTC - LTC is forming a bear flag after breaking down a major level of support
Stop Loss
My philosophy about trading is a simple one. I believe I first learned the sentiment from Peter Brandt on Twitter.
‘Diligently manage stop losses and let the profits take care of themselves.’
I am using Bill Williams Fractals on the daily chart in order to actively manage my stop losses:
BTC:USD - $7,776
ETH:USD - $618
ETH:BTC - 0.0815
LTC:BTC - 0.01601
The stop losses will be moved up once a new up fractal prints on my chart.
It doesn’t appear that the ruling from the SEC will have an impact on the technicals. ETH:USD and ETH:BTC got a nice green candle immediately following the news, but turned around right where the trend suggested.
Thank you for your time! Be sure to comment if you have something to say! Smash the like if you found this helpful! Click follow so that you won’t miss out on future updates!

Bitcoin are looking more and more bullishI am a big fan of Bill Williams indicators, the alligator, AO, AC and Fractals. So let's begin with them.
First entry - May 31
On may 29 A bullish divergent emerged, which is marked with a red circle. It was also confirmed by our AO, which showed a shift in momentum. In addition to that, AC showed Bullish TWIN PEAKS (marked with a red trend line in the AC indicator) which further confirmed the possible trend reversal.
At this time the RSI i moving in a oversold zone. The DMI and ADX are moving near 25 level and are showing no strong signals from bears or bulls.
We also bounced from our lower trend line
The bullish divergent + RSI oversold indicator were the firs that showed a possible reversal. I placed the first buy order at $ 7500, which was just above the bullish divergent highest high on May 25. It was hit on May 31.
June 3 - Fractal and next entry level
On June 2. we broke above our down channel.
A Fractal appeared on June 3. which is our 2. entry level at $7,821.
June 7 - Fractal and next entry level
In the period between May 31. and today we keep getting confirmations from our AO, which is telling that buyers are entering the market.
The Alligator (green, red and blue line) are narrowing in and can make a crossover, which is bullish.
The RSI is moving above 50 level and are now in bullish territory.
DMI and ADX are still neutral, but these are slow starters but strong indicators when it is trending.
We are waiting patiently for our next entry level and have set a stop loss at $7,410.

Is It The END for TRON!?Hey everyone!
Many of you asked me to tell what do I think about TRXBTC . So here we are.
First of all, I don't like TRON as a project, never was interested in it, but it doesn't mean we can't make money on it, right?
Here is TRXBTC 1D chart. It looks okay from the first sight, but let's take a look at it a bit closer.
We have huge accumulation zone around 400 satoshi, where we've been for almost a month, someone needed to buy it here.
And we also have resistance zone at around 1k satoshi. Huge psychological resistance level as well.
We can see local support line at 765 satoshi. And now we have chances to enter down trend. As 15 EMA is about to cross 30 EMA.
And now, the most interesting part! Take a look at Awesome Oscillator, which was above 0 since 23 of March, but now it went below 0. It's a bearish signal. Let's wait and see how our support line will work.
But we all know that TRON likes to being PUMPED .
So may be you want to buy some, just in case it will have a great pump.
I, honestly, better stay away from this coin. And you decide by your own, always make your own research.
Don't take risks, wait for the confirmation of trend.
Please leave a like and follow, let's make money together!
Thank you!

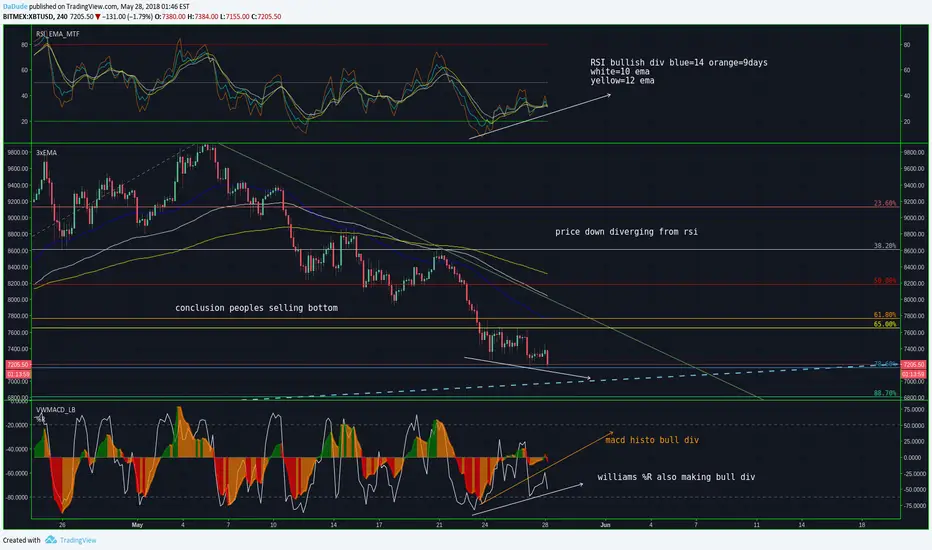
Bitcoin, selling bottoms, here's whyThis is why in my opinion people are fooled by emotions and fud news into the bags of accumulators
I appreciate constructive feedback
Learning ATRIX. Lession №1 - BasicsAtrix trade system is a improved implementation of "Profitunity" (Trading Chaos) trade system by Bill Williams based on TRIX algorithm. You just can trade by Trading Chaos rules with Atrix and TTC or use trading rules for TRIX. See idea updates for details.
Of course, Atrix have some unique features. I will tell about them in the following educational ideas. Stay tuned.
This series of educational ideas is published at the request of international subscribers of the Atrix and TTC indicators which you can find im my profile in script section or in a linked ideas section. These publications should help subscribers use Atrix and TTC with maximum efficiency.

IOTA - Market reviewsomehow it would be;)
IOTA Stop Buy 90min BDB
risk- 0.084$
potential profit - sky's the limit


IOTA - market reviewat the moment it looks like this ..
but it is very possible that from the marked 5 wave will be made 3 wave because it is high pressure UP!

BTCUSD - Market ReviewWe are approaching the top of wave 5
the correction should take place soon
after that I am looking for a signal in BUY and I am starting rockets!


IOTA - Market ReviewMy favorite IOTA before a small correction
After correction, we launch the most powerful rocket!

BTC - Market Review , End of wave 4We have reached the top of the wave 3 now the correction or wave 4, I think we are in the B wave of 4, now the small increases and the C wave down on which we will bounce up to the waves 5.
Wave 4 statically goes down between 38-50% of wave 3, target zone is marked on the graph.

BTG - Stop BuyTime for BitCoinGold
I think it looks very tasty!
Risk of about $ 6 for 1 BTG potential profit for the moon;)
BUY stop with a 2D time interval

EOS -open BUY STOP positionMy today's open position at EOS
When the market does not generate large movements, you can say that it falls asleep,
I do not know if I decide to go up or down, but I know that I do not want to miss the moment of awakening,
So I bet 2 options with the STOP order
BUY and STOP SELL alloys
In this case, the price went up, so this BUY Stop order was opened to me
opposite order becomes STOP LOSS for him
my risk is the distance between BUY and SELL
this is one of the basic inputs that he uses

ETH - Market Review 30.03.2018My most likely scenario for the moment
it looks like the end of a big correction
theoretically, we have one more hole left
after which we can look for the input signal in BUY

IOTA - Market Review End of correctionIOTA follows as planned
We are already at the end of the correction
One more hole - wave 5 and we should break the big waves 3
In target, I start looking for a signal to enter the LONG position
Target Zone 3 wave is between 9.9-15.5 $

BTC - Market Review 30.03.2018I have't written for a long time because the situation is not very clear
a new hole was created
my new most likely scenario for the moment
if it breaks down this 5C mark, we're flying very low
blessing..

BTC - the end of correction is accurate target zoneWe are approaching the end of the correction
I expect a big jump to the top
yet only one wave down
if we are really in the third wave, then nothing should stand in her way to activate the rocket;)

BTC - correction UPDATEprobably the drop that we had was just a wave A from the correction
the increase is a B wave and now we have a C wave down which should go lower than the A wave
in the upward wave, 3 waves are clearly visible, suggesting B waves
I fired a stop order Sell from 15 min BDB Bar marked with a turquoise line
