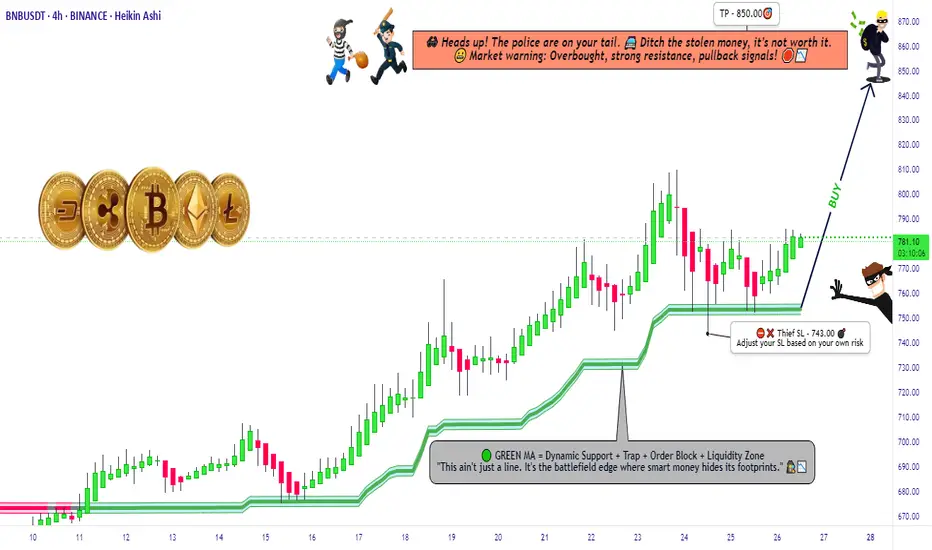
"BNB Primed for a Pump – Thief Trading Mode Activated!"🚨 BNB/USDT HEIST PLAN – SWIPE THE BULLISH LOOT BEFORE COPS ARRIVE! 🚨
🌟 Attention, Money Makers & Market Robbers! 🌟
(Hola! Oi! Bonjour! Hallo! Marhaba!)
The BNB/USDT vault is CRACKED OPEN—time to execute the ultimate heist! 🏦💰 Based on 🔥Thief Trading Style Analysis🔥, here’s your lucrative robbery blueprint for the Binance Coin vs. Tether market.
🔐 MASTER PLAN: LONG ENTRY HEIST (HIGH-RISK, HIGH-REWARD)
🎯 TARGET: 850.00 (or escape before the cops show up!)
🚨 POLICE TRAP ZONE: Overbought + Strong Resistance – Bears & cops are lurking!
💎 TAKE PROFIT EARLY & TREAT YOURSELF! (You’ve earned it, outlaw!)
⚔️ ENTRY STRATEGY: SWIPE FAST OR WAIT FOR THE PULLBACK!
🤑 VAULT IS OPEN! Enter any price if you’re bold (instant long).
🕵️♂️ SMART THIEVES: Use buy limit orders near 15M/30M swing lows/highs for a safer heist.
🛑 STOP-LOSS (ESCAPE ROUTE)
Thief SL: 743.00 (4H candle wick – adjust based on your risk tolerance!)
⚠️ WARNING: If the cops (bears) break in, DON’T HESITATE—RUN!
🎯 TARGETS & ESCAPE PATHS
Scalpers: Trail your SL & escape with quick loot! (Only long-side allowed!)
Swing Bandits: Hold strong but watch for police traps!
📡 MARKET INTEL (WHY THIS HEIST WILL WORK)
Bullish momentum in play! (But stay sharp—consolidation & reversals possible.)
Fundamentals, COT Reports, On-Chain Data, & Sentiment all hint at more upside!
🚨 TRADING ALERTS – DON’T GET CAUGHT!
📰 NEWS = VOLATILITY! Avoid new trades during major releases.
🔒 LOCK PROFITS! Use trailing stops to protect your stolen gains.
💥 BOOST THIS HEIST – STRENGTHEN THE SQUAD! 💥
🔥 Hit the LIKE & FOLLOW to support the robbery team!
🚀 More heists coming soon—STAY TUNED, OUTLAWS! 🚀
🎯 Trade Smart. Steal Big. Escape Faster. 🏴☠️
Binancecoin
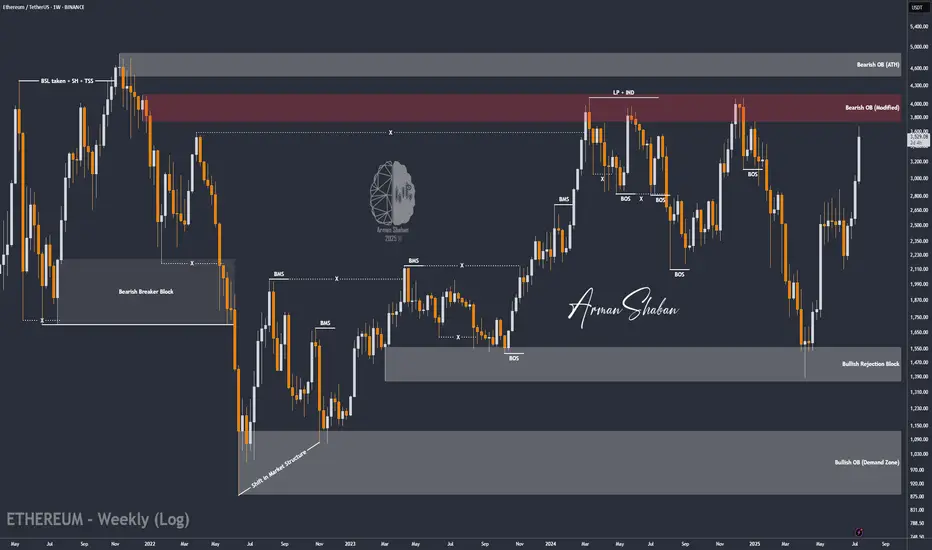
ETH/USDT | The Next Target is $4000 and it's Close! (READ)By analyzing the Ethereum chart on the weekly timeframe, we can see that this cryptocurrency remains one of the strongest major cryptos in the market, continuing its bullish rally despite the overall market correction. It has already hit the next target at $3500, and I believe we might see Ethereum reaching $4000 sooner than expected! Based on previous analyses, if this bullish momentum continues, the next targets will be $3740, $4100, and $4470.
Please support me with your likes and comments to motivate me to share more analysis with you and share your opinion about the possible trend of this chart with me !
Best Regards , Arman Shaban
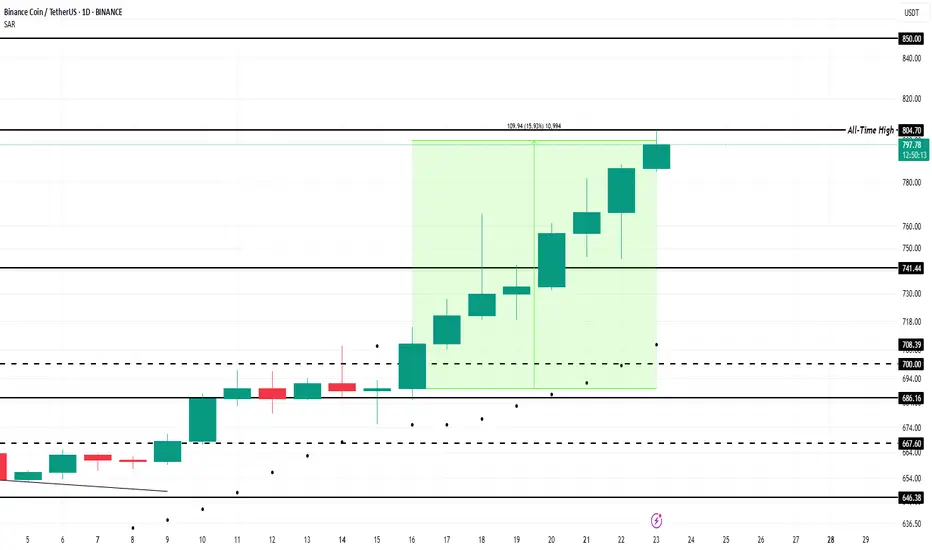
BNB Price Forms New All-Time High Above $800; Ends 7-Month WaitBINANCE:BNBUSDT price reached $804 today after a 16% increase over the past week, marking a new ATH . The altcoin has successfully ended a long period of consolidation and now stands at $799.
Its recent price movements indicate strong upward momentum, suggesting the potential for further gains. For nearly seven weeks, BINANCE:BNBUSDT has seen consistent accumulation . This trend is reflected in the exchange net position change, which shows growing investor interest in the altcoin
The bullish market sentiment is helping BINANCE:BNBUSDT break through key resistance levels. If this momentum continues, BNB could reach the $850 mark , a psychological milestone for the altcoin. This level could attract more investors and provide further price support, pushing BNB higher in the coming days.
However, should BNB holders decide to secure profits , the altcoin could face a price pullback. If selling pressure intensifies, BINANCE:BNBUSDT may slip below its current support level of $741 , which would invalidate the bullish outlook. A drop to this level would suggest a shift in sentiment, likely leading to a market correction.
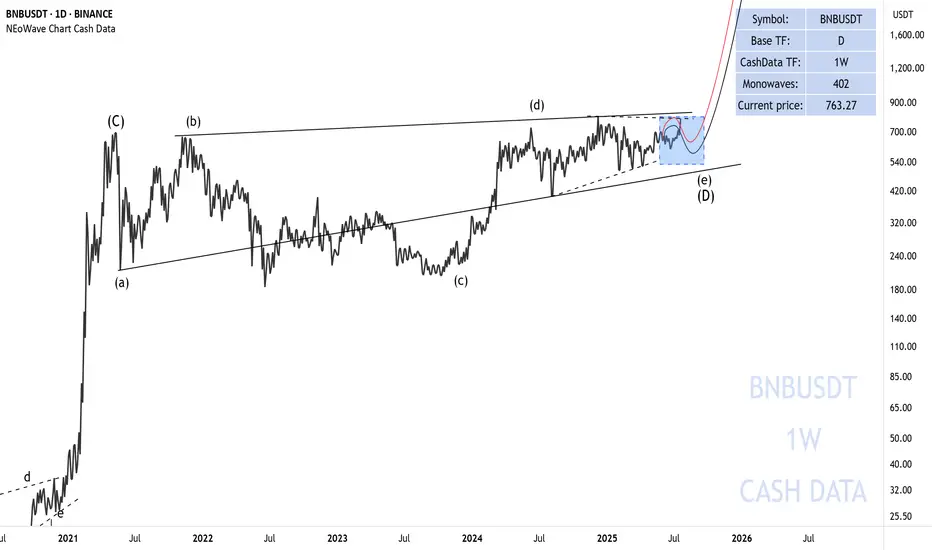
BNB is getting ready to riseThe first bullish move I was expecting for BNB has taken place and it looks like we should be waiting for the formation of wave-e of (e).
After the completion of wave-(e), we expect a big rise for BNB.
Good luck
NEoWave Chart
#BNBUSDT: A Major Bull Move Incoming $1000 Target! Binance coin is currently in consolidation phase, with no clear direction of where it will go. We consider two possible areas where it may reverse. Both of these areas have a chance to hit $1000, which we believe the price could head towards once reversed.
If you like our idea, please like and comment!
Good luck and trade safely,
Team Setupsfx_

ETH/USDT : $3000 Reached, It's time foe $4000? (READ)By analyzing the Ethereum chart on the weekly timeframe, we can see that the price has finally broken the strong $2700 resistance and pushed toward the next target at $3000! Currently trading around $3150 and now within the $3130–$3440 zone, I expect a short-term rejection from this area. However, given the overall market trend, this level may not hold for long, and we could soon see a breakout toward the next targets at $3500, $3740, $4100, and $4470!
Please support me with your likes and comments to motivate me to share more analysis with you and share your opinion about the possible trend of this chart with me !
Best Regards , Arman Shaban
THE LATEST ANALYSIS :

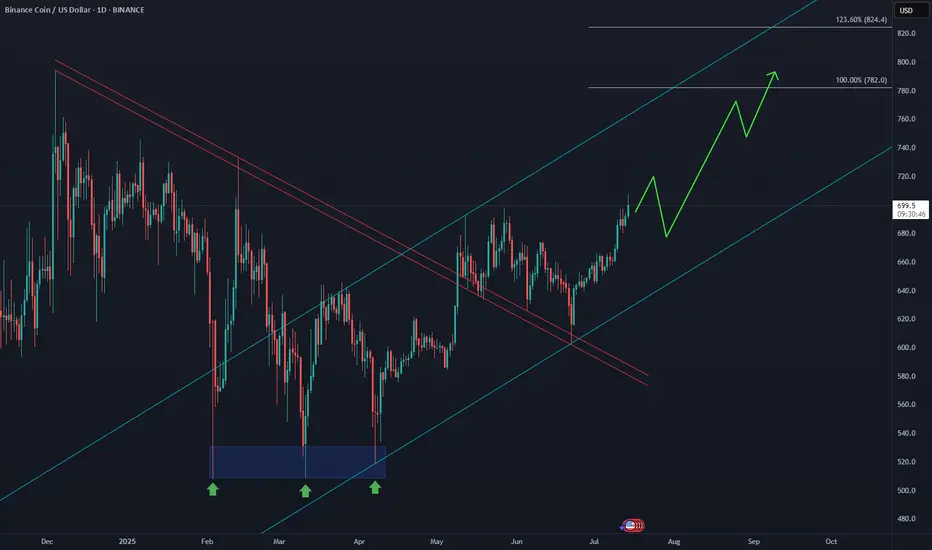
BNB Aiming for New All-Time Highs📈 After breaking above the May peak, CRYPTOCAP:BNB has activated a bullish sequence, with the equal legs target zone projected at $782–$824. This aligns with Elliott Wave extensions and confirms strong momentum from the June lows.
BNB Stuck in Barrier Triangle?CRYPTOCAP:BNB appears to be in a macro wave 4 barrier triangle, and for some time.
It has held up particularly well during the alt coin massacre, not even reaching the .382 Fibonacci retracement.
Price is testing the upper boundary for the 4th time, that starts to give us the higher probability breakout which increases with each test. The daily 200EMA and pivot were tested as support successfully.
Safe trading.

BNBBTC (Binance Coin vs Bitcoin) New All-Time High & 2026 BullI've been looking at Binance Coin vs Bitcoin and this chart has some pretty interesting dynamics, quite unique I should say. This can be a great opportunity for what is about to happen.
In the last bull market BNBBTC produced massive growth, the most interesting part is the fact that it continued to grow even during the bear market. Not that it lacked during the bull market and then grew during the bear market, but it grew strongly in early 2021 and continued to grow through 2022 while everything was going down. BNBBTC peaked only in November 2022 when Bitcoin hit bottom.
If we get some similar dynamics in this cycle, we can imagine BNBBTC starting to grow now, together with the rest of the market. When the bull market ends, all-time high, Bitcoin is going to 1M+ etc., then BNBBTC continues growing as the bear market unravels. This is because people tend to use BNB to store value and also because trading, market activity and engagement shoots up after the bullish cycle is over. Everybody, their mothers and cousins become professional traders and gamble everything away. This process can take an entire year... When all the money that was earned through the bull market is lost, then we get the bear market bottom and the cycle repeats.
At this point many people will be selling and giving up, but that would only be the start. November 2022 vs November 2026. Ok... That is too far away, let's focus on this present day.
Binance Coin vs Bitcoin, BNBBTC, produced a major low December 2023 and a higher low February 2025. December 2023 marked the end of the bear market for this pair. February 2025 confirms the bearish wave is over; the downtrend is no more.
We have a transition period, consolidation for more than a year. From the bottom we grow.
I am expecting a new all-time high on this pair and this is an easy guess. The only danger Binance was facing came from the previous administration, before Trump. Now that the Cryptocurrency hating crowd is gone, we can aim to the top and beyond. There is no limit to how far up anything Crypto can go. Truly... This is only the start...
It is still early
Notice how some pairs are really high and very advanced on their bullish cycle. Notice how other pairs are still trading at bottom prices. Pairs like this one can be approached easily, with low risk with 5X focused on the long-term. Very low risk with a high potential for reward... Never chase a rising wave. It is better to look for one that is yet to start.
Imagine if you were surfing. Would you be able to join a wave that is already pretty advanced? It can end your life. But if you glide patiently on your board looking around to catch a newly developing wave... It would be an awesome ride and your enjoyment is secure, guaranteed and safe. Catch the early wave.
There are endless opportunities in this market.
Your continued support is appreciated.
Crypto is the future of finance.
Crypto is the evolution of the Internet.
.....
Oh and by the way, the same dynamic I mentioned here between 2021 and 2022, also happened in 2018-2019. This means that there is high probability that BNBBTC will continue growing beyond the 2025 bull market. It is likely to grow during the bear market as well.
There are always several pairs that are used as a hedge. Finding those ahead of time can make a huge difference on how strong your portfolio remains during the bear market. I will be recommending selling though but not 100%. We will be selling around 60-70% and the rest we keep invested regardless of what happens. We are Crypto, we love Crypto and we support he market.
Namaste.

HolderStat┆BNBUSD consolidated above the $650 levelKUCOIN:BNBUSDT is holding firm above 650 after breaking through a symmetrical triangle. The price structure is supporting a bullish continuation toward the upper resistance zone at 690–700. A clear uptrend is forming with tight consolidation along support, hinting at a breakout move.

BNB Price Today: Downtrend Ends As Bullish Momentum Strengthens
BNB is currently priced at $658 , showing resilience despite market volatility. However, it’s facing a micro downtrend this month. The positioning of the exponential moving averages (EMAs) below the candlestick indicates a potential bullish trend.
This pattern suggests that if BNB can maintain its current price, there could be an upward movement, making it a favorable outlook for investors despite the ongoing market uncertainty.
For BNB to regain bullish momentum, breaking free from the downtrend is key. A bounce off $646 support could help BNB target $667 , which has proven difficult since May.
The RSI remains above neutral, signaling growing buying pressure that could fuel the uptrend. A successful breach of $667 into support would confirm a more optimistic outlook for the coin.
If market conditions worsen, BNB risks dropping below the $646 support . In this scenario, the next levels of support at $628 and $615 would be tested.
A break below these levels could invalidate the bullish outlook, leading to further declines. Investors should stay alert to shifts in broader market sentiment.

HolderStat┆BNBUSD held supportKUCOIN:BNBUSDT keeps coiling inside a contracting wedge above the $639 launchpad. A 4-h close over 650-655 can spark a thrust to 680 and revive the 700–710 “new-high” box; slip-back under 630 delays the breakout but leaves the structure intact 🚀

BNB Pump???On the daily chart of BNB, a symmetrical triangle has formed, and the price is approaching a breakout point. The $600–$604 zone, aligned with the 200-day moving average and the descending trendline, acts as a key resistance. A bullish breakout could push the price toward the $696 area. On the downside, the $575 support is crucial — if broken, the next potential drop could target the $505 zone. Price compression and declining volatility suggest a strong move is likely soon.
📈 A major move is coming for BNB!
🔺 Resistance: $604
🔻 Support: $575 and then $505

BTC Dips After ATH – $100K Support in Focus Amid TensionsBy analyzing the #Bitcoin chart on the weekly timeframe, we can see that after rallying to $111,980 and printing a new all-time high, price faced a correction down to $100,000.
Currently, Bitcoin is trading around $105,700, and with geopolitical tensions escalating, particularly the risk of war, we could see further downside — potentially taking price as low as $90,000.
However, if BTC manages to hold above the $100,000 level, there’s a strong chance we’ll see a short-term rally toward $120,000.
This analysis will be updated as the situation evolves. Stay tuned!
Please support me with your likes and comments to motivate me to share more analysis with you and share your opinion about the possible trend of this chart with me !
Best Regards , Arman Shaban

BNBUSDT 4H Analysis – Bullish Reclaim After False BreakdownBNBUSDT is showing strong bullish potential after recovering from a classic false breakdown scenario. The price structure suggests a high-probability long setup backed by solid support reclaim, clean invalidation, and clearly defined targets.
Market Context
On the 4-hour timeframe, BNBUSDT dipped below its key support zone between $640.51 – $651.47. This move triggered a false break — where price momentarily breaks below key support to trap late sellers and absorb liquidity.
What followed is a sharp recovery back above the support region, confirming the breakdown as a liquidity sweep rather than genuine bearish continuation.
Key Technical Highlights
• Support Reclaim: After the wick to $633.22, price quickly rebounded and is now holding above $651.47, suggesting strong buyer interest at that zone.
• Supertrend Flip Potential: The Supertrend zone resistance at $654.18 – $660.30 is currently under pressure. A flip here could accelerate bullish momentum.
• Well-Defined Range Structure: The move sets the stage for a return to previous range highs, with clear take-profit targets and a tight invalidation level.
Trade Setup – Long Opportunity
• Entry: Current levels around $654 – $655
• Stop Loss (SL): $640.51 (just below reclaimed support)
• Take Profit 1 (TP1): $671.80
• Take Profit 2 (TP2): $690.03
• Risk–Reward Ratio: ~2.62
Setup Type: Reclaim + Range Continuation
This trade leverages the false breakdown as a springboard for upside continuation, with the SL placed just under the support line and clear TP levels based on prior resistance zones.
Strategy Outlook
The false break around $633.22 likely flushed out weak longs and triggered liquidity collection. Now that BNB has reclaimed the support and is stabilizing within a rising demand zone, buyers may aim for previous resistance levels.
A sustained close above $660.30 would further confirm bullish control, potentially speeding up the move toward TP1 and TP2.

Binance Coin Consolidation Bearish or Bullish? $975 TargetThat's the question I am about to answer.
The action is happening above the March 2024 high. Binance Coin's current consolidation is considered bullish because it is happening above this level. There is also a series of higher lows since 2-Feb. 2025. There has been a strong recovery in the last four months.
The fact that the recovery is slow and extended gives it strength.
The action is sandwiched between 0.5 and 0.618 Fib. extension levels. These two levels work as immediate resistance and support.
Bullish patterns and signals are present all across this chart.
» BNBUSDT is bullish. Next strong target and new all-time high will be $975.
Thank you for reading.
Namaste.

Can JTO pull a BNB All-Time-High Move??BNB made a similar pattern that led to it's previous ATH.
Since we are still waiting on the new ETH a time highs, followed by altseason, we can expect to see altcoins beginning to increase when ETH trades sideways. More on that here :
We can also expect to see rallies across other altcoins:
and
But before we see a glorious altseason, ETH needs to start moving to the upside as a starting point.
_______________
BINANCE:JTOUSDT
BINANCE:BNBUSDT

BNB/USDT Trade Setup: Bullish Trend, Discount Entry & Fibonacci 📈 BNB/USDT Trade Setup Breakdown 💰🔥
Currently watching BNB / USDT closely... and it's looking interesting! 🧐
BNB has been in a steady, bullish trend with consistent retracements into equilibrium of previous price ranges — offering repeated opportunities to buy at a discount. 📉💸
My bias remains bullish — I'm looking to continue with the trend.
Price has pulled back into my optimal entry zone, you could get long now or wait for a deeper pullback, depending on your personal entry criteria. 🎯
🛡️ Stop-loss goes just below the previous swing low, maintaining tight risk control.
In this video, I break down:
🔹 How I use Fibonacci + Fibonacci extension for precise entries and target zones
🔹 My custom Risk/Reward tool, a variation of the Fib extension.
🔹 Key zones I’m watching, and how I’m managing this setup.
⚠️ Not financial advice. Always do your own research and manage risk accordingly.
💬 Your opinions or feedback? Let me know in the comments 👇

BNBUSD aiming for $800 and that's only short-term.Binance Coin (BNBUSD) is staging a strong short-term push after holding its 1D MA200 (orange trend-line). This is taking place on the technical Bullish Leg of the 10-month Channel Up.
The 1W RSI broke above its MA trend-line (yellow) and that confirmed this new bullish structure. The previous Bullish Leg peaked a little over the 2.0 Fibonacci extension. Our short-term Target is therefore $800.
-------------------------------------------------------------------------------
** Please LIKE 👍, FOLLOW ✅, SHARE 🙌 and COMMENT ✍ if you enjoy this idea! Also share your ideas and charts in the comments section below! This is best way to keep it relevant, support us, keep the content here free and allow the idea to reach as many people as possible. **
-------------------------------------------------------------------------------
💸💸💸💸💸💸
👇 👇 👇 👇 👇 👇

BNB will rest after reaching 1000BNB has successfully bounced back from the support area and heading towards the next resistance which is around 900-1000. This target is easily achievable for BNB since is fundamentally strong and BNB ecosystem is heavily used.
I'm expecting BNB to reach 1000 in 3rd of this year.
Follow Our TradingView Account for More Technical Analysis Updates, | Like, Share and Comment Your thoughts.
Cheers
GreenCrypto

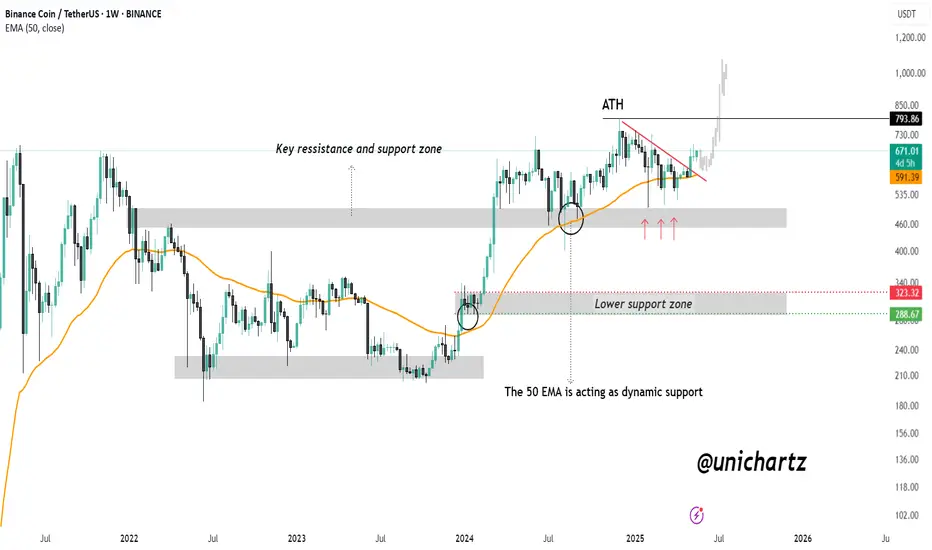
BNB Weekly Breakout: Road to $1,000?CRYPTOCAP:BNB is showing strong bullish momentum on the weekly chart. The 50 EMA is acting as a dynamic support, holding firm during multiple retests and providing a solid foundation for upward movement.
Recently, price action has broken above a key descending resistance line and successfully reclaimed a major support-resistance zone, turning it into a strong base. This area, which previously acted as a battleground for bulls and bears, is now supporting the current rally.
As long as BNB continues to hold above this zone and the 50 EMA, the structure remains bullish. With sustained momentum, a retest of the all-time high zone around $793 is likely, and a breakout above it could open the door for a move toward $1,000 and beyond.
DYOR, NFA
BNBUSDT - Big Move Loading….BINANCE:BNBUSDT recently made a clean breakout from a strong resistance level, and since then, it’s been chilling in a tight consolidation range textbook flag formation if you ask us! This kind of local flag pattern often signals a continuation of the previous move, and in BNB’s case, that move was up.
The consolidation phase seems mature now, and price action is starting to show signs of life again. With growing hype around BNB and Binance related developments, momentum could be building for a strong leg up. If things go as expected, the next destination might just be its previous all-time high. 👀
Traders should watch for volume confirmation on the breakout from this flag. A decisive move above the pattern could trigger a sharp rally. But hey as always, don’t forget your stop-loss. Protect your capital and ride the move smartly. Let’s see if BNB is ready to fly again!
BINANCE:BNBUSDT Currently trading at $653
Buy level : Above $655
Stop loss : Below $620
Target : $795
Max leverage 5x
Always keep stop loss
Follow Our Tradingview Account for More Technical Analysis Updates, | Like, Share and Comment Your thoughts

BNBUSDT - Potential SupportWhen my latest BNB analysis() still printing, best trade is the one you make with your profits!
I'm watching BNB, specifically this blue box, where buyers might step in.
If price drops to this zone, I won't trade blindly. I'll look for a breakout above a small resistance level within the box, followed by a retest as support on a lower timeframe. This confirms buyer interest.
I'll also monitor order flow, CDV divergences, and volume spikes for clues. In narrow ranges, watch for liquidity hunts dips below support that quickly recover. Failed breakouts above resistance within the box, or regained levels, are also key.
Remember, I won't insist on a short if price breaks upward with volume and retests that level as support; I'll consider longs. Flexibility and confirmation are crucial.
I hope we reach this blue area to gauge the market reaction. Expect volatility. Missing this setup could be costly. Stay tuned for updates; you can rely on my insights.
📌I keep my charts clean and simple because I believe clarity leads to better decisions.
📌My approach is built on years of experience and a solid track record. I don’t claim to know it all but I’m confident in my ability to spot high-probability setups.
📌If you would like to learn how to use the heatmap, cumulative volume delta and volume footprint techniques that I use below to determine very accurate demand regions, you can send me a private message. I help anyone who wants it completely free of charge.
🔑I have a long list of my proven technique below:
🎯 ZENUSDT.P: Patience & Profitability | %230 Reaction from the Sniper Entry
🐶 DOGEUSDT.P: Next Move
🎨 RENDERUSDT.P: Opportunity of the Month
💎 ETHUSDT.P: Where to Retrace
🟢 BNBUSDT.P: Potential Surge
📊 BTC Dominance: Reaction Zone
🌊 WAVESUSDT.P: Demand Zone Potential
🟣 UNIUSDT.P: Long-Term Trade
🔵 XRPUSDT.P: Entry Zones
🔗 LINKUSDT.P: Follow The River
📈 BTCUSDT.P: Two Key Demand Zones
🟩 POLUSDT: Bullish Momentum
🌟 PENDLEUSDT.P: Where Opportunity Meets Precision
🔥 BTCUSDT.P: Liquidation of Highly Leveraged Longs
🌊 SOLUSDT.P: SOL's Dip - Your Opportunity
🐸 1000PEPEUSDT.P: Prime Bounce Zone Unlocked
🚀 ETHUSDT.P: Set to Explode - Don't Miss This Game Changer
🤖 IQUSDT: Smart Plan
⚡️ PONDUSDT: A Trade Not Taken Is Better Than a Losing One
💼 STMXUSDT: 2 Buying Areas
🐢 TURBOUSDT: Buy Zones and Buyer Presence
🌍 ICPUSDT.P: Massive Upside Potential | Check the Trade Update For Seeing Results
🟠 IDEXUSDT: Spot Buy Area | %26 Profit if You Trade with MSB
📌 USUALUSDT: Buyers Are Active + %70 Profit in Total
🌟 FORTHUSDT: Sniper Entry +%26 Reaction
🐳 QKCUSDT: Sniper Entry +%57 Reaction
📊 BTC.D: Retest of Key Area Highly Likely
📊 XNOUSDT %80 Reaction with a Simple Blue Box!
📊 BELUSDT Amazing %120 Reaction!
📊 Simple Red Box, Extraordinary Results
I stopped adding to the list because it's kinda tiring to add 5-10 charts in every move but you can check my profile and see that it goes on..
