Binance Coin (BNBUSD): Very Bearish Outlook! Here is Why:
Have you seen that huge head & shoulders pattern that was formed
on Binance Coin on a daily.
After yesterdays' fundamentals, the price successfully violated its neckline and closed below that.
Probabilities are high now, that the market will keep falling.
Goals: 256 / 243
❤️Please, support my work with like, thank you!❤️
Binancecoin

Binance Coin BNB Price targets if SEC will ban Crypto StakingCoinbase CEO says he heard rumors the SEC wants to ban crypto staking.
Already crypto exchange Kraken shuts down crypto-staking.
This will have ripple effects in the entire industry!
My price targets for Binance Coin BNB are:
BNB/USDT short
Entry Range: $300 - 310
Price Target 1: $282
Price Target 2: $265
Price Target 3: $220
Stop Loss: $337

I Don't Mean to FUD, But BNB has a SCARY PotentialUsing VOLUME PROFILE, I see BNB has a potential to go doen to below 100 USD, if the 200 area fails
Not FUD, but please be prepared

Binance Coin ( BNB/BTC ) Price AnalysisTechnical Analysis of BNB/BTC:
The current trading price of BNB/BTC is 0.0132 BTC and is currently trading near a high resistance level. The resistance level at 0.0134 is crucial, and if there is a break above it, there could be an upward move of around 20%.
However, if the price rejects this level, we could see a downside move of 30% from the current price and 24% from the breakdown level.
In my opinion, a downside move is likely to occur.
Therefore, if the price hits the 0.01 BTC level, it could be a good entry point for a long-term position.
I will provide updates on the situation periodically.
Please like and share this analysis if you find it helpful, and follow me for real-time crypto updates.
Thank you.

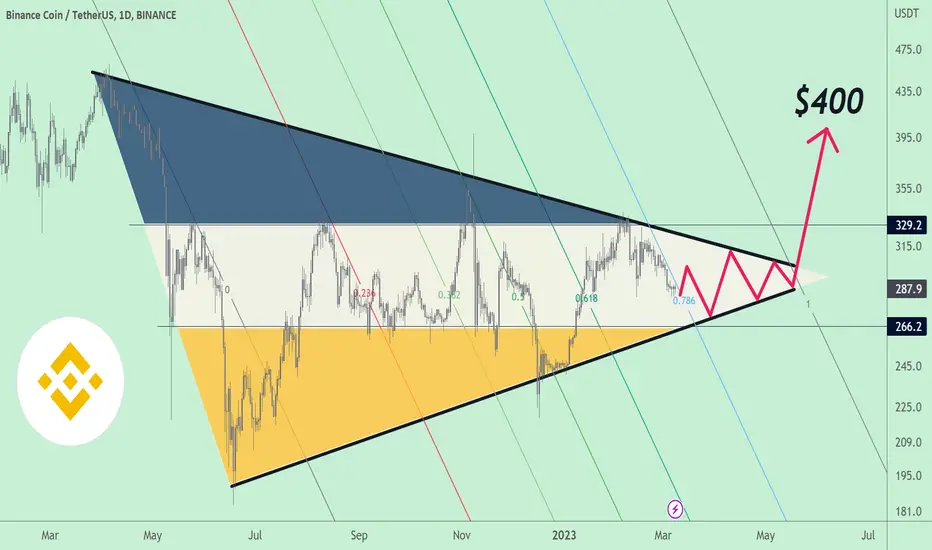
ArShevelev /// BNB Crazy Big Triangle to Breakout!Binance holding nicely during whole bear market phase, and it seems like it will make another good profits for those who entering next bull phase!
$400 is a "musthave" expectations, realisticly prices could be much, much higher in 2025.
Kind Regards
Artem Crypto
long BNB$BNB is bouncing off the major support level. Bullish movement to resistance level at 323$ is likely to happen.

✴️ Binance Coin Early But Has Recovery PotentialJust as we saw with Bitcoin, Binance Coin (BNBUSDT) is showing early reversal signals.
The signals being early means that they are not yet confirmed, not strong.
BNBUSDT hit a low 18-Jan., higher low 13-Feb., and higher low 6-Mar., yesterday.
✔️ All this action is happening right above the 0.5 Fib. retracement level for the bullish wave that started after the 18-Dec. low.
✔️ All this action is also happening right above the MA200 black line.
MA200 is a strong indicator and after being conquered early January it continues to be tested as support and so far holds.
This is the early signal...
As long as Binance Coin (BNBUSDT) stays trading above MA200 (287) and the 0.5 Fib. retracement level (278.9), the bullish potential remains intact.
The longer this pair stays above these levels and the easier for us to see a resumption of the initial move which is the bullish breakout that happened in January.
That's the early signal, the potential for a recovery.
On the other hand, if these levels fail undoubtably we will see this and other pairs move lower.
Trading volume is really low and this feels more like consolidation... If we zoom out, see we have long-term higher lows:
So it is all a waiting game... Either it goes up now or after activating the next support.
The bottom line and most important detail is that the bias remains UP!
Patience is key.
Namaste.

All eyes on shib👀As it shown in the chart
Shib moving on down trend in daily chart and reached the golden support (0.618 fib level) with doji candel
It's a strong sign for bullish up in next few days
Don't forget to support us with ur likes, comment and follow for more ideas.💯🎯

Binance Coin: slow moves to continueBNB continues to be under the impact of all the news surrounding Binance exchanger. During the previous week several senators in the US Congress requested detailed information on Binance`s business operations amid concerns over the company's practices within a field of compliance with a law on anti-money laundering that sanctions. At the same time, Paxos announced that it will halt minting new BUSD as it has been requested by the New York Department of Financial Services amid concerns over offering unregistered securities. In addition to the mentioned, there was a general negative market sentiment related to the developments with the Silvergate bank. All this drove the BNB`s price to the downside, to the level of $288, where the coin is finishing the week.
During the whole previous week, the price of BNB was pressured to the downside, with prevailing selling orders as of the end of the week. Still, at the beginning of the week the price was struggling to hold around the $300 resistance line, but without success. During the week the RSI indicator was pushed further to the downside, below level of 50, reaching level of 38 as of the end of the week. This is a clear indication that the market is eyeing the oversold side, leaving some space for the price to move further to the downside. Moving average of 50 days clearly slowed down its divergence from MA200 counterpart, putting into question recent Golden cross.
Considering significantly decreased daily trading volumes on the crypto market, there is indication that the price of BNB will continue with slow moves during the week ahead. There is a probability for the price to move further to the downside, only if the current short-term stop at $280 does not hold selling pressures. At the same time, the $250 support line is still far away, in which sense, there is currently a low probability that this level might be tested in the week ahead. In case that $280 holds, then there is probability for a quite a short reversal, at least to the level of the resistance line at $300.

BINANCE - Higher Timeframe OverviewFrom looking at BINANCE, we can see that we are still in wave 4 which is an ABC correction.
We are now in wave B which is broken down into 3 subwaves. We've seen subwaves A and B and now in subwave C. See lower timeframe analysis for the breakdown.
Trade Idea:
- Watch for completion of subwave C (of Wave B)
- Once complete, watch for C wave to make an impulse down (it can be an ending diagonal)
- Watch the structure at the lows if we bounce from it.
- Targets: 680, 870, 1000 ,HODL the rest and manually close.
Goodluck and as always, trade safe!

$44,000 is incoming! Bitcoin BoomDon't mistake shortening BTC, i am warning you this early
If the market goes sideways or makes some corrections sellers will lose ultimately!

Will the same scenario be repeated?As you can see on the weekly chart, the similarity between the 2019 wave and the 2023 wave.
You will notice that there is a strong rise after breaking the resistance of 5500 in 2019 due to the impulse of the fifth wave.
We expect the same scenario to happen in 2023.
It is still an impulsive wave, which will break the resistance of 25000 and allow trading above it.
don't forget to support us with ur like , comment and follow for more ideas.🎯

BNBUSD Bull flag targeting $390The Binance Coin (BNBUSD) is below its 1D MA50 (blue trend-line) trading inside what seems like the early stages of a Channel Down ever since the rejection on the 336 Symmetrical Resistance (which has formed 3 tops since May 23 2022).
The last such rejection though formed a similar Channel Down (red) that ended up being nothing more than a Bull Flag that later made a Higher High. The Higher High bias emerged as the pattern since June is a Channel Up. This time BNB has the 1D MA200 (orange trend-line) as a Support and not as a Resistance and is coming off a 1D Golden Cross.
We are bullish and our first target is Resistance 1 (398.0) and if we get a 1D candle closing above, then extension to Resistance 2 (460.0).
P.S. We have been medium-term bullish on BNB since December:
-------------------------------------------------------------------------------
** Please LIKE 👍, FOLLOW ✅, SHARE 🙌 and COMMENT ✍ if you enjoy this idea! Also share your ideas and charts in the comments section below! **
-------------------------------------------------------------------------------
💸💸💸💸💸💸
👇 👇 👇 👇 👇 👇

Binance Coin: Don’t Act So Coy(n)! 😏Binance Coin should stop acting so coy regarding the magenta-colored zone between $278.90 and $245.40. We expect the altcoin to dive into this area to finish wave (2) in magenta before turning upwards again. Alternatively, there is a 33% chance that Binance could have already concluded wave alt.(2) in magenta and might thus climb above the resistance at $358.60 to develop wave alt.(3) in magenta.

Binance Coin: without strengthPrevious week was generally marked with decreased market optimisms, related to the inflation figures and potential further FED`s increases of interest rates. However, since the beginning of the year, BNB did not manage to make some significant moves, where the coin has been impacted by the all news surrounding Binance exchanger. During the previous week there has been additional news related to Binance in which SEC puts some notes to Binance`a proposed acquiring deal with Voyager, a recently failed crypto lender. Namely, the regulator believes that Voyager`s native token VGX is a security and as such it should have been properly registered. In this sense, the sale of unregistered securities is prohibited by the law in the US.
The level of $320 was a starting point and a highest point for BNB during the previous week. Regardless of general market sentiment, the coin made only incremental moves toward the $300 support line, where BNB is finishing the week. Selling orders prevailed on the market during the whole week, but with very low daily trading volumes, there was no strength for some higher moves. RSI crossed the 50 line, indicating that the market is currency more oriented toward the oversold side. The positive development is with moving averages, where MA50 continues to strongly diverge from its MA200 counterpart, confirming recent Golden cross.
BNB will start the week ahead by testing a $300 support line. In case that selling orders prevail there is some probability for this line to be breached. However, considering significantly decreased daily trading volumes, some significant moves should not be expected. Most probable level in this case would be a short term stop at $280. On the opposite side, there is currently quite a decreased probability that BNB could return to $320 level.

Long on BNB-USDI'm looking for a high of $310 on the day. I'm not expecting it to do much more than trade sideways. If the preliminary support can be viewed as such, than I suspect we may see a breakout. Bare in mind as we close out Q1, that at the end of Q2 there is a forecasted burn. Which is why you'll see recovery from downtrends.
Around this time approximately>>> 2022 : $375.04 USD | 2021 : $228 USD | 2020 : $20:39 USD
Current Total Crypto Market Dominance: approximately 4.51%
Opinion on regulatory climate: I'm going to accumulate regardless of "news", or "rumors"... I'm aware of the scrutiny surrounding PAXO's... and I'm unbothered by it. It's good to know, but it hasn't changed my perspective to accumulate as much BNB as possible ahead of the Litecoin & Bitcoin Halvings. I'm aware of the 200 jurisdictions having signed onto an FATF agreement to regulate crypto.... the delegates actually did agree on introducing implementation on FATF standards... so the industry will see an introduction of a framework that largely benefits exchange operators such as Binance. How so?... it wont come into effect until the second quarter of 2024. Exchanges have a full year to work with, and adjust to a new global regulatory climate. Those whom are new to market will see the space as "cleaning up"... i welcome it.
BNB Chain deployed the most dApps in 2022. BNB Chain deployed 2,163 dApps
Global Expansion:
Q1 Observations -
- CZ plans to expand Binance headcount by 33% in 2023
- CZ suggests algorithmic stable coins may reemerge (a multichain stable)
- Tripling of validators too a set of 100
- Introduced third chain; BNB Greenfield + Optimism Roll Ups
EOY Guess: Last Bull Run vs this "Mega Bull Run".... i think BNB on the low end touches $900, on the bullish side it crosses $1200 USD, settling to $797 at the conclusion of the bullrun mid Q2 of 2024.

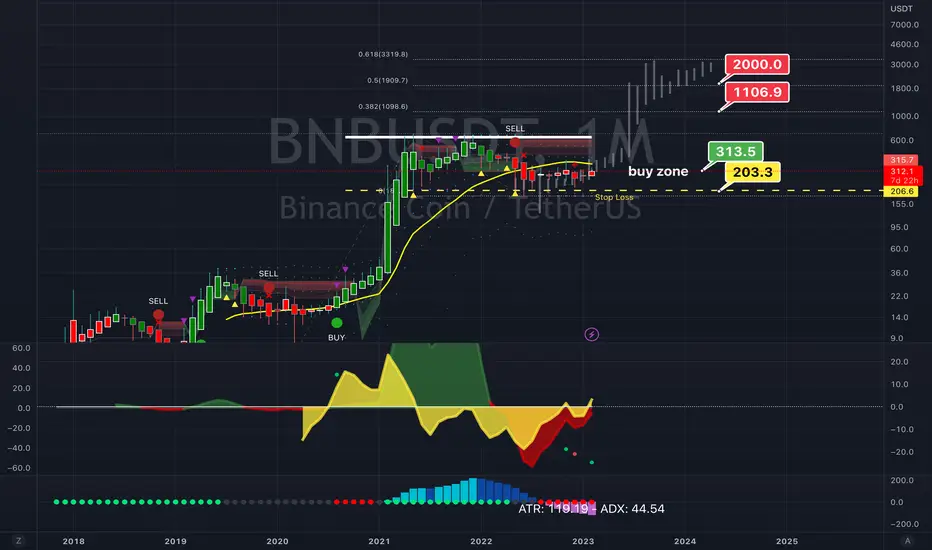
BNB is the strongest asset!Hello, traders!
As you know I expect the price of Bitcoin below $15k, therefore most of altcoins can lose up to 70% from their current price. The BINANCE:BNBUSDT is the exception.
Let's take a look at the Binance coin's Elliott waves structure. The Awesome oscillator allows us the define the wave 3 bottom and build the analysis based on that. Wave 3 was shorter than wave 1. It means that wave 5 could be even trimmed one. In the worst case I expect only slight lower low.
Taking all these facts into account I am going to buy BNB below $200 , for me it's good price for long term investments.
I also want you to bring attention that wave 4 is a complex corretion. It's untradable market struture. This wave can be already finished or make another one leg up, it's really difficult to predict.
Best regards, Ivan
________________________________________________________________________________________________
If you like my trade ideas, please smash the boost button to stimulate me make more quality analytics!

Mdx Getting Ready For Massive Recovery Testing Major Trendline In Higher Timeframe
Once Trendline Got Cleared Bounce Will Be Epic
Incase Of Breakout Expecting 200 To 220% bulish Move

Binance Coin shortBinance Coin bounced off the resistance level. Asset bounced off the descending trendline. Bearish movement to support level at 284 is possible.

Binance coin (BNB) forming bullish Crab | A good buy opportunityHi friends, hope you are well and welcome to the new trade setup of Binance coin (BNB) with US Dollar pair.
Recently we caught more than 12% pump as below:
Now on a 4-hr time frame, BNB is about to complete a bullish Crab move for another bullish reversal move soon.
Note: Above idea is for educational purpose only. It is advised to diversify and strictly follow the stop loss, and don't get stuck with trade

ACH 2023 ProjectionAs shown, Shark pattern detected on ACH coin. It is headed to the price reversal zone above then will start a huge bearish move to the order block below. Hopefully by the end of the year we should be see it making all time highs.

BNB to $1000 by Jan 2024BNB has multi time frame squeezes. And the most powerful of all has been set up in the monthly chart. This is monthly price action so each bar represents one month. If the monthly squeeze fires to the upside we will see BNB to move past $1000 by the end of year. There is a confluence in money flow indicators as well. I will place a position trade on this for a long term play with a stop at 250 level.
Binance Coin:Potential UpsidesHey traders, in today's trading session we are monitoring BNBUSDT for a buying opportunity around 300 zone, once we will receive any bullish confirmation the trade will be executed.
Trade safe, Joe.
