Binancecoin


Sol usdt shortSol is looking good for short at 35 if it breaks the green line.Green line acting like a good support for Sol.if it breaks we see the red line and after that white line will be our target. Here all line are representing supports.

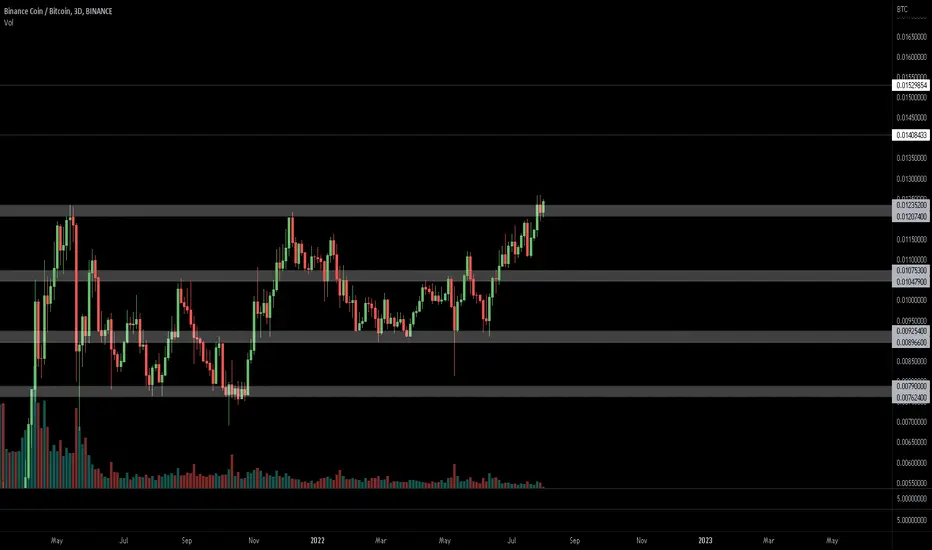
Bitcoin Historical Support LevelsMuch is said and said about what Bitcoin will do. Here, I leave you a simple and simple technical analysis, take your conclusions. Leave your comments, like if you like it and share. Follow me for more analysis and without complications.

BNBUSD rejected on the 1D MA200 but only postpones the rallyThe Binance Coin (BNBUSD) has been on a +85% rise since the June 18 low and only last week it hit its 1D MA200 (orange trend-line) for the first time since April 05. As then, the test has been unsuccessful and the price got rejected. The pull-back is so far contained above both the 1D MA100 (green trend-line) and the 1D MA50 (blue trend-line).
With the RSI on the 1W time-frame having broken above its Lower Highs trend-line on July 21, this may be consistent with the strong buy signals that (excluding the March 2020 COVID crash) BNB gave at the start of each of the previous parabolic rallies. As you see on Feb 06 2019, Feb 03 2020, and April 15 2020, when the 1D MA200 broke, a Higher High was made (probably if it wasn't for the March 2020 Black Swan event, the Feb 03 break would have been a consistent rally).
The key is the 1D MA100. On all consistent rallies, as long as that level held as a Support, BNBUSD kept fuelling the rise with Higher Highs. The 1D MA100 is now at $272.5. A pull-back near it is a strong buy signal, break below it is invalidation, while if a break above the 1D MA200 comes first, it's a break-out buy signal into the new Bull Cycle.
--------------------------------------------------------------------------------------------------------
** Please support this idea with your likes and comments, it is the best way to keep it relevant and support me. **
--------------------------------------------------------------------------------------------------------

Bitcoin: whale reasoning. This is how Investment funds workBitcoin (BTC)
The main crypto is in a similar situation to the US500 and the Nasdaq 100 which anticipated the breaking of the Falling Wedge and before the Apple indices which is the most capitalized company on Wall Street.
The Hedge Fund reasoning is quite simple and logical.
In the accumulation phase, or at the end of the bearish phase of the market, first buy the best and safest products such as Apple, Microsoft which consequently push the indices to turn upwards as is happening now and then go to other alternative assets '' '' like the crypto market which is increasingly subject to the Wall Street BOT.
So that we find the Crypto market '' lagging behind '' the stocks market is a completely normal thing and it has always happened.
If Wall Street continues in the buying direction as it is happening now, in a few weeks we will see an important and long-awaited bullish phase in the digital asset market.
The Chart:
The price found support in the all-time high of 2017 at the price of 20k and is stuck in a Falling Wedge as it will break the resistance diagonally and will have great room for growth.
Almost all the Altcoins that are not Lottery Tickets are following the same conformation as the BTC and therefore of WS.
The golden rule is to buy the best crypto and not lottery tickets
PS: RSI of stocks is already in the area higher than 60% in the BTC we are still below 50% as there will be the intersection we will have a great trend change signal (Finally!)
If you liked the analysis, leave a like, comment and follow us.
LPI, grow with us.

Binance Coin (BNB/USDT) - 4HR - Potential Bearish Momentum MACDBinance Coin (BNB/USDT) cryptocurrency is in a intraday uptrend (15-minute, 1-hour, 4 hour time frames).
However, the MACD indicator is beginning to exhibit potential bearish momentum.
Binance Coin could pullback down about -4% over time for swing trading (especially if Bitcoin pulls back down as well).
Watching intraday price action for signs of a double-top or resistance failure.
note: all content is Not financial advice. trade at your own risk.

Neo short Neo is looking High Risk high reward setup for short if it breaks first two blue lines it will hit last one soon

SHORT BUY POSITION on BNBwith the Idea of "buy the floor, sell the roof", we are currently close to the previous floor so a buy position can be taken with proper risk management.
"the trend is your friend till it isn't"

#Binance Coin Recoils after a 70% Rally, BNB Support at $300#Past Performance of the Binance Coin
BNB is undoubtedly one of the top performers in the recent past. It is currently up 70 percent from 2022 pits despite losses in recent days. The primary trend is upwards, and resistance is around $340. This level coincides with May 2022 highs, a critical liquidation zone that buyers must overcome for a clear-cut trend definition.
Binance Coin Technical Analysis
After solid gains from mid-June 2022 following sharp losses in H1 2022, BNB rebounded solidly. At spot rates, the coin's prices have nearly doubled. All the same, there are lower lows versus the upper BB, suggesting weakness and tapering momentum. The immediate support is the middle BB, the 20-day moving average, and later $300, the psychological round number. Therefore, provided these reaction levels hold, aggressive traders can ramp up in expectation of trend continuation. Meanwhile, playing your trades close to the chest means waiting for a break above $340 and May 2022 highs. In that case, BNB bulls may ride the resulting trend, ideally if the breakout bar has high trading volumes, targeting $360 and $450.
What to Expect from #BNB?
Bulls are confident, but cracks are beginning to emerge, questioning the strength of the uptrend. The first resistance level is $340 and must be broken if buyers need to sustain and continue with the current leg up.
Resistance level to watch out for: $340
Support level to watch out for: $300
Disclaimer: Opinions expressed are not investment advice. Do your research.

BNB - 4H more pullbackThis vital resistance zone has reversed the price three times, and the last time the price made a lower high and lower low, so it needs more pullback even if it wants to break the zone.

UNFI USDT Graph Update Unfi move 40% Upward From our mentioned area . Moving as per prediction ✨🎉 We see 80 to 90% upward movement.

BNBUSDT: It is overbought?Hey traders, in today's trading session we are monitoring BNBUSDT for a selling opportunity around 320 zone, once we will receive any bearish confirmation the trade will be executed.
Trade safe, Joe.

BNB Binance Coin Entry Range, Take Profit and Stop LossBNB/USDT
Entry Range: $320 - 340
Price Target 1: $366
Price Target 2: $388
Price Target 3: $406
Stop Loss: $285

Ethereum (ETH/USD) good call ETHUSD
The second crypto by market cap is in a very interesting graphical situation.
1) The price is channeled in an Down channel, which by default breaks upwards.
2) RSI is crossing UP 50% higher which is a strong buy signal.
3) The price after breaking the first resistance (lower red box) is breaking is heading towards the next resistance (the upper red box)
4) Found an all-time low at the technical price of $1k which triggered buy orders.
So to summarize we are in two options:
a) That the price follows the broad wave of BTC and Wall Street breaking the Down channel and the existing resistance to attack the all-time highs at $ 5K
b) If the price is rejected near the resistance and the upper band of the Down channel it will look for new lows in the historical resistance of $ 500
LPI.sa

Binance Price Analysis — August 12Binance Coin (BNB) held on to its bullish bias on Friday after dropping from the $335 area yesterday. The smart chain cryptocurrency slowed its descent at the $320 low, where my multi-month tripwire coasts and has since bounced off the line.
We could see a bullish continuation over the weekend, with BNB breaking the $340 line for the first time since early May as the cryptocurrency industry continues to lean towards ending the ongoing bear cycle. At the same time, we could see a quiet tone over the weekend, as has been commonplace in the last few weekends. Either way, I do not see a bearish sentiment taking precedence this weekend.
Meanwhile, my resistance levels are $340, $350, and $360, and my support levels are $320, $310, and $300.
Total Market Capitalization: $1.19 trillion
Binance Coin Market Capitalization: $52.5 billion
Binance Coin Dominance: 4.5 %
Market Rank: #5

BNBUSDT - Descending Broadening Wedge Pattern!!BNBUSDT (1D Chart) Technical analysis
BNBUSDT (1D Chart) Currently trading at $330
Buy level: Above $325
Stop loss: Below $235
Target 1: $375
Target 2: $460
Target 3: $523
Target 4: $690
Max Leverage 2x
Always keep Stop loss
Follow Our Tradingview Account for More Technical Analysis Updates, | Like, Share and Comment Your thoughts

BNB rising wedge #BNB/USDT
$BNB is above lower line of rising wedge.
The same scenario of #BTC!
🐻 break down from lower line will drop price to support zone.
🐮 rejection from lower line of this pattern will increase price to upper line and maybe resistance zone.

BNBUSDT BEARISHHello
In Daily TF BNB is facing a bearish Trendline.
In 1H BNB is in a wedge and facing the higher line of the pattern , on the moment i can see a bearish divergence in 15M TF , so I'm looking for a sell position.
you can see my trading setup with a good R/R.
what's your idea

#BNB, Trying to go for a flip of the ATH into price discovery#BNB
Trying to go for a flip of the ATH area into price discovery
UCTS is bullish overall, and a fresh 4H buy signal that may permit LTF entry has just printed.
Attempt to use an HH as the start of a larger movement.
BNBUSDT, Multi timeframe analysis. Update Hello my friends. This is an update of previous analysis (blow link). Everything is clear on the chart for you like always, BNB has better condition than other coins and tokens. Buy points at 248 and after break the trend line above 285. For safe buy its better to wait for fixation above 350.
Good luck.
If you like the idea, do not forget to support with a like and follow me for next analysis :)
Write your comment and opinion here to me

BNBUSDT, near a sensitive zone. Binance coin. UpdateHello my friends. This is an update of previous analysis (blow link). Everything is clear on the chart for you like always, BNB has better condition than other coins and tokens. Buy points at 248 and after break the trend line above 285. For safe buy its better to wait for fixation above 350. and now we are near this sensitive zone and strong resistance.
Good luck.
If you like the idea, do not forget to support with a like and follow me for next analysis :)
Write your comment and opinion here to me

BNBUSDTBINANCE COIN IS under main DYNAMIC RESISTANCE
I will not do anything till 334$ breaks.
if the price breaks clearly ill try to buy in pullback then I put targets on the chart with 278$ stop-loss.
