Chiliz Daily TA : 02.19.22 $CHZAll the supports and resistances are marked on the chart and everything is clear in this analysis , but , just in case , if you had any questions or doubts Please feel free to ask in the Comment section .
Follow our other analysis & Feel free to ask any questions you have, we are here to help.
⚠️ This Analysis will be updated ...
👤 Arman Shaban : @ArmanShabanTrading
📅 19.Feb.22
⚠️(DYOR)
❤️ If you apperciate my work , Please like and comment , It Keeps me motivated to do better ❤️
Binancecoin

BNBUSDT Daily TA : 02.19.22 $BNBAll the supports and resistances are marked on the chart and everything is clear in this analysis , but , just in case , if you had any questions or doubts Please feel free to ask in the Comment section .
Follow our other analysis & Feel free to ask any questions you have, we are here to help.
⚠️ This Analysis will be updated ...
👤 Arman Shaban : @ArmanShabanTrading
📅 19.Feb.22
⚠️(DYOR)
❤️ If you apperciate my work , Please like and comment , It Keeps me motivated to do better ❤️

BNB/USD - At CRITICAL support $400. Can it Rally Again?BNB find itself at a key junction, sitting just above the critical support at $400. If buyers fail to keep BNB above this level, then it won't be pretty as BNB will lose the current uptrend (dotted trendline).
Yesterday's drop invalidated this most recent breakout from the downtrend, hopefully BNB can go back above it again.
Right now, BNB may have another chance to test the key resistance at $450.
The indicators are not that encouraging, particularly the MACD which is losing momentum, even if still on the positive side.
The RSI did make a higher low on this most recent drop, so that is positive. Lets see if it lasts.
Volume appears flat, so that is neutral. Hence, BNB bias is neutral at this time. The chart can go either way. We will find out in the next few days.
Like and follow if you liked this analysis.

Attractive but hard (Update 2)This analysis is a personal analysis and is an update of the latest analysis of this currency in my archive
Using the waves, we have determined the end of a path and it is probable that this will happen in the future
There is no certainty in the market and an analysis has a breakout limit and in this analysis it is $ 338 Therefore, the accuracy and observance of the stop is very important Without stopping, it represents a losing gamble......
We are not gamblers, we want to win


BNBUSDT - Short position from x20 Pending sell orderShort position from x20
Pending sell order.
Open a position strictly at the specified price, since after passing this level, the probability of a price decrease increases
Risk management per position 2-5%
Target and stop loss indicated on the chart.
All profitable trading

#BETAUSDT GOOD OPPORTUNITY TO BUY BEFOR EXPLOD We were in a downtrend for almost 130 days I think it the time to change the direction. my strategy is based on technical analyses

BNB/USD - About to BREAKOUT! 20% Rally Possible! 😍BNB appears at the limit to break away from this downtrend. As you can see on this 3D timeframe, the MACD+RSI and the price action support the bullish case.
A clean break and re-test of the previous trendline as support would allow BNB to rally at least 20%.
Wait for the breakout and then take a position. The market has been quite bullish today, but most of the price increase was on weak volume. This is a warning sign that maybe this increase is a fakeout.
So make sure to use a proper stop loss if you take a position, otherwise, good luck!
Like and follow if you liked my idea!

Head and Shoulders pattern on BNBUSDT chart-In the BNBUSDT H1 Binancecoin chart, after hitting the long-term downtrend line, the Head and Shoulders pattern is formed, the neckline is broken and the stop loss is placed on top of the head & we can expect a profit as much as the height of the pattern.
-We will set the SL (Stop loss) on downtrend breakout and set TP (Take profit) on 368.7 (The height of head and shoulders pattern)
We hope it will be profitable for our supscribers and we
Please support us with your likes 👍 and comments.

BNB respected to the MA 40 resistance As mentioned earlier, Binance respected the 40-brick moving average resistance zone and completed the first descending brick. (see the link below)
This can be an early sign that the downtrend is continuing
If Binance returns to the previous range zone (below $ 386), it indicates a failed break-up that could continue in the opposite direction (further decline). Therefore, it can be considered a sign of further price decline.

BNBUSDTHello Crypto Lovers,
Mars Signals team wishes you high profits.
We are in the 4-hour time frame. The price has created the S1 support line. We expect it to fall down to this line once more. As long as it is not able to break the R1 line which it has hit several times, it will not be able to move up to R2. If the S1 line is broken, the S2 zone will be the next area of support. So we need to wait for the price to break one of these lines to be able to decide more easily.
Warning: This is just a suggestion and we do not guarantee profits. We advise you to analyze the chart before opening any positions.
Wish you luck

Binance Price Analysis — February 11After a modest bullish comeback last Friday, Binance Coin has lost its upbeat momentum at the $436 resistance and has recorded lower highs ever since the loss of traction. This bearish undertone coincides with the top of my multi-month descending wedge, which has consistently kept BNB from a bullish breakout since November.
That said, should BNB capitalize on the upbeat sentiment around the broader market and breach the wedge top, we could witness a rapid rise away from the line and towards the $500 resistance. Bulls need to defend the $410 support line to use as a launchpad to breach the wedge in the coming days.
Meanwhile, my resistance levels are 436, $450, and $460, and my support levels are $410, $380, and $350.
Total Market Capitalization: $1.98 trillion
Binance Coin Market Capitalization: $68.8 billion
Binance Coin Dominance: 3.46 %
Market Rank: #4

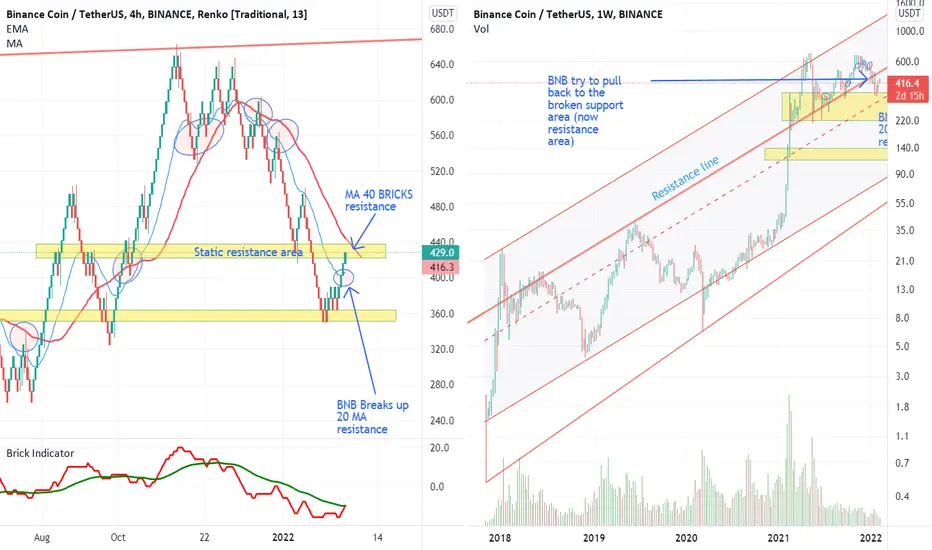
BNB facing a strong resistance areaThe image on the right shows the long-term Bainance channel from 2018. As can be seen, the important support line seen in the long-term channel has been broken. Binance tries to pull back this broken support (which has now become resistance.)
three important resistances must be broken to confirm the trend change (downtrend to uptrend)
1- Stable resistance in the of $ 430
2. Important MA 40 bricks resistance in Renko chart ($ 440 to $ 450)
3- Long-term trend resistance line ($ 500 which Binance is trying to pull back to this area)
If resistances 1 and 2 break, the target price will be around $ 500
BNBUSDT Bullish Scenario.
Watch at the green trendline, but I would say that if we break and close abvoe at 440 level. Than we'll see new ATH for BNB.
Bearish Scenario.
The red trendline, which break down side, and now retest also. This will lead the way to down side more. But go with proper risk management.

Binance Coin. BUY or Sell ?📊 BNBUSDT (Binance Coin)
💹 Time Frame: Daily (Update)
➖➖➖➖➖➖➖➖
🟡 BNB broke the $395 resistance and is trying to hold above MA50 and now testing the $430-$440 resistance area and the range of 61.8% correctional Fibonacci. If the resistance breaks. We will see a
good upward move in BNB if it breaks and holds above the $440 area. The next local resistance is the $460 area and the major resistance is the $500-$510 area. The support, for now, is $390-$395
area. This Analyzing is not a signal. It is your responsibility to buy and sell and be sure to include losses in your transactions.
➖➖➖➖➖➖➖➖
👤 AmirHossein
📅 02.08.2022
⚠️ (DYOR) BINANCE:BNBUSDT

BNB - My Trading Plan in a video!Hello everyone, if you like the idea, do not forget to support with a like and follow.
Here is the top-down analysis for BNB, feel free to request any pair/instrument or ask any questions in the comment section below.
Best of luck!

Binance, one more wave up?In the previous idea we said that a break of the trend line and the upper boundary of the trading range would be good buying opportunities.
As a result, we see that the price has reached our targets. Now we can identify the key level on the chart, which acts as resistance.
In the case of a squeeze and breakout, a good buying opportunity may arise. I want to warn you that false breakouts are possible.
Write in the comments all your questions and instruments analysis of which you want to see.
Friends, push the like button, write a comment, and share with your mates - that would be the best THANK YOU.
P.S. I personally will open entry if the price will show it according to my strategy.
Always make your analysis before a trade.

BNB is going to skyrocketBNB is in a local range. A trend line can be identified on the chart. A squeeze and break of the trend line could be a good buying opportunity. The first target is the upper boundary of the range.
Write in the comments all your questions and instruments analysis of which you want to see.
Friends, push the like button, write a comment, and share with your mates - that would be the best THANK YOU.
P.S. I personally will open entry if the price will show it according to my strategy.
Always make your analysis before a trade.

Binance Coin (BNB) - February 3Hello?
Traders, welcome.
If you "follow", you can always get new information quickly.
Please also click "Like".
Have a nice day.
-------------------------------------
(BNBUSDT 1W Chart)
The 341.7-383.3 interval is an important interval that determines the trend.
Therefore, it is necessary to check whether the 341.7-383.3 section can support and rise.
If it goes down from the 332.4 point, it could fall below the 258.6 point, so you need to trade cautiously.
However, as long as it does not fall below the downtrend line, it is likely to lead to an uptrend.
In order to continue the uptrend, a sideways trend should appear in the 383.3-507.9 section.
--------------------------------------
(BNBBTC 1W Chart)
If the price holds above the 0.009135-0.009485 range, we expect the uptrend to continue.
------------------------------------------
We recommend that you trade with your average unit price.
This is because, if the price is below your average unit price, whether the price trend is in an upward trend or a downward trend, there is a high possibility that you will not be able to get a big profit due to the psychological burden.
The center of all trading starts with the average unit price at which you start trading.
If you ignore this, you may be trading in the wrong direction.
Therefore, it is important to find a way to lower the average unit price and adjust the proportion of the investment, ultimately allowing the funds corresponding to the profits to be able to regenerate themselves.
------------------------------------------------------------ -------------------------------------------
** All indicators are lagging indicators.
Therefore, it is important to be aware that the indicator moves accordingly with the movement of price and volume.
However, for convenience, we are talking in reverse for the interpretation of the indicator.
** The MRHAB-O and MRHAB-B indicators used in the chart are indicators of our channel that have not been released yet.
(Since it was not disclosed, you can use this chart without any restrictions by sharing this chart and copying and pasting the indicators.)
** The wRSI_SR indicator is an indicator created by adding settings and options to the existing Stochastic RSI indicator.
Therefore, the interpretation is the same as the traditional Stochastic RSI indicator. (K, D line -> R, S line)
** The OBV indicator was re-created by applying a formula to the DepthHouse Trading indicator, an indicator disclosed by oh92. (Thanks for this.)
** Support or resistance is based on the closing price of the 1D chart.
** All descriptions are for reference only and do not guarantee a profit or loss in investment.
(Short-term Stop Loss can be said to be a point where profit and loss can be preserved or additional entry can be made through split trading. It is a short-term investment perspective.)
---------------------------------

Binance coin Hello everyone...!
BNB will come to around $260 and run some sideways until mid-2022. After the 2nd quarter of 2022, BNB will start bull and will make a new ATH.

BNB shortI see clear bear continuations everywhere. If the first support doesn't hold the price, maybe a little bounce on the second support. Short term bear market is still in dominance. Be analytical, intelligent, and relaxed don't try to catch the knife wait, and analyze the current situation, you are not a crazy person. The market will tell you which way she is going. Walk with the trend. Goodluck pals!

#BNBUSDT Important chart! This one is different.BNB is holding the support unlike other large cap coins.
It has shown massive growth in the last 2 years.
This level is important.
Golden pocket around $266 Which is the best buy area as per chart followed by some signs of reversals in ltf charts.
Lower support levels are $346 and $266.
What to do if you are holding longs?
IMHO, Better to hold with a SL below $335.
if you're looking to buy better wait for $266 or Start buying at cmp and DCA at lower levels.
I will personally wait.
What's your thought?
DO hit the like button and share your views in the comment section.
Thank you

🔥Binance Coin short signal#BNB/USD
🔥Binance Coin
🔴Short: 390-410$
🔰Stoploss: 430$
💰Target:
❌365$
❌320$
❌300$
Subscribe!
