I think $BNB is not so bullish in short term#binance coin #bnb price is now moving inside the ascending channel after the dump. The structure seems not so strong. Not financial advice.
Binancecoin

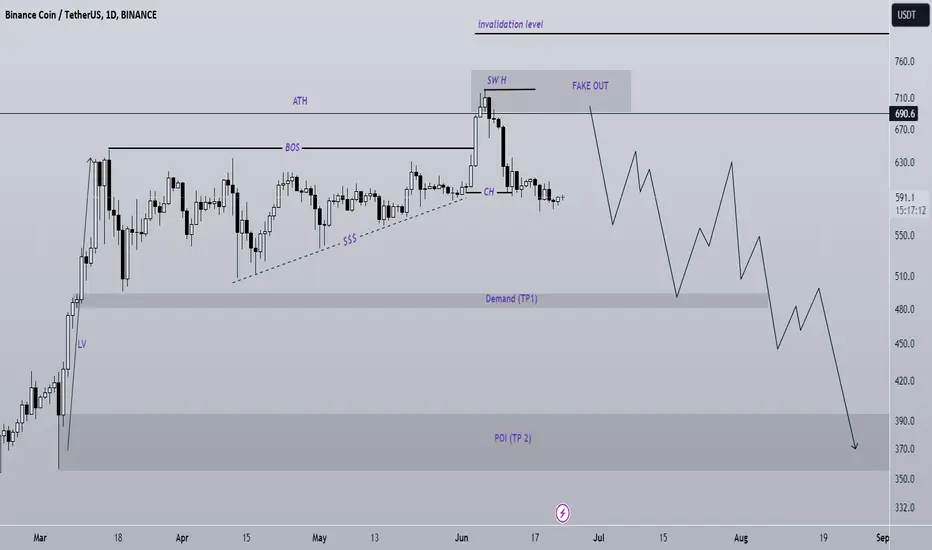
BNB is bearish for the MID-TermIt went above ATH but could not stabilize above ATH.
Below the price there is the liquidity pool and Liquidity Void. It is expected that the price will soon sweep these liquidity.
We specified the targets on the chart.
Closing a daily candle above the invalidation level will violate the analysis
Note that the financial market is risky, so:
Do not enter any position without confirmation and trigger.
Do not enter a position without setting a stop.
Do not enter a position without capital management.
When we reach the first TP, save some profit and try to move the stop continuously in the direction of your profit.
If you have any comments please post them, comments will help us improve our performance
Thanks
BNBUSDT.1DAnalyzing the BNB/USDT daily chart, I observe key aspects that delineate the current technical posture and potential future movements of the asset.
Technical Analysis Observations:
Support and Resistance Levels (S1, S2, R1, R2):
Support Level 1 (S1) at $359.5 acts as the immediate floor for the price. This level previously functioned as a strong support, suggesting a potential area where buyers might re-enter.
Support Level 2 (S2) at $202.0 represents a significant historical support level and a crucial psychological barrier.
Resistance Level 1 (R1) at $521.2 and Resistance Level 2 (R2) at $644.8 serve as key thresholds that the price must surpass to confirm any bullish momentum.
Trend Indicators:
The green trend line, ascending from the left lower corner, has been acting as a dynamic support. A break below this line could signal a shift in the underlying bullish sentiment to bearish.
RSI (Relative Strength Index):
The RSI is currently at 24.80, well into the oversold territory. This suggests that the asset may be underbought, potentially setting the stage for a bullish reversal if other conditions align.
MACD (Moving Average Convergence Divergence):
The MACD is below the signal line, and both are trending downwards, indicating strong bearish momentum. The spread between the MACD and the signal line, along with a deepening histogram, further confirms the bearish sentiment.
Conclusion:
From my analysis, BNB/USDT is currently in a precarious position, hovering near a critical support level at $359.5, underpinned by an oversold RSI. This suggests a possible area for a reversal; however, the prevailing bearish momentum highlighted by the MACD advises caution.
Potential strategies could include preparing for a buying opportunity if a bullish reversal signal is observed at the support level, especially if there is a bullish crossover in the MACD or an upturn in the RSI above the oversold region. Conversely, a break below $359.5 could open the door to further declines towards $202.0, in which case, defensive strategies such as stop-loss orders would be crucial.
Investors should remain vigilant, watching for increased volume or news that could influence price action. As always, it's critical to complement technical analysis with sound risk management practices to mitigate potential losses in such a volatile environment.

Is BNB Due for a Correction or Continued Climb?BNB technical analysis update
BNB's price failed to break its major resistance zone on the weekly chart. It still looks bullish in the weekly timeframe, and we can confirm the bullish movement once the weekly candle closes above the resistance zone.
BNB's price could move sideways or slightly bearish before making a new high. 👀
Reagrds
Hexa

BNBUSDT Elliott wave countAfter hitting 1.618 fib extension of wave ((i)) below 721.8 we are looking to the downside for wave ((iv)).
Possible target 0.236 fib retracement of wave ((iii)) in the span of previous wave (iv).
We are not excluding one more leg up above 721.8.

Binance Coin Analysis: Bulls in controlBNB just made a new ATH in the recent month, and now I expect a slight correction before it rockets to new highs. The main support I have in mind is around $456, with the main target at $1,570 and an optimistic target at $2,040

BNBUSD $2000 is a very realistic target for Q4.The Binance Coin (BNBUSD) is has been accumulating since basically early March (March 11 candle), trading sideways within the Mayer Multiple Bands (MMB) Mean (black trend-line) and the 1st SD above (grey trend-line). The 1W MA50 (blue trend-line) has been the support since the late December 2023 bullish break-out.
That should be the Support throughout the remainder of the Bull Cycle, in fact that was also the case during the previous Cycle where BNB had the final accumulation phase (blue ellipse) from September to December 2020, again within the same MMB zone, which initiated the most aggressive part of the Cycle (parabolic rally). Observe that the 1W MACD formed the same pattern almost.
That rally peaked on the MM 3rd SD above (red trend-line) so a $2000 price tag, which will 'only' make contact with the 2nd SD (orange trend-line), appears to be a realistic Target, even by the start of Q4 2024.
-------------------------------------------------------------------------------
** Please LIKE 👍, FOLLOW ✅, SHARE 🙌 and COMMENT ✍ if you enjoy this idea! Also share your ideas and charts in the comments section below! This is best way to keep it relevant, support us, keep the content here free and allow the idea to reach as many people as possible. **
-------------------------------------------------------------------------------
💸💸💸💸💸💸
👇 👇 👇 👇 👇 👇

Binance Coin is nearing 540 support zoneHey Traders, in today's trading session we are monitoring BNBUSDT for a buying opportunity around 540 zone, BNB is trading in an uptrend and currently is in a correction phase in which it is approaching the trend at 540 support and resistance area.
Trade safe, Joe.

Binance Coin - The $70.000 price target is real!Hello Traders and Investors, today I will take a look at Binance Coin .
--------
Explanation of my video analysis:
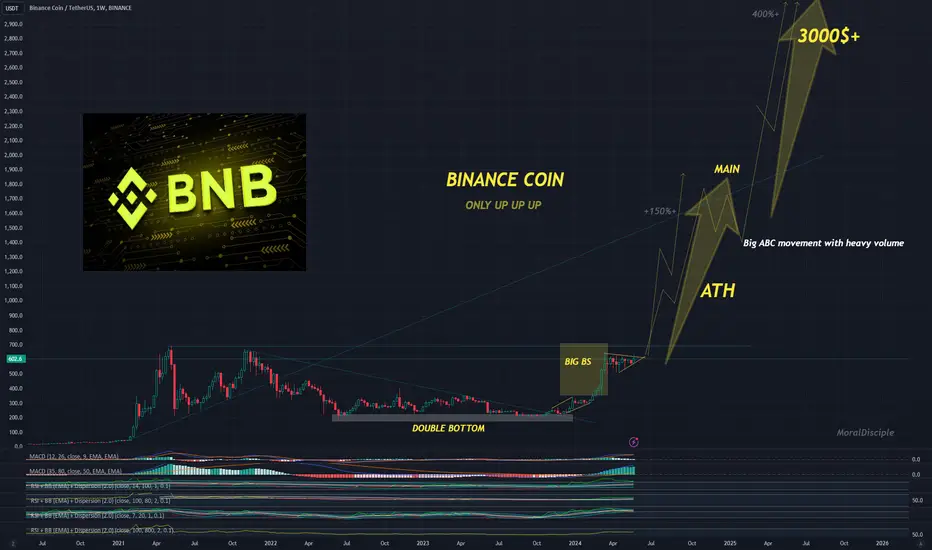
Back in 2020 Binance Coin created a decent bullish break and retest of a horizontal structure which was followed by a rally of 10.000% towards the upside. After this rally, which ended in April of 2021, Binance Coin has been trading sideways ever since. Currently it seems like Binance Coin is preparing another bullish breakout, which could lead us all the way up to $70.000 in the future!
--------
Keep your long term vision,
Philip (BasicTrading)

A powerful crypto exchange that just started. UPDATEEverything is pumping and rising soon, US500, EURUSD, GOLD, BITCOIN ETC
It is a coin of a major crypto exchange and definitely a good choice. The crypto industry is in its infancy
Only up!
BNBUSDT.1DThe BNB/USDT daily chart demonstrates a recent bullish momentum, with the price reaching as high as the R2 resistance level at $724.8 before experiencing a slight retracement. Currently, the price is near the S1 support level at $625.1, which is acting as a pivotal area for potential future price action.
The Moving Average Convergence Divergence (MACD) indicates bullish momentum, as evidenced by the MACD line being above the signal line, although the positive momentum is decreasing as the histogram bars are shortening. This suggests that while the bullish trend may be slowing, it has not yet reversed.
The Relative Strength Index (RSI) is right at the midline (50), indicating a balanced market condition between buyers and sellers. This neutral RSI suggests that there is potential for the price to move in either direction, depending on how market sentiment develops.
Given this analysis, if BNB maintains its position above S1 ($649.1), it may have the strength to retest the R2 level. Breaking above R2 could potentially lead to higher prices towards historical highs. However, if the price breaks below S1, the next support to watch is S2 at $498.2, which could serve as a lower boundary in a more bearish scenario. Investors should watch these levels closely, as they will likely dictate the short-term direction of BNB’s price movement.

BNB - New ATHs are coming soon BINANCE:BNBUSDT (1D CHART) Technical Analysis Update
BNB is currently trading at $676 and showing overall bullish sentiment sentiment. Price is currently retracing back to strong support. i think this support will hold and bounce back from there. We can enter a trade at current price and then DCA at lower price.
Entry level: $ 676
Stop Loss Level: $ 588
TakeProfit 1: $ 715
TakeProfit 2: $ 761
TakeProfit 3: $ 820.3
TakeProfit 4: $ 909
TakeProfit 4: $ 999
Max Leverage: 5x
Position Size: 1% of capital
Don't forget to keep stop loss.
Follow Our TradingView Account for More Technical Analysis Updates, | Like, Share and Comment Your thoughts.
Cheers
GreenCrypto

BNB : NEW ATH !! What's NEXT FOR BNB ??BINANCE:BNBUSDT
Binance coin / BNB has recently made a new ATH 💥🚀 And the price doesn't seem to be ready to turn around just yet. How can we gauge the next possible targets AND retracements for BNB SHORT TERM?
1) Bollinger Bands
Bollinger Band Strategy is excellent to use on lower timeframes, especially when combined with Fibonacci zones. The yellow dot basis (20d Moving Averages) is a common zone to watch for retracements, as well as bounces. As long as the price is bullish, the basis will hold and act as support. The Fib lines up until the basis can be watches for bounce zones:
Notice that periods of contractions is followed by expansion - watch the upper red and purple lines for near term targets (price labels on the right).
2) Fibonacci
Trend based Fibonacci can be helpful to identify key zones that could likely act as resistance, for example:
If we can't close ABOVE the 2.618, we stand a risk to form a nasty M-Pattern, which could indicate the end of the bullish cycle.
3) Moving Averages
The price often corrects towards the moving averages in the daily timeframe. This could be a potential re-entry zone for a swing trade (not accumulation as the price is at the peak of the bullish cycle). Understand that you risk is HIGH if you're looking to buy here. If we lose the 50d (green trendline) that could mean the bullish cycle is coming to an end. You can see the bounce is slightly smaller every time it touches, indicating the end is potentially near:
____________________________

BNB Bulls Charge Ahead: Uptrend Signals and Price OptimismBinance Coin (BNB), the native token of the Binance ecosystem, is currently displaying bullish signals across technical charts. This positive trend suggests a potential continuation of price growth shortly.
Cruising Above the 100-Day SMA:
One key indicator of BNB's bullish momentum is its position above the 100-day Simple Moving Average (SMA) on the 4-hour timeframe. The SMA represents the average price of an asset over a specific period, and the 100-day SMA acts as a line of support, indicating the overall trend direction. With BNB trading consistently above this level, it suggests a sustained uptrend and buyer dominance in the market.
Breaking Out of Consolidation:
Further bolstering the bullish case is BNB's recent breakout from a consolidation zone. Consolidation periods typically occur after significant price movements, and a breakout from this zone signifies a potential resumption of the previous trend. In BNB's case, the breakout suggests a continuation of the upward trajectory, potentially leading to new highs.
Rising Momentum on the 4-Hour Chart:
The 4-hour chart provides valuable insight into short-term price movements. In BNB's case, the 4-hour chart reveals strong rising momentum, characterized by a series of higher highs and higher lows. This momentum indicates that buyers are actively pushing the price upwards, further strengthening the bullish outlook.
Surpassing the $700 Threshold:
A significant psychological milestone for BNB was its recent climb above the $700 mark. This price point can act as a level of resistance, where sellers may attempt to cap further gains. However, BNB successfully breaching this resistance suggests a robust market recovery and increased investor confidence.
Investor Optimism on the Rise:
The technical indicators and price movements all point towards a growing sense of optimism among investors and traders. The positive momentum surrounding BNB is likely fueled by several factors, including:
• Binance's strong brand reputation: Binance is one of the largest and most respected cryptocurrency exchanges globally. Its success can contribute to increased demand for BNB.
• Expanding utility of BNB: BNB's utility extends beyond simply being a trading token. It can be used for various purposes within the Binance ecosystem, such as paying fees, participating in token sales (IEOs), and obtaining discounts on trading fees. This growing utility can drive demand for BNB.
• Overall market recovery: The broader cryptocurrency market has shown signs of recovery in recent weeks. Positive sentiment in the overall market can have a spillover effect on individual tokens like BNB.
What to Watch Out For:
While the current outlook for BNB is positive, there are always potential risks to consider:
• Market Volatility: The cryptocurrency market remains inherently volatile. Sudden shifts in sentiment or broader economic factors can lead to sharp price corrections.
• Regulatory landscape: Regulatory uncertainty surrounding cryptocurrencies can dampen investor enthusiasm and impact prices.
• Technical corrections: Even within an uptrend, there can be periods of price consolidation or pullbacks. These corrections are healthy for the market but can be misinterpreted by short-term traders.
Conclusion:
BNB's technical indicators and recent price action paint a bullish picture. Trading above the 100-day SMA, breaking out of consolidation, and surpassing the $700 mark all suggest a potential continuation of the uptrend. Investor optimism surrounding BNB and the broader market recovery further reinforce this positive outlook. However, it is crucial to remain aware of potential risks associated with the volatile cryptocurrency market. By carefully analyzing technical indicators, staying informed about market developments, and implementing sound risk management strategies, investors can potentially capitalize on the opportunities presented by BNB's current bullish momentum.

BNB looks bullishConsidering the HLs on the chart and the bullish mCH on the chart and the breaking of the trigger line, we can have a bullish view on BNB.
If there is a pullback on the green range, we will look for buy/long positions.
The target is clear on the chart
Closing a daily candle above the invalidation level will violate the analysis
For risk management, please don't forget stop loss and capital management
When we reach the first target, save some profit and then change the stop to entry
Comment if you have any questions
Thank You

BNBUSDT BULLISH BREAKOUT 💰 CRYPTOCAP:BNB is trying to fix above the Monthly Supply Zone💁♂️
Even if it's a correction case I am not looking for #BNB to go below Monthly Supply Zone
📈Our Mid-Term Target: 908$
BINANCE:BNBUSDT
LEAVE LIKE AND COMMENT FOR SUCH MORE UPDATE ☺
#CRYTOEASE

BNBUSDT.1DAnalyzing the daily chart for Binance Coin (BNB) against USDT, we observe a significant price consolidation over the recent months. As of the latest data point, BNB is trading at $629.7. The chart is marked with several key resistance (R1, R2) and support (S1, S2, S3) levels.
Resistance Levels: R1 at $649.1 and R2 at $724.8. These levels have served as strong psychological barriers where price has faced selling pressure. The break above R1 recently suggests a bullish sentiment that may attempt to test the R2 level if this momentum continues.
Support Levels: S1 at $498.2, S2 at $398.5, and S3 below that which isn't clearly shown in the chart. The support levels indicate where buying interest has historically been strong enough to prevent further declines. Notably, the price hasn't tested S1 recently, indicating current market strength.
Technical Indicators:
RSI (Relative Strength Index) is at 56, which is moderately bullish and suggests there's room for upward movement before the asset becomes overbought.
MACD (Moving Average Convergence Divergence) is showing a bullish crossover, which supports the upward price momentum observed.
Price Action: The presence of bullish candlesticks breaking above R1, coupled with increasing trade volume, indicates an accumulation phase possibly by institutional investors, signaling strength.
Conclusion: The technical analysis suggests a bullish outlook for BNB in the short term, provided it sustains above R1. Traders might look for entry points on small retracements towards R1, setting stop losses just below this level to manage risk. The next target would be R2, with a possible breakout leading to higher highs. However, any reversal and break below R1 would require reevaluating this bullish scenario. Always consider market news and broader economic indicators which might influence market sentiment and cause sudden shifts in price trends.

Testing the bottom of the ascending triangleIn the daily chart of BNB, it is observed that the price is testing the bottom of the ascending triangle formed at the price range of $580.
The significant resistance level is at $632, which, if broken, can be seen as an indication of the continuation of the upward trend. Breaking the support level at $580 could lead to a further decline in price to lower levels.

Binance Coin Price Pattern Set for Breakout is $900 Inevitable?The native coin of the crypto currency exchange Binance ( CRYPTOCAP:BNB ) price has been in a close consolidation phase for nearly 13 weeks. With each passing daily candlestick close, CRYPTOCAP:BNB gets squeezed more, suggesting a steady decline in volatility. These types of continuous consolidation in price actions are usually followed by a massive breakout, and that’s what awaits $BNB.
Binance Native Coin CRYPTOCAP:BNB price Sets for Breakout
Binance Coin price spike up 63% between March 6 and 16, setting up a local top at $646. This impressive uptrend, which only took CRYPTOCAP:BNB ten days to go from $394 to $646, was followed by a consolidative phase that exists as of Saturday.
Despite the price action from March 6 to June 1 shows the formation of a bullish continuation pattern known as a "Bullish Pennant". The aforementioned 63% rally is the flag pole, and the sideways movement that produced lower highs and higher lows is the pennant.
The forecast for this setup is determined by adding the flag pole's height to the breakout point. In Binance Coin’s case, assuming the breakout occurs at $616, the flag pole’s height shows that the Bullish Pennant target for BNB is $900. This ambitious target is roughly 45% away from the all-time high of $692.90.
However, if the market outlook worsens, sending Bitcoin ( CRYPTOCAP:BTC ) price down to $60,000, then it could disrupt the Binance Coin ( CRYPTOCAP:BNB ) price movement, leading to a bearish breakout. This move would invalidate the bullish pennant pattern. In such a case, CRYPTOCAP:BNB could slide 9% and retest the $526 support level. A daily candlestick close that flips this support into a resistance level, would validate the potential start of a downtrend.

My BNB plan for the next couple of weeksMy BNB plan for the next couple of weeks
If a breakout happens, we could see a $1000 target!
But be cautious: if it breaks down below $575, we might see $400 levels.

Binance Coin - Is the rally already over?Hello Traders and Investors, today I will take a look at Binance Coin .
--------
Explanation of my video analysis:
Binance Coin is currently clearly retesting a major resistance at the previous $700 level which was also the all time high of Binance Coin. Since we did not see a break above yet, there is simply a higher chance that we will see a (short term) move lower. If you are not in a position on BNB yet, you can potentially use this anticipated drop to enter a fresh trade.
--------
Keep your long term vision,
Philip (BasicTrading)

BNB's Pennant FormationBNB's pennant has been breached to the upside. Will the re-test confirm the move?

BNBUSD 1DBNB ~ Updated
#BNB Finally managed to break the resistance line of this pattern, A retest is expected from here, to continue the rise.
