BNBUSDT - This ALT flashes Strong BULLISH Signals 📈📉Hi Traders, Investors and Speculators of Charts📈
BNB / Binance coin is another altcoin with good upside potential for the next bullish cycle. I expect this to come into full force only after the BTC halving.
Looking at the clear bottom followed by a bullish flag pattern, it seems highly likely that BNBUSDT may make higher-highs for the short term.
It's impressive to see that BNB mid-range support held, this shows a sign of strength from buyers. Around this zone the price ultimately made the inverse Head and Shoulders bottom pattern:
A little closer look in the daily, we see the bullish flag pattern forming. A breakout UNDER will invalidate the pattern:
From a technical indicator perspective, we see two strong "BUY" signals flash in the weekly timeframe, confirming a bullish bias:
If you found this content helpful, please remember to hit like and subscribe and never miss a moment in the markets.
_______________________
📢Follow us here on TradingView for daily updates📢
👍Hit like & Follow 👍
CryptoCheck
BINANCE:BNBUSDT BINANCE:BNBUSDT.P CRYPTO:BNBUSD
Binancecoin

Binance Coin BNB Technical Analysis [April 2024]BNBUSD Weekly Chart Conditions for a Bullish Scenario
In the weekly chart, BNB is lingering around the key weekly support zone at $577 (or the range of $563-$597).
It has to maintain the price action and weekly candle closures above this zone, preferably above $597 to remain in the bullish territory.
A price consolidation above $597 will push BNB towards the next weekly resistance zone around $509 and, possibly, higher to $738-$800, the new All Time High.
A weekly candle closure below $577 zone (or below the bottom of the zone at $563) in the weekly chart will not necessary make Binance Coin bearish, but will:
1. place BNB price into the wide weekly range zone where we will see slow and choppy price action; and
2. increase probability for a further decline towards $509 and, most likely, lower to $440 region, the key weekly support.
BNBUSD Daily Chart Conditions for a Bullish Scenario
In the daily chart, Binance Coin has to maintain the price action above the zone around $589 (marked grey) to become bullish to move towards the key daily resistance of $717 and higher towards $830.
Binance Coin price can decline more from its current location towards $534.
A bearish break-out of this level will push the price towards $480.
The price action with $480 will be very important as a rejection of this support will lead to a bullish move towards $589 and could complete the ABC correction started on March 16.
Once the bearsih pullback in BNB price chart is completed, I expect to see a continuation of a bullish rally.
A strong bullish break-out of $589 from its current price location is not very likely and BNB has to complete the corrective structure (triangle, flat) before moving further up.
However, the completion of this corrective structure could be very fast.
BNBUSD Daily Chart Conditions for a Bearish Scenario
Right now the sentiment in the daily chart is neutral and it will remain neutral as long as BNB is trading below $589.
A deeper pullback is likely and the price action with $480 zone will be very important.
A bearish break-out of the key support zone around $480 and the dynamic support in the form of 50-Day Moving Average will place BNB into the bearish territory and we see an impulsive move towards $421 and, lower, to the key daily support zone at $352.
As long as BNB is trading above $480, the bearsih scenario is irrelevant.
Binance Coin BNB: A Short-Term Price Action
After testing the top of the second key support zone at $539, BNB found a base in the between $552 and $561.
Yesterday, we saw a bullish reaction to this support zone, which is an expected price action.
BNB price can push back to $586, the key intraday resistance.
The price action with these resistance level will be very important.
A bearish rejection of either of these levels could send price for a re-test of the second zone between $529 and $539, and possibly even lower to $504.
In the alternative scenario, we need to see a strong bullish break-out of $586.
In this case, the price will move to $607.
BNB will become bullish in the 4-Hour chart only upon reclaiming $607 level.

BNB Down TargetI believe a channel will be formed from here which may give Target upto $350 in upcoming days for BNB

BNB about to melt faces !BNB / USDT
BNB is forming a huge accumulation zone 2021-2024 like the previous one between 2018 - 2021
Breakout here and i see you above 2000$

BNB/USDT About to Escape an Ascending Triangle? 👀🚀BNB Analysis💎Attention Paradisers! The #BNBUSDT chart is hinting at a potential surge. We’re locked onto a crucial support line within an ascending triangle at $561.9.
💎If the support holds, the asset will just ignite a bullish charge towards the $647 resistance mark and possibly climb higher.
💎If #BinanceCoin falters here. We’ve got a safety net at the $502 support zone, famed for its market magic. This area has often shown impressive rallies and painted the chart with vibrant green strokes for $BNB.
💎Slipping beneath this vital line will mean shifting gears to a bearish phase, marked by a rush of sales. Stay alert and adaptable as we navigate the twists and turns of the #BNB trading adventure.

HelenP. I Binance Coin can break trend line and fall to $560Hi folks today I'm prepared for you Binance Coin analytics. A not long time ago price declined to the 598 resistance level, which coincided with the resistance zone, and in a short time broke it. After this, BNB continued to decline to the 535 support level, which coincided with the support zone and also broke this level too and fell to the trend line. After this, the price turned around and made an impulse up from the trend line to 585 points, thereby breaking the 535 support level. After this movement, BNB made a correction to the support level and then continued to move up to the 598 resistance level. When the price reached this level, it at once rebounded and declined to the trend line, after which, a not long time ago bounced and continues to move up near this line. For my mind, Binance Coin will reach the resistance level again, after which the price can rebound and decline to the 560 level, breaking the trend line. If you like my analytics you may support me with your like/comment ❤️

BNB Price Action Trading- BNB sound dangerous with all the FUDs made by US government.
- But Binance is still from far the first exchange in the world by liquidity and trades volumes.
- they won't let go BNB so easily.
- it's still an easy trade for now if u play it wisely, and with strategy.
- No Danger, No Glory.
--------------------------------------------------------------
Trading Parts
--------------------------------------------------------------
- Buy : 200$ ish
- TP1 : Before 350$
- TP2 : Before 650$
--------------------------------------------------------------
- Stop Loss : 170$ ( don't touch anything under 170$ )
--------------------------------------------------------------
- Rebuy a big Dip : 50$ ish
--------------------------------------------------------------
Happy Tr4Ding !

Cryptolean Binancecoin BNB UpdateYesterday Binancecoin failed to reclaim $586.
An inability to break $586 to the upside will push BNB price towards $504-$529 and, if unable to sustain price action above $504, lower to $455-$477.
A daily candle closure above the key daily resistance of $586 is required for Binance coin to have another bullish extension to re-test $635-$660.

Binancecoin BNB UpdateBinancecoin is testing the key daily resistance of $586.
An inability to break $586 to the upside will push BNB price towards $504-$529 and, if unable to sustain price action above $504, lower to $455-$477.
A daily candle closure above the key daily resistance of $586 is required for Binance coin to have another bullish extension to re-test $635-$660.

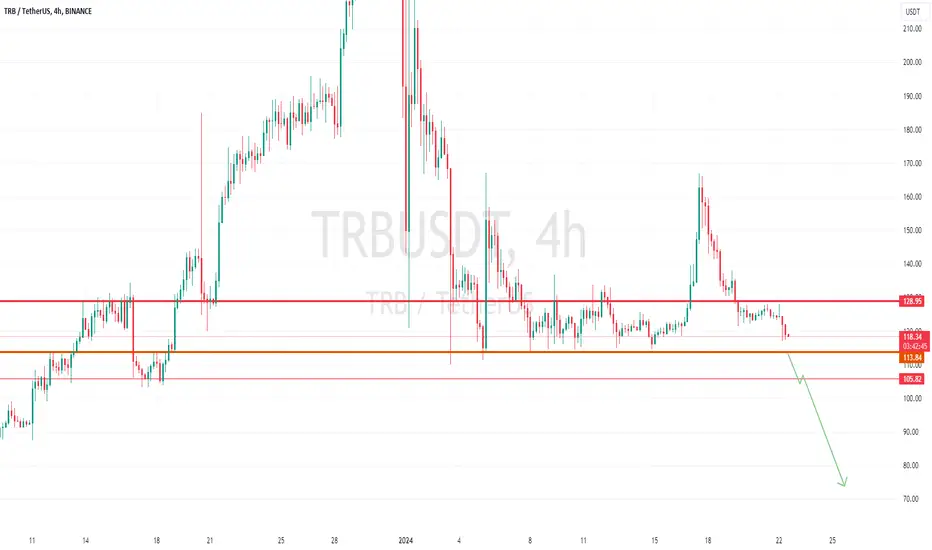
TRBUSDT.. it will hold his bottom or not??#TRBUSDT.. so guys market again at his supporting area 113 above.
that is only area that can play key role in TRBUSDT price,
keep close it because if market clear 113 then downside it will going towards 80 around,
but only below 113 keep close it and manage accordingly.
only area is 113 as major supporting area,
don't hold your buying's below that level..
trade wisely
good luck
Cryptolean Binancecoin BNB Update Binancecoin declined from the key resistance zone of $635-$660.
A sustained price action below $529 will push #BNB price lower to $455-$477.
A daily candle closure above the key daily resistance zone of $635-$660 is required for another bullish extension towards $716, the new ATH.
Intraday Chart
The BNBUSDT intraday chart is in the bearish territory below $548.
A re-test of the resistance zone of $463-$487 and a bullish rejection will lead to a bullish rally to $548.
A solid bullish break-out of $548 will push price higher towards $600.
A bearish break-out of $463-$487 will lead to a dip towards $407-$433 and, possibly lower.

Cryptolean Binancecoin BNB UpdateYesterday Binancecoin could not close above $529.
Today, a bullish Bitcoin Dominance put pressure on the Satoshi value of BNB and we saw an intraday pullback to $505.
A daily candle closure above $529 will increase a probability of a continuation of a bullish move up towards $586 and higher towards $600.
An inability to sustain could lead to a re-test of $505 and a dip lower to the key daily support zone at $455-$477.
Intraday Chart
The BNBUSD intraday chart is taking a pause and consolidating.
It is trading in the bullish territory through.
A re-test of the key intraday support at $507 and a bullish rejection will push #Binancecoin price towards $544.
A bullish break-out of $544 will result in a bullish rally towards $588-$620.
A bearish break-out of $507 will lead to a dip towards $472 support and, possibly lower, to $438. .
IMPORTANT: The BNBUSD chart is holding strong and consolidating in a narrow range which is totally normal after last days bullish extension.Once Satoshi price in BNBBTC chart will find a support and reverse, the Dollar price in BNBUSD chart will extend higher.
Like once read.
Thank you!

BNBUSD: Can it reach $15000 during this Cycle?Binance Coin has become overbought on the 1D timeframe (RSI = 85.874, MACD = 52.260, ADX = 67.821), even the 1W RSI (85.874) is off the charts, and it is natural since it is on a hyper strong rally that is approaching its All Time High. The 1W MA50 will now support throughout the whole parabolic rally and the ramainder of the Bull Cycle, as it did in the two Cycles prior.
The peaks can be caught very effectively by the Sine Waves and the next is expected to be towards the end of 2025. Every High has been a +0.5 Fibonacci higher, the next is 2.0, so a new peak around 15000 shouldn't be considered unrealistic at all for the coin of the world's largest exchange.
## If you like our free content follow our profile to get more daily ideas. ##
## Comments and likes are greatly appreciated. ##

BNB Binance Coin Potential Retracement SoonIf you haven`t sold BNB on the triple top:
Then using the Fibonacci Retracement tool, I believe there will be a new buy opportunity in the $394 - $420 range!

BNB price is preparing for a strong growth soon ?The year 2023 was not the best for Binance and CZ, if we analyze the news background, lawsuits, fines, etc.
But everything seems to have "calmed down and stabilized"
The other day, there was another burning of BNB worth more than $600 million. Now, 154 million of the 200 million coins that were in circulation at the beginning are in circulation. Almost half of the planned amount was burned (ultimately, only 100 million BNB should remain in circulation).
It seems to us that a good "window of opportunity" is now opening up to drive the BNBUSDT price to the range of $520-540.
There you can sell a little BNB to cover the "expenses" of the past year)
_____________________
Did you like our analysis? Leave a comment, like, and follow to get more

Cryptolean Binance Coin BNB UpdateAs expected, yesterday Binance Coin had another bullish impulse and broke through the key daily resistance of $529.
A daily candle closure above $529 will increase a probability of a continuation of a bullish move up towards $586 and higher towards $600.
An inability to sustain could lead to a re-test of $477.
Intraday Chart
The BNBUSD intraday chart is bullish and the last 4-Hour candle broke through $526 resistance.
A sustained price action in the 4-Hour chart above $526 will push Binancecoin price towards $552 and higher.
A bearish break-out to $526 will lead to a dip towards $506 support that could lead to a bullish rejection.
BNB will follow BTC. A strong bearish rejection of $69,654-$73,422 in the BTCUSD daily chart will lead to the weakness of the whole Crypto market and Binance Coin won't an exception.
Like once read.
Thank you!

BNB Target got hit Mar 8th 2024The main target got hit!
We did trade it from the mid 250s at TTR, now I have exited 25% of my holdings.
Going to buy back at low to mid 300s after the halving event

BNBUSDT.1DBased on the market data provided, BNB (Binance Coin) is currently trading at 485 USDT.
In the short term (4h chart), the RSI (Relative Strength Index) is at 75.27, which is considered to be in the overbought territory. This could indicate that a correction or a slight pullback might be in the offing. The MACD (Moving Average Convergence Divergence) is at 17.5, which suggests a bullish trend. The Bollinger Bands (BB) are at 495.0, with BNB trading below the upper band, indicating less overbought conditions.
The immediate supports for BNB in the short term are at 459.0, 426.0, and 406.0 USDT, while the resistances are at 495.0, 502.0, and 518.0 USDT.
In the medium term (1d chart), the RSI is at 78.0, which also indicates overbought conditions. The MACD is at 31.6, suggesting a bullish trend. The Bollinger Bands are at 495.0, again with BNB trading below the upper band.
The medium-term supports for BNB are at 397.0, 351.0, and 336.0 USDT, whereas the resistances are at 509.0, 543.0, and 575.0 USDT.
In the long term (7d chart), the RSI is at 86.19, indicating heavily overbought conditions. The MACD is at 44.5, suggesting a strong bullish trend. The Bollinger Bands are at 495.0, with BNB trading below the upper band.
The long-term supports for BNB are at 329.0, 300.0, and 210.0 USDT, whereas the resistances are at 509.0, 614.0, and 695.0 USDT.
In conclusion, BNB appears to be in a strong uptrend, but the overbought conditions indicated by the RSI in all time frames suggest that a pullback or correction is possible. It's important to watch the support and resistance levels for potential breakout or bounce. As always, it's recommended to keep an eye on market news and use proper risk management strategies when trading.

Will BNB try to break out?So, after 693 days BNB has reached the upper resistance of this huge channel and considering the bullrun has barely begun this will breakout. Also because Binance want his coin to fly so they'll deploy liquidity! And to be honest I'd be happy if they did because Binance ecosystem is really useful. The BSC is super cheap, I've been using it many times, I know it's not fully decentralized but at the end of the day I really don't care, I'm here to make profit not for the philosophy.
In case of breakout this is how I'd see this playing out (only pay attention to the trajectory, not the time):
Going back to W timeframe the RSI seems to be too much overbought but if OBV breaks out this should still fly. I wouldn't expect great ROI from BNB, it has a huge Market Cap, it'd be hard to do more than 3-4x to be honest, maybe less. In the short period, if OBV doesn't breaks out I expect a retracement!
Well that's it, I'm not trading it, I only use it to buy on the BSC. Use my TA as you like.
Good luck

C98/USDT Just HoldBINANCE:C98USDT
This idea has a medium-term profit target.
All targets are indicated on the graph.
- Risk 1% on deposit
- R/R 1/2
P.S (This is not an investment recommendation, this is my personal opinion.)

Will Binance Coin beat the Resistance line soon?30-min chart, BNB/USDT has a tendency to rebound to the Resistance line R - at around 361.5
Currently, it is trading in a a falling channel - between R and S lines.
Clear crossing and closing above 362 for 3 candlesticks will push the price to 377.8 - then extending to 389.1
Stop loss below Support line S

Bonk - New All Time High incoming?BONKUSDT finally broke the descending triangle after almost 2 months of consolidation.
The ideal would be for the price to retest and continue its upward movement, I am bullish wizards with altcoin season coming.

BNB Binance A perfect Target hit !!!This is as perfect as it gets!!!
The TTR target was hit to the penny!
I took off partial of my long-term holdings here. I will be adding at 340-320 level.
There is a potential of hitting 475+ if the price breaks out above today's high
