XMR/USDT 1D (Binance Fut.) Ascending channel facing resistanceMonero has got a nice recovery from beginning of month dump, but it seems it's running out of fuel here.
I guess a retracement is due, at least a small one but maybe down to 100EMA if we are lucky enough!
Current Price= 96.62
Sell Entry= 96.96 - 100.00
Take Profit= 93.03 | 89.07 | 83.00
Stop Loss= 102.85
Risk/Reward= 1:1.25 | 1:2.15 | 1:3.54
Expected Profit= +16.59% | +28.68% | +47.16%
Possible Loss= -13.32%
Fib. Retracement= 0.236 | 0.382 | 0.618
Margin Leverage= 3x
Estimated Gain-time= 1080h
Binancefutures

XTZ/USDT 2h (Binance Futures) Rising wedge breakdownTezos just broke out to the downside, I was planning on shorting it earlier but I preferred to wait for it.
Now the idea is to catch a pullback retesting that bearish pattern and follow the downtrend!
Current Price= 2.169
Sell Entry= 2.192 - 2.242
Take Profit= 2.132 | 2.080 | 2.008
Stop Loss= 2.302
Risk/Reward= 1:1 | 1:1.61 | 1:2.46
Expected Profit= +15.32% | +24.72% | +37.72%
Possible Loss= -15.32%
Fib. Retracement= 0.5 | 0.618 | 0.786
Margin Leverage= 4x
Estimated Gain-time= 240h

another win! Win Streak 3! W14:3LIt was a slow market, but it took us 2 days to double our money
#BTC/USD Take-Profit target 2 ✅
Profit: 111.9403% 📈
Period: 1 Days 8 Hours 58 Minutes ⏰


BTC/USDTIt can be concluded that BTC / USDT price stability is temporary, if there is a close at 10.5k , it could be possible to go to 9.3k.

MKR/USDT 6h (Binance Fut.) Descending channel facing resistanceMaker is facing parallel channel resistance again, I expect more downtrend.
Current Price= 460.33
Buy Entry= 459.80 - 472.10
Take Profit= 438.07 | 413.21 | 385.28
Stop Loss= 492.41
Risk/Reward= 1:05 | 1:1.99 | 1:3.05
Expected Profit= +17.94% | +33.96% | +51.93%
Possible Loss= -17.04%
Fib. Retracement= 0.236 | 0.382 | 0.5
Margin Leverage= 3x
Estimated Gain-time= 480h


another correct prediction!! Big win todayByBit, BitMEX
#BTC/USD All take-profit targets achieved 😎
Profit: 71.7703% 📈
Period: 1 Days 2 Hours 19 Minutes ⏰
Profit is following us around, and we like it!

Bitcoin / Tethers45-60 DIAS DE ACUMULACIÓN ALCISTA.
TARGETS 13K / 14K
TARGET SEMANAL/SWING 12.2K Y ACUMULACIÓN

ZEC/USDT 12h (Binance Fut.) Ascending channel on midline supportZcash is looking very bullish on High Time Frame (HTF) right now.
Current Price= 77.37
Buy Entry= 77.82 - 74.82
Take Profit= 86.58 | 95.61 | 113.17
Stop Loss= 69.46
Risk/Reward= 1:1.5 | 1:2.81 | 1:5.37
Expected Profit= +40.32% | +75.84% | +144.84%
Possible Loss= -26.97%
Fib. Retracement= 0.5 | 0.786 | 1.272
Margin Leverage= 3x
Estimated Gain-time= 800h

KNC on supportGood buy on support, Expecting a nice breakout of this triangel. Do we hold this support and breaking out We can easy see 3$

ATOM/USDT 1h (Binance Fut.) Parallel channel breakdownCosmos just broke the support, I'm expecting some more retracement.
Current Price= 7.792
Sell Entry= 7.749 - 8.011
Take Profit= 7.340 | 6.922 | 6.529
Stop Loss= 8.420
Risk/Reward= 1:1 | 1:1.77 | 1:2.5
Expected Profit= +27.40% | +48.64% | +68.56%
Possible Loss= -27.40%
Fib. Retracement= 0.382 | 0.5 | 0.618
Margin Leverage= 4x
Estimated Gain-time= 120h

VET/USDT 3h (Binance Futures) Descending channel breakoutVeChain is looking bullish again and I'm expecting it to keep going up.
We enter the trade just in time, now it already left Buy zone so you could wait for it to add more or enter now if you missed out.
Current Price= 0.017973
Buy Entry= 0.017800 - 0.017290
Take Profit= 0.018745 | 0.019688 | 0.021085
Stop Loss= 0.016345
Risk/Reward= 1:1 | 1:1.79 | 1:2.95
Expected Profit= +27.36% | +48.84% | +80.72%
Possible Loss= -27.36%
Fib. Retracement= 0.5 | 0.618 | 0.786
Margin Leverage= 4x
Estimated Gain-time= 240h

BTC/USDT 4h(Binance Fut) Symmetrical triangle breakdown & retestBitcoin is retesting the broken trendline and I believe it will continue down again after that pullback ended.
Current Price= 11428.77
Sell Entry= 11521.44 - 11428.22
Take Profit= 11251.45 | 11044.59 | 10818.80
Stop Loss= 11701.47
Risk/Reward= 1:1 | 1:1.92 | 1:2.92
Expected Profit= +23.52% | +45.12% | +68.76%
Possible Loss= -23.52%
Fib. Retracement= 0.618 | 1.272 | 1.618
Margin Leverage= 12x
Estimated Gain-time= 360h


SNX Synthetix long 8-9$Taking a long, its in a bullish trend and are on lower trend line. You can probebly have a stops around 5.70. Heading against 8-9$

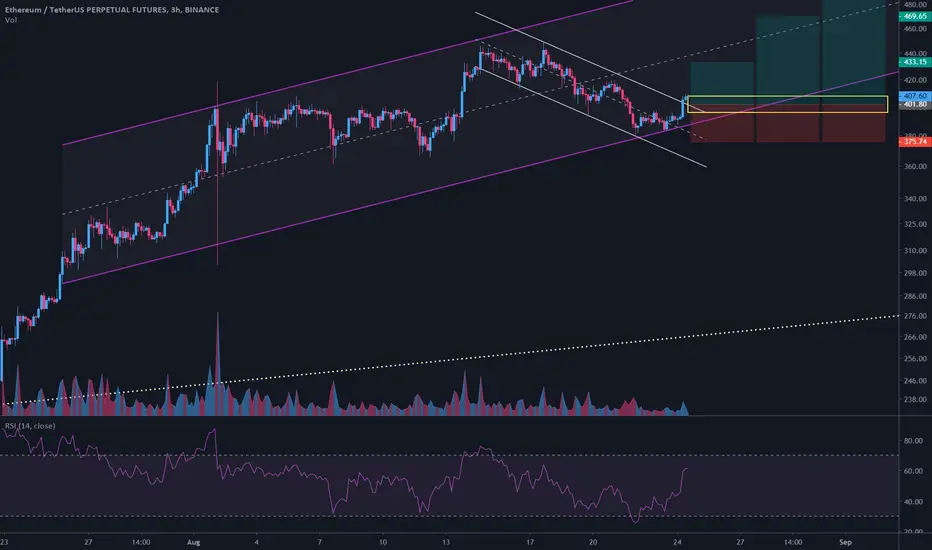
ETH/USDT 3h (Binance Fut.) Descending channel breakoutIf you keep missing out with Ethereum, you'd better do something about it!
This is another clear break-out to me and it could go for a new local high.
Current Price= 407.59
Buy Entry= 407.60 - 396.00
Take Profit= 433.15 | 469.65 | 497.47
Stop Loss= 375.74
Risk/Reward= 1:1.2 | 1:2.6 | 1:3.67
Expected Profit= +25.96% | +67.56% | +95.24%
Possible Loss= -25.96%
Fib. Retracement= 0.786 | 1.272 | 1.618
Margin Leverage= 4x
Estimated Gain-time= 240h
SWIPE ! PUMP IT CZSXP looking good against BTC
The hype is still around so we could see a good pump
Potential +25%

The price is still in the trend continuation patternOn the daily timeframe, the price moves in the trend continuation pattern. At the moment, we are at the lower border, where we can approach up. Purchases are still a priority. The situation will change only when the price goes down and is fixed under the figure.


XRP/USDT 12h (Binance Fut.) Bull-flag & parabolic curveRipple is breaking out that parallel channel and looking really bullish right now.
It should follow the trend like his little brother Stellar for a nice bull-run!
Current Price= 0.3002
Buy Entry= 0.3009 - 0.2909
Take Profit= 0.10957 | 0.12606 | 0.13926
Stop Loss= 0.08707
Risk/Reward= 1:1 | 1:2.86 | 1:4.3
Expected Profit= +24.48% | +70.40% | +105.16%
Possible Loss= -24.48%
Fib. Retracement= 0.786 | 1.272 | 1.618
Margin Leverage= 4x
Estimated Gain-time= 720h

COMP/USDT 6h: Descending channel breakout & pullbackCompound is looking bullish at last, it could be a good hedging position during Bitcoin correction.
Current Price= 143.85
Buy Entry= 144.02 - 139.00
Take Profit= 156.91 | 185.43 | 205.51
Stop Loss= 125.91
Risk/Reward= 1:1 | 1:2.85 | 1:4.16
Expected Profit= +32.64% | +92.85% | +135.48%
Possible Loss= -32.64%
Fib. Retracement= 0.382 | 0.618 | 0.786
Margin Leverage= 3x
Estimated Gain-time= 480h

XLM/USDT 16h (Binance Fut.) Ascending channel & parabolic curveStellar Lumens is on support and should resume uptrend soon, even if Bitcoin dips a bit more.
Current Price= 0.09998
Buy Entry= 0.10043 - 0.09623
Take Profit= 0.10957 | 0.12606 | 0.13926
Stop Loss= 0.08707
Risk/Reward= 1:1 | 1:2.47 | 1:3.64
Expected Profit= +34.32% | +84.63% | +124.92%
Possible Loss= -34.32%
Fib. Retracement= 0.786 | 1.272 | 1.618
Margin Leverage= 3x
Estimated Gain-time= 1008h
