Wall Street's Billion-Dollar BNB Bet Fuels ATHBNB Ignites the Altcoin Market as Wall Street Giants Place Billion-Dollar Treasury Wagers
A perfect storm of technological advancement, surging institutional adoption, and bullish market sentiment has catapulted BNB into the stratosphere, setting the entire altcoin market alight. The native token of the sprawling BNB Chain ecosystem has not only shattered its previous all-time highs but is now the subject of unprecedented attention from major Wall Street players, who are lining up to pour billions into the digital asset. This confluence of factors has analysts and investors buzzing, with predictions of a continued explosive rally that could see BNB’s value enter uncharted territory in the coming months.
The price action has been nothing short of spectacular. In a powerful surge in late July 2025, BNB systematically broke through previous resistance levels, climbing to record peaks of over $860. This rally propelled its market capitalization to soar past $115 billion, a figure that eclipses that of established global giants like Nike. The move signaled more than just a momentary spike; it represented a fundamental repricing of the asset, driven by a narrative that has shifted from one of retail speculation to one of serious, long-term institutional conviction.
At the heart of this frenzy is a seismic shift in how traditional finance views BNB. The token is rapidly transitioning from a utility asset for a cryptocurrency exchange into a strategic reserve asset for corporate treasuries, following a path previously paved by Bitcoin. This new wave of "BNB Treasury" strategies is creating a structural demand floor and signaling a maturation of the asset class that few could have predicted just a few years ago.
The Institutional Stampede: A Billion-Dollar Bet on BNB
The most significant catalyst behind BNB’s recent ascent is the dramatic and public entry of institutional capital. A series of stunning announcements have revealed a coordinated and well-capitalized effort by publicly traded companies and investment firms to acquire substantial BNB holdings for their corporate treasuries.
Leading the charge is a landmark initiative by CEA Industries Inc., a Nasdaq-listed company, in partnership with the venture capital firm 10X Capital and with the backing of YZi Labs. The group announced an audacious plan to establish the world's largest publicly listed BNB treasury company. The strategy involves an initial $500 million private placement, comprised of $400 million in cash and $100 million in crypto. However, the full scope of the ambition is staggering: through the exercise of warrants, the total capital raised for the purpose of acquiring BNB could reach an astounding $1.25 billion.
This move is not being made in a vacuum. The deal has attracted a veritable who's who of institutional and crypto-native investors, with over 140 subscribers participating. The list includes heavyweights like Pantera Capital, GSR, Arrington Capital, and Blockchain.com, indicating widespread and sophisticated belief in the long-term value proposition of the BNB ecosystem. The leadership team for this new treasury venture further underscores its institutional credibility, featuring David Namdar, a co-founder of Galaxy Digital, and Russell Read, the former Chief Investment Officer of CalPERS, one of the largest public pension funds in the United States.
The CEA Industries and 10X Capital venture is the flagship of a growing armada of institutional interest. Before this headline-grabbing announcement, other companies had already signaled their bullish stance. Windtree Therapeutics, a biotech firm, disclosed it had secured $520 million through an equity line of credit to purchase BNB for its treasury. Similarly, the Nasdaq-listed Nano Labs expanded its own holdings to 128,000 BNB tokens, valued at over $100 million. Adding to the wave, Liminatus Pharma, another US-based biotech company, unveiled its own dedicated investment arm, the "American BNB Strategy," with the goal of deploying up to $500 million into BNB over time.
Collectively, these publicly announced plans represent more than $600 million in direct accumulation, with the potential for well over a billion dollars in buying pressure hitting the market. This institutional influx is fundamentally different from retail-driven rallies. These entities are not typically short-term traders; they are establishing long-term strategic positions. By allocating significant portions of their treasuries to BNB, they are effectively removing a large swath of the token's supply from the liquid market, creating a supply shock that can have a profound and lasting impact on price. This trend enhances BNB’s legitimacy, positioning it as a viable, institutional-grade reserve asset and providing a powerful new narrative for its continued growth. The market reaction to this news was immediate and explosive, not only for BNB but also for the companies involved. CEA Industries' stock (ticker: VAPE) skyrocketed over 600% in a single day, demonstrating the immense investor appetite for regulated, publicly-traded vehicles that offer exposure to the BNB ecosystem.
The Maxwell Upgrade: A High-Performance Engine for Growth
While the flood of institutional money has provided the high-octane fuel for BNB's rally, the engine driving its fundamental value has been meticulously upgraded. The recent "Maxwell" hard fork, implemented on the BNB Smart Chain (BSC) at the end of June 2025, represents a pivotal technological leap forward, dramatically enhancing the network's performance and scalability.
Named after the physicist James Clerk Maxwell, the upgrade was engineered to push the boundaries of blockchain efficiency. Its core achievement was the near-halving of the network's block time. Previously, BSC produced a new block approximately every 1.5 seconds; post-Maxwell, that interval has been slashed to a blistering 0.75 to 0.8 seconds. This move to sub-second block times effectively doubles the network's transaction speed and throughput.
For users, the impact is tangible and immediate. Transactions are confirmed faster, decentralized applications (dApps) feel more responsive, and the overall user experience is significantly smoother. Whether trading on a decentralized exchange (DEX), engaging with a DeFi lending protocol, or playing a blockchain-based game, the latency has been drastically reduced.
The Maxwell upgrade was not a simple tweak but a comprehensive overhaul powered by three key technical proposals:
1. BEP-524: This proposal was directly responsible for reducing the block interval, accelerating transaction confirmations and improving the responsiveness of dApps, making interactions in DeFi and GameFi feel closer to real-time.
2. BEP-563: With blocks being produced at twice the speed, the network's validators need to communicate and reach consensus much more quickly. This proposal enhanced the peer-to-peer messaging system between validators, strengthening the consensus process and reducing the risk of synchronization delays or missed blocks.
3. BEP-564: To further accelerate data synchronization across the network, this proposal introduced new message types that allow validator nodes to request and receive multiple blocks in a single, efficient message, ensuring the entire network remains stable and in sync despite the increased tempo.
The real-world impact of these technical improvements was almost immediate. In the month the Maxwell upgrade was rolled out, the 30-day decentralized exchange (DEX) volume on the BNB Chain soared to a record-breaking $166 billion. This figure surpassed the combined DEX volumes of major competitors like Ethereum and Solana, cementing BNB Chain's position as a leader in decentralized trading activity. PancakeSwap, the largest DEX on the chain, was a major beneficiary, handling the lion's share of this volume.
This surge in on-chain activity demonstrates a powerful feedback loop: technological enhancements attract more users and developers, which in turn drives up transaction volume and network utility, further increasing the value of the native BNB token. The Maxwell upgrade has solidified BNB Chain’s reputation as a high-performance, low-cost environment, making it an increasingly attractive platform for high-frequency traders, arbitrage bots, and a wide array of decentralized applications that demand both speed and reliability. The upgrade has also been credited with a significant increase in user engagement, with active addresses on the network surging 37% in the 30 days following its implementation, a growth rate that starkly outpaced competitors.
How High Can It Go? Analysts Eye $2,000 Cycle Top
With institutional floodgates opening and the network’s underlying technology firing on all cylinders, the question on every investor's mind is: how high can BNB price go? Market analysts are increasingly bullish, with many seeing the recent all-time highs as merely a stepping stone to much loftier valuations.
A price target of $1,000 is now widely considered a conservative short-to-medium-term goal. Some technical analysts, looking at the price charts, see a clear path to this milestone, potentially as early as August 2025. They point to BNB’s price action within a long-term ascending channel, with the upper trendline of this channel suggesting a target near the $1,000 mark. This level also aligns with key Fibonacci extension levels, adding technical weight to the prediction.
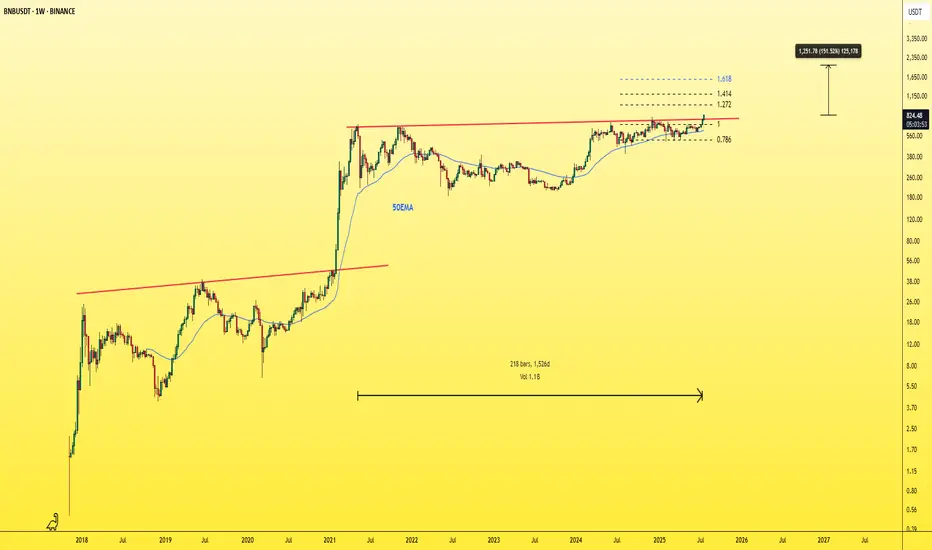
Beyond the four-figure mark, some of the most compelling forecasts come from analysts studying historical chart patterns, or "fractals." Market analyst BitBull, for instance, has drawn parallels between the current market structure and a pattern observed between 2018 and 2021. During that period, BNB’s price consolidated within a large ascending triangle pattern before breaking out and embarking on a monumental 920% rally. A similar multi-year ascending triangle has just seen a decisive breakout, suggesting history may be poised to repeat itself.
Based on this fractal analysis, BitBull projects a potential cycle top for BNB in the range of $1,800 to $2,000, which could be reached by early 2026. The analyst notes that even if the current rally only captures a fraction of the momentum seen in the previous cycle, a move past $1,000 by the end of the year seems highly plausible. A more aggressive interpretation of the ascending triangle breakout even suggests a speculative target as high as $3,900, though such a move would depend on ideal market conditions.
The derivatives market is also flashing bullish signals, reinforcing the positive sentiment. Open interest in BNB futures contracts—the total value of all active positions—has surged to an all-time high of over $1.7 billion. This indicates that a growing amount of capital is being deployed to bet on the future direction of BNB's price. Furthermore, funding rates have turned positive, meaning traders with long positions are willing to pay a premium to maintain their bullish bets, a sign of strong conviction in continued upward momentum.
This combination of fundamental drivers—soaring institutional demand and a supercharged network—along with bullish technical patterns and derivatives market activity, creates a powerful case for a sustained and significant appreciation in BNB's value. While the crypto market remains inherently volatile and no outcome is guaranteed, the confluence of positive factors currently surrounding BNB is undeniable. The token has set the altcoin market abuzz, not just by reaching new price peaks, but by fundamentally redefining its role in the digital asset landscape, transforming from a simple utility token into a cornerstone of Wall Street's burgeoning crypto treasury strategies. The journey into price discovery has just begun.
Binancesignals
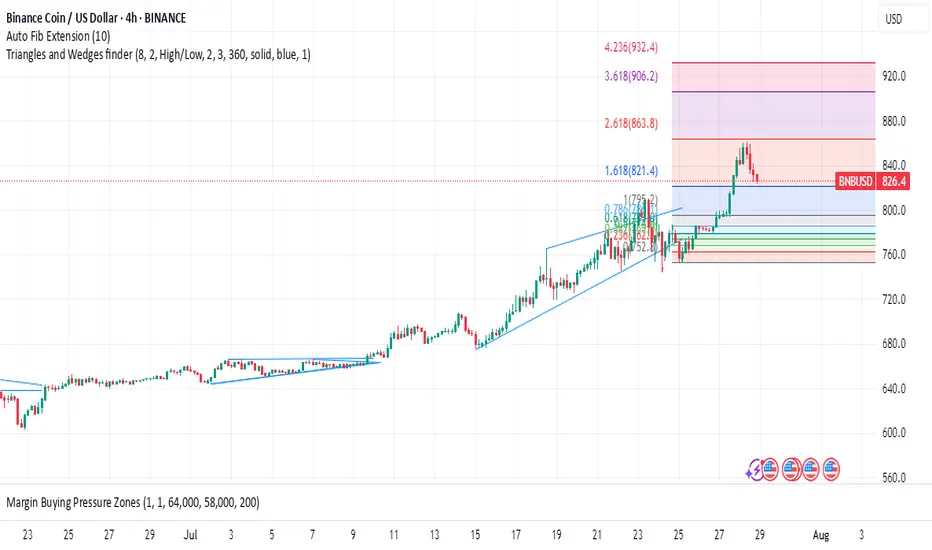
BNBUSDT - New ATH!"The strongest resistance level on the chart has just been broken — which was represented by the previous ATH — after nearly four attempts.
This exact pattern occurred before in 2021, and what followed was a parabolic rally.
The same scenario is unfolding now!
You’ll soon see BNB trading in four digit
When the crowd doubts — the smart money loads up.
Expect a parabolic rally once sentiment flips.
Best Regards:
Ceciliones🎯
#BNBUSDT: A Major Bull Move Incoming $1000 Target! Binance coin is currently in consolidation phase, with no clear direction of where it will go. We consider two possible areas where it may reverse. Both of these areas have a chance to hit $1000, which we believe the price could head towards once reversed.
If you like our idea, please like and comment!
Good luck and trade safely,
Team Setupsfx_

BNB Surge Incoming? Why Traders Are Watching $674On the 4H timeframe, BNBUSDT is showing a clear bullish structure with a consistent sequence of higher highs and higher lows since the low formed around June 23. Price action has gradually climbed, forming a well-respected ascending support base. This bullish momentum is further supported by the trend indicator (likely a custom moving average or Supertrend) that has shifted from red to blue and remained supportive of upside movement since late June. The recent consolidation just above the 651–652 support zone suggests that bulls are absorbing selling pressure before potentially pushing higher 📈.
What stands out is how price has broken above previous resistance near 659 and is now hovering near it, turning it into support. This is a textbook break-and-retest pattern, which adds to the bullish case. Buyers seem to be stepping in with confidence around this level.
Key levels are well-marked:
• Support Zone / SL Region: 651.18 – This area has been tested multiple times, making it a strong support and a good level to define risk.
• Resistance 1 / TP1: 674.03 – This is the next target zone, aligned with prior swing highs.
• Resistance 2 / TP2: 687.89 – A more ambitious target in line with broader continuation if momentum holds.
🔐 The current price at 662.07 shows signs of consolidation right above the support-turn-resistance level of 659.03. If the bulls defend this level successfully, continuation toward higher targets is likely.
Trade Setup Summary 🧾
• Entry: Around 662.07 (current market level, post breakout consolidation).
• Stop Loss: Just below the support zone at 651.18, giving enough breathing room while keeping risk controlled.
• Take Profit 1 (TP1): 674.03, a logical level of prior resistance.
• Take Profit 2 (TP2): 687.89, extended resistance zone from previous price action.
• Risk/Reward Ratio: Roughly 1:2.25, offering favorable reward compared to risk.
✅ Why This Trade Setup Makes Sense:
• Break-and-retest confirmation around 659 adds reliability 🔄
• Trend indicator is supportive of bullish momentum 📈
• Risk is clearly defined just below a major support zone 🛡️
• Room for upside toward TP2 offers good potential for reward 💰
Unless price breaks down below 651 with heavy volume, the technical structure remains bullish. If it dips to the support zone again, it might offer a second chance entry opportunity before heading to targets.

BNBUSDT Analysis: Potential Trap at a Regular Support LevelThere is a very regular support level on BNBUSDT, which appears too consistent to be trusted. This kind of setup often acts as a trap for buyers , enticing entries before breaking down.
I plan to go long if the support is broken and price reaches my blue box zone for an optimal entry. This zone represents a strong area of interest where I anticipate a reversal back upward.
Key Points:
Regular support: Likely a trap, avoid premature entries.
Blue box: My buy zone for a potential long position after the support break.
Strategy: Wait for confirmation and enter cautiously within the blue box.
If you think this analysis helps you, please don't forget to boost and comment on this. These motivate me to share more insights with you!
I keep my charts clean and simple because I believe clarity leads to better decisions.
My approach is built on years of experience and a solid track record. I don’t claim to know it all, but I’m confident in my ability to spot high-probability setups.
My Previous Analysis
🐶 DOGEUSDT.P: Next Move
🎨 RENDERUSDT.P: Opportunity of the Month
💎 ETHUSDT.P: Where to Retrace
🟢 BNBUSDT.P: Potential Surge
📊 BTC Dominance: Reaction Zone
🌊 WAVESUSDT.P: Demand Zone Potential
🟣 UNIUSDT.P: Long-Term Trade
🔵 XRPUSDT.P: Entry Zones
🔗 LINKUSDT.P: Follow The River
📈 BTCUSDT.P: Two Key Demand Zones
🟩 POLUSDT: Bullish Momentum
🌟 PENDLEUSDT.P: Where Opportunity Meets Precision
🔥 BTCUSDT.P: Liquidation of Highly Leveraged Longs
🌊 SOLUSDT.P: SOL's Dip - Your Opportunity
🐸 1000PEPEUSDT.P: Prime Bounce Zone Unlocked
🚀 ETHUSDT.P: Set to Explode - Don't Miss This Game Changer
🤖 IQUSDT: Smart Plan
⚡️ PONDUSDT: A Trade Not Taken Is Better Than a Losing One
💼 STMXUSDT: 2 Buying Areas
🐢 TURBOUSDT: Buy Zones and Buyer Presence
🌍 ICPUSDT.P: Massive Upside Potential | Check the Trade Update For Seeing Results
🟠 IDEXUSDT: Spot Buy Area | %26 Profit if You Trade with MSB
📌 USUALUSDT: Buyers Are Active + %70 Profit in Total

Breaking: $SIGN Coin Surge Nearly 40% Amidst Binance Listing The price of SIX:SIGN coin saw a 40% uptick today amidst Binance and numerous CEX listings.
Sign Protocol ( SIX:SIGN ) is an omni-chain attestation protocol that powers digital public infrastructure for governments and functions as a foundational layer for decentralized apps. 2) TokenTable: A smart contract-based platform for token distribution, including airdrops, vesting, and unlocks.
As of the time of writing, SIX:SIGN is up 24% according to the 15 minutes price chart SIX:SIGN has formed a bullish pennant pattern and a breakout above the ceiling of the wedge could resort to another legged-up for SIX:SIGN coin.
Further attesting to the bullish thesis is the RSI at 46, hinting at a build up momentum below the falling wedge that could spark the bullish breakout.
Sign Price Data
The Sign price today is $0.103050 USD with a 24-hour trading volume of $963,726,950 USD. Sign is up 37.58% in the last 24 hours. The current CoinMarketCap ranking is #307, with a market cap of $123,659,605 USD. It has a circulating supply of 1,200,000,000 SIGN coins and a max. supply of 10,000,000,000 SIGN coins.

Particle Network Set For Bullish Surge Amidst Bullish Flag Particle Network the Layer-1 blockchain powering chain abstraction, seamlessly unifying users and liquidity across Web3's native token ($PARTI) is set for a bullish breakout amidst a bullish flag pattern depicted on the 15-minute time chart.
The token got listed on major exchanges like Binance, Bybit, OKX, Bitget, GateIo and MEXC. Currently siting on a market cap of $80.89 million $PARTI is well poised for a bullish comeback.
The asset is currently up 8% as of the time of writing with the Relative Strength Index (RSI) at 60, this further validates the bullish thesis on $PARTI coin.
By unifying all chains, Particle will enable billions of users to seamlessly onboard and interact with dApps across every chain, serving as the foundation for mass adoption and playing an indispensable role in unifying the Open Web.
Particle Network Price Live Data
The live Particle Network price today is $0.338798 USD with a 24-hour trading volume of $530,561,230 USD. Particle Network is down 1.99% in the last 24 hours, with a live market cap of $78,939,915 USD. It has a circulating supply of 233,000,000 PARTI coins and a max. supply of 1,000,000,000 PARTI coins.

$BTC FINALLY BULL RALLY ON CHART NOW & 2nd TAKE PROFIT DONEJUST IN NEWS : BTC Bear Market To Last 90 Days, Analyst Predicts, as Trade War Fears and Whale Activity Impact Prices
Bitcoin has entered a bear market, with its price dropping over 20% from its all-time high. Market analyst Timothy Peterson expects the downturn to last 90 days, arguing that this decline is weaker than most past bear markets. He noted that out of the 10 previous downturns, only four—2018, 2021, 2022, and 2024—have been worse in terms of duration. Peterson does not see BTC sinking far below $50,000 but says a slide in the next 30 days could be followed by a 20-40% rally after April 15. He believes this could trigger renewed buying interest and push Bitcoin higher.
Investor sentiment has been affected by global trade war concerns following tariffs imposed by U.S. President Donald Trump and retaliatory measures from multiple trading partners. The uncertainty has led to a decline in speculative investments. The Glassnode Hot Supply metric, which tracks BTC held for a week or less, has fallen from 5.9% in November 2024 to 2.3% by March 20, signaling reduced short-term trading activity. A CryptoQuant report also suggests that most retail investors are already in the market, countering expectations that a surge of new traders would drive prices up.
Ether has also struggled, losing over 51% in three months since peaking above $4,100 on December 16, 2024. Analysts say ETH must reclaim the $2,200 range to gain upward momentum. “If price can generate a strong enough reaction here, then #ETH will be able to reclaim the $2,196-$3,900 Macro Range (black),” wrote crypto analyst Rekt Capital in a March 19 X post. Despite positive regulatory developments, such as the U.S. Securities and Exchange Commission dropping its lawsuit against Ripple, ETH has yet to see significant gains.
Market uncertainty remains high, with some analysts expecting economic pressures to last until at least April 2025. Despite short-term volatility, long-term projections remain optimistic. VanEck has predicted a $6,000 cycle top for ETH and a $180,000 peak for BTC in 2025.
Disclaimer: This article is for informational purposes only and does not constitute financial advice. Always conduct your own research before making any investment decisions.

$BTC Price Showing Head and Shoulder Pattern On Chart, CPI DATACRYPTOCAP:BTC Price Showing Head and Shoulder Pattern On Chart, CPI DATA, $95K Soon as Possible?
Bitcoin high-entry buyers are driving sell pressure, price may ‘floor’ at $70K
Bitcoin's “top buyers” are selling heavily, with onchain analytics firm Glassnode calling it a “moderate capitulation event.”
Bitcoin buyers who purchased around when it hit a $109,000 all-time peak in January are now panic-selling as the cryptocurrency declines, says onchain analytics firm Glassnode, which isn’t ruling out that Bitcoin could slide to $70,000.
Glassnode said in a March 11 markets report that a recent sell-off by top buyers has driven “intense loss realization and a moderate capitulation event.”
Short-term holders fled as Bitcoin dropped from peak
The surge in buyers paying higher prices for Bitcoin
BTC $82,482 in recent months is reflected in the short-term holder realized price — the average purchase price for those holding Bitcoin for less than 155 days.
In October, the short-term realized price was $62,000. At the time of publication, it’s $91,362 — up about 47% in five months, according to Bitbo data.
Meanwhile, Bitcoin is trading at $81,930 at the time of publication, according to CoinMarketCap. This leaves the average short-term holder with an unrealized loss of roughly 10.6%.
Related: Bitcoin slides another 3% — Is BTC price headed for $69K next?
On the same day, BitMEX co-founder Arthur Hayes said that Bitcoin may retest the $78,000 price level and, if that fails, may head to $75,000 next.
Glassnode explained that a similar sell-off Bitcoin pattern was seen in August when Bitcoin fell from $68,000 to around $49,000 amid fears of a recession, poor employment data in the United States, and sluggish growth among leading tech stocks.
#BTC☀ #BinanceAlphaAlert #BinanceSquareFamily #Write2Earn #SUBROOFFICIAL
Disclaimer: This article is for informational purposes only and does not constitute financial advice. Always conduct your own research before making any investment decisions.

#BTCUSD 1DAYBTCUSD (1D Timeframe) Analysis
Market Structure:
The price is approaching a key support level, which has previously acted as a strong zone for price reversals. This level is crucial for determining the next directional move.
Forecast:
It is advisable to wait for the price to reach the identified support level. If the market shows signs of a bullish reversal, such as bullish candlestick patterns or strong buying pressure, a buy opportunity may be considered.
Key Levels to Watch:
- Entry Zone: Monitor the price action near the support level and consider buying if there is confirmation of a bounce.
- Risk Management:
- Stop Loss: Placed below the support zone to manage risk in case of a breakdown.
- Take Profit: Target the next resistance levels for potential upside gains.
Market Sentiment:
Market sentiment will be confirmed upon testing the support level. A strong bounce would indicate bullish interest, while a breakdown may signal further downside. Waiting for confirmation will help in making a more informed decision.

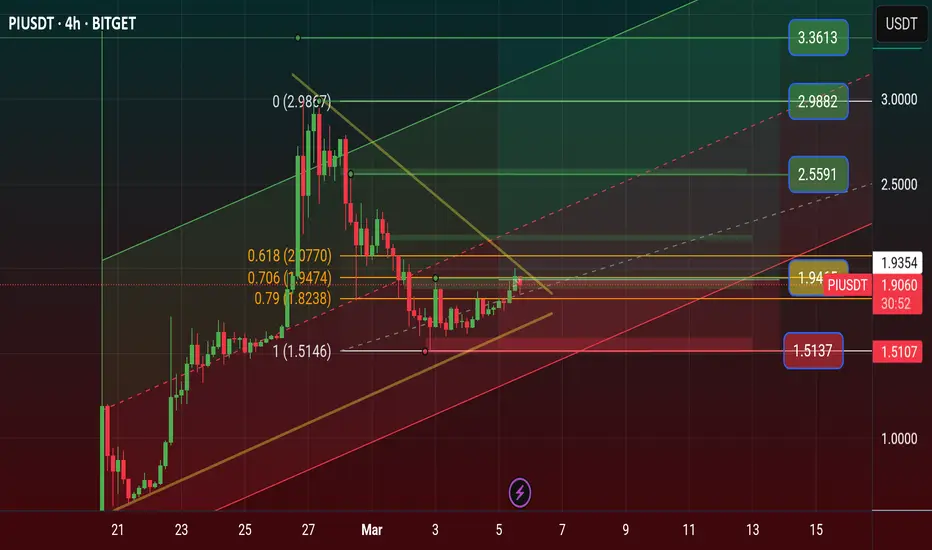
$PIUSDT Price Road to $11 Price Prediction 2025 Pi Network News: Can Pi Coin Price Hit $11? Key Levels Revealed, Pi Already Get place 11 of the Market.
Pi Network has gained 6.8% in the past 24 hours, outperforming major cryptocurrencies like Bitcoin (+7.5%), Ethereum (+8.9%), XRP (+11.1%), BNB (+9.8%), and Solana (+7.8%). But that’s not the real surprise.
Since its mainnet launch, PI's price has skyrocketed by an incredible 1,775.77%, while the overall crypto market has dropped by 11% in the same period. That’s a staggering contrast - and a sign that something big is happening.
With PI breaking key resistance levels and speculation about a major exchange listing growing, investors are wondering: How much higher can PI go? Could we see a breakout past $2? Let’s dive in.
💗 Why Is PI’s Price Rising?
Since February 20, PI has gained an incredible 1,775.75%, with a 7.5% jump in just the last 24 hours. This steady rise shows that Pi Network is moving independently of the broader market, maintaining strong momentum.
Key Reasons Behind PI’s Price Rally
Several factors are driving PI’s price increase:
Mainnet Migration Deadline Approaching
Pi Network is reaching its final deadline for users to migrate their holdings. According to a recent blog post from the team, March 17 is the last day to complete the migration. This deadline may be increasing buying pressure as investors prepare for the next phase.
🧡 Potential Binance Listing
Speculation around a Binance listing is another major factor. In a recent Binance community poll, over two-thirds of participants supported listing PI. If Binance or other major exchanges list it, the price could see a significant boost.
US Election Impact on Crypto
Donald Trump’s return to office is bringing a more crypto-friendly stance from the US government, which could benefit projects like Pi Network.
💝 Can PI Break $2.2?
Experts believe that if PI moves past the $2.2 resistance level with strong volume, it could rally toward $11. However, if it fails to break through, selling pressure could push it down to $1.5 Stoploss price area
To maintain its bullish trend, PI needs to hold support above $1.7. The price is currently just 1.11% below the key $2.2 level, making the next few days crucial in determining its next move.
🩷 Never Miss a Beat in the Crypto World!
Stay ahead with breaking news, expert analysis, and real-time updates on the latest trends in Bitcoin, altcoins, DeFi, NFTs, and more.
Pi Network has defied market trends and harsh criticism before, and if history is any guide, this rally might just be getting started.
🩵 Why Is Pi Coin’s Price Rising?
Pi Coin’s price is rising due to increasing exchange interest, migration deadlines, and strong community support, pushing demand higher.
💜 Nano History Will Pi Coin Reach $11?
If Pi breaks the $2 resistance with strong volume, experts predict a rally toward $11. Failure could lead to a drop below $1.5
💛 Is Binance Listing Pi Coin?
Binance has not officially listed Pi yet, but a recent community poll shows strong support, increasing the chances of a future listing.
Whats next after the Bitcoin correction In this video I Breakdown a couple of potential Targets for longs .

$ETH Price LONG setup 2025 | 4H | ETHUSDTSee or Chart, From Recently News - Ethereum eyes $3000 resistance level – why investors are accumulating this presale gem
Ethereum Price Confirms Bullish Reversal
After facing increased volatility due to broader market trends, Ethereum's price has broken a critical resistance level around the $2,727-$2,730 range. The large-cap altcoin might retest this zone, confirming it as the new support before its next leg up. Notably, Ethereum's price has been consolidating near recent highs and has formed a potential bullish continuation pattern. If the altcoin’s retest holds, the price of ETH could surge towards $2,769 and beyond.
The price has rebounded off a crucial support level at $2,503, which aligns with previous demand zones. Its relative strength index (RSI) reading on the daily time frame has been hovering around the neutral zone, neither overbought nor oversold, indicating room for movement in either direction. The next significant test of the ETH coin could be reclaiming the $3,349 level, which might signal bullish momentum returning.
A confirmed close above $3,349 could trigger a rally toward higher values. However, if the price of Ethereum fails to hold above the $2,700 level, it could set the stage for a deeper correction, pulling back the price towards the $2,503 and $2,125 support levels. Ethereum’s RSI on the 1-hour chart suggests mild bullish divergence, hinting at a potential upside, but confirmation is needed through increased volume and sustained price movement above $2,881.
Disclaimer: This article is for informational purposes only and does not constitute financial advice. Always conduct your own research before making any investment decisions. Digital asset prices are subject to high market risk and price volatility. The value of your investment may go down or up, and you may not get back the amount invested. You should only invest in products you are familiar with and where you understand the risks. You should carefully consider your investment experience, financial situation, investment objectives and risk tolerance any investment.

BNB’s Correction Could Trigger a Major Move—Are You Ready ?Yello Paradisers! Have you been keeping an eye on #BNBUSDT? If not, now’s the time to focus. BNB is currently in a corrective phase after its recent surge, and this pullback could be setting up a major opportunity for those who know when to strike. But timing is everything, and jumping in too early could be a costly mistake.
💎Right now, we expect BNB to follow a flat zigzag correction pattern of Elliott Wave. The price action shows signs of an imbalance (IMB) and a change of character (CHOCH), suggesting that we might see a further dip before the bulls take over again. You can switch to lower timeframes, like the 15-minute chart, to get a clearer validation of the wave structure. The key here is to wait for a bullish divergence on the RSI and MACD, which will signal that the correction is nearing its end and a rebound is likely.
💎The bullish order block (OB) between $582 -$577 is the crucial demand zone to watch. We anticipate BNB dipping into this zone before finding strong support for a potential upward impulsive wave. However, if BNB closes below this order block, the setup becomes invalid, and we could see further downside toward $560. It’s essential to remain patient and disciplined rushing in without confirmation could lead to unnecessary losses.
💎Once we get the bullish divergence, we expect BNB to target the $643-$646 supply zone in the next move. This could be a sharp and profitable rally for those who wait for the right signals. But remember, if the price closes below the bullish OB, it’s time to step back and reassess. Protecting your capital is just as important as making profits.
Be patient, stay focused, and let the market come to you. That’s how you secure long-term success in this game.
MyCryptoParadise
iFeel the success🌴

#BTCUSD 4HBTCUSD (4H Timeframe) Analysis
Market Structure:
Resistance Zone: The price is currently testing a key resistance area, showing signs of selling pressure.
Bearish Engulfing Area: A bearish engulfing candlestick pattern has formed near the resistance level, indicating potential downside movement.
Forecast:
Sell Opportunity: The presence of a bearish engulfing pattern at resistance suggests a possible rejection, signaling a short-term sell setup.
Key Levels to Watch:
Entry Zone: Near the resistance area after bearish confirmation.
Risk Management:
Stop Loss: Above the resistance zone or the high of the bearish engulfing candle to limit risk.
Take Profit Zones: Target the nearest support levels or Fibonacci retracement areas for downside targets.
Market Sentiment:
Bearish Bias: Selling pressure at resistance highlights a potential reversal, favoring short positions as long as the price stays below the resistance zone.

BinanceUSDT Finds Footing: New ATH on the Horizon?BinanceUSDT is finding strong support at the trendline and the 100 EMA, acting as dynamic support.
The price shows strong potential to break the nearest resistance and aim for a new ATH.
Monitor it closely for upcoming moves, and don’t forget to follow us for more updates.

#BTCUSD 4H#BTCUSDBTCUSD (4H Timeframe) Analysis
Market Structure:
Trendline Support Breakdown: The price has broken below a previously established trendline support, indicating a potential shift in market sentiment from bullish to bearish.
Forecast:
Sell Opportunity: The breakdown below trendline support suggests that bearish momentum may take over, and further downside movement is likely.
Key Levels to Watch:
Entry Zone: After the trendline breakdown, wait for confirmation of continued selling momentum or a retest of the broken trendline as resistance.
Risk Management:
Stop Loss: Above the broken trendline or recent swing high to limit risk.
Take Profit Zones: Focus on next support levels or Fibonacci projections for potential downside targets.
Market Sentiment:
Bearish Outlook: A trendline support breakdown typically signals that the buyers have lost control, and further downward movement is expected if the price remains below the broken trendline.

#ETHUSD 4HETHUSD (4H Timeframe) Analysis
Market Structure:
Double Top Pattern: A classic reversal pattern has formed, with the price testing a key resistance level twice and failing to break higher, signaling potential bearish pressure.
Forecast:
Sell Opportunity: The formation of the double top suggests a possible reversal, with a move to the downside expected once the price confirms a break below the neckline.
Key Levels to Watch:
Entry Zone: Upon the break below the neckline of the double top pattern or after a retest of the neckline as resistance.
- **Risk Management:**
- **Stop Loss:** Placed above the recent high or the top of the double top pattern to manage risk.
Take Profit Zones: Target the next support levels or Fibonacci retracement zones for potential downside movement.
Market Sentiment:
Bearish Bias: A double top typically signals a reversal from an uptrend to a downtrend, with increased selling pressure expected once the neckline is broken.

Apt/UsdtBINANCE:APTUSDT
**Aptos (APT) Current Price: $10.62 💰**
- The current price of **Aptos (APT)** is at **$10.62**, which is a key **support level** for the price. This means that if the price holds around this level 📊, it could potentially prevent it from dropping further. Support levels act like a "floor" for the price, where demand (buyers) is strong enough to keep the price from falling.
---
**If Price Holds at $10.62 🛑, Resistance Levels Ahead:**
- **Resistance at $12 🚀**: The first major resistance level is around **$12**. This is a price point where there might be enough selling pressure (sellers) to slow down or stop the price from rising further. Think of it like a "ceiling" where the price could hit and struggle to break above.
- **Resistance at $13 🌟**: If the price breaks through $12, the next resistance is at **$13**. This is another level where the price may face increased selling pressure, making it harder for the price to go higher. However, if it breaks this resistance, it could signal further bullish momentum (more upward movement).
- **Resistance at $13.52 💥**: The final resistance level is around **$13.52**, which is likely the strongest point where the price could face significant resistance. If the price reaches this point and struggles to break through, it could signify a potential reversal or consolidation in price.
---
**Summary:**
- **Support at $10.62** 🔻: If the price holds this level, it might bounce back up.
- **Resistance Levels at $12, $13, $13.52** 🚀🌟💥: These are the points where price could face difficulty moving higher. If the price breaks through these, it could continue to rise.
---
**Not Financial Advice!** 🚨 Always remember to do your own research, as market prices can be volatile! 📈📉

BNB Near $719: Breakout to $820 or Drop to $630?Binance Coin (BNB) is currently consolidating at the top of the range zone, near the $719.63 resistance level, setting the stage for a decisive move. As long as price is trading below this level, the momentum will be slow.
A successful breakout above $719.63 would confirm bullish sentiment, paving the way for a potential rally toward the next resistance level at $771.67. Such a move would signify strengthening momentum, encouraging further buyer participation (Solid Green Projection).
Conversely, if the price fails to clear $719.63 and faces rejection, a pullback to $682.62 would be the first critical test for support. However, this is the slow zone for BNB.
Losing $682.62 may signal a shift in control toward sellers, opening the door for a decline toward $630.57 (Red Projection).

#BNB 1H. Good resistance zoneAt the moment, the asset is in accumulation (sideways movement), where the price reacts to the support level each time. I expect a similar movement this time as well.
Locally, #BNB looks set to continue its growth, just like other altcoins, so personally, I continue to work from the buy side. I’ve illustrated the setup on the chart.

FTMUSDT: Bearish Head and Shoulders PatternFTMUSDT Technical analsysis update
BINANCE:FTMUSDT has formed a bearish head and shoulders pattern on the daily chart, with price moving the support level below. If a breakdown is confirmed on the daily chart, we could expect a potential drop of 20%-60% in FTM. Additionally, the price has fallen below the 100 EMA, adding further confirmation of a bearish trend.
Short level: Above $0.58
Stop loss : $0.675
Target 1 : $0.530
Target 2 : $0.420
Target 3: $0.260

STRKUSDT - interesting coin!One of the new and interesting coins in Binance
It was analyzed on the 3-day chart
It seems to me that it has already formed the bottom and is preparing to rise
Try to make the new coins a share of your portfolio
targets are shown on the chart
Best regards Ceciliones🎯
