ARUSDT Ready for second bullish wave!ARUSDT (Day Chart) Technical Analysis Update
AR/USDT currently trading at $70.00
Triangle formation in a day chart
Buy level: Above $68.00
TP 1: $85
TP 2: $120
TP 3: $150
Stop loss: $45.50
Max Leverage: 2x or buy it on spot market
Binancesignals

BNB comes up for mid channel???as we can see BNB break its key level and confirmed price above the key level with
three bullish pin bar. that is good for its up trend.
also the price made higher high top and this is good for its up trend also.
and also BNB break its down trend and its pullback to down trend is completely done.
i think BNB can hit the mid channel in few days and after that
its depend on market situation that its can continues to the top of channel
or it will pullback on this key level again.

Binance Sniper short!Hi team
Some fundamental analysis and Fib retracement here on Binance.
As ever, crypto is very volatile, so the RR is high, and the SL is very tight.
Good luck, trade safe!

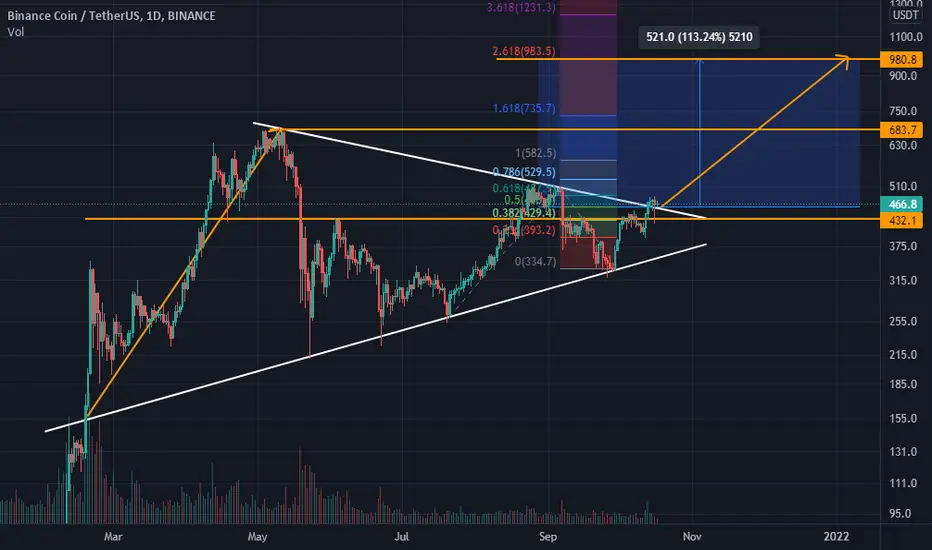
Binance coin- to challenge ATH soonIt was a very good month also for Binance coin and the new crypto enthusiasm has driven the price from 300usd to 500usd.
Now the coin is trading just under very important 500usd resistance and I expect a break to the upside that could lead to price to the old ATH and even higher.
440 is strong floor for this coin and only a break under would change my bullish opinion


ETH BOOM TO NEXT TARGET. BINANCE:ETHUSDT
Here are some points which tells that ETHEREUM is the Next BITCOIN, here come to the point straight.
Buy atleast one ETHEREUM and hold it for 3 years. Then Results will amaze you.
Good Luck
Binance's Twitter Account Mentioned.
#BinanceFutures weekly market report
🔸 #Bitcoin remains the top performer across major asset classes, beats US Equity, Gold, and Crude Oil
🔸 Multi-Assets mode now supports #BTC and #ETH
BNBUSDT breakout and targets, Oct 17This is BNB's targets after this breakout
This is the moment that I was talking about if you want to buy it.
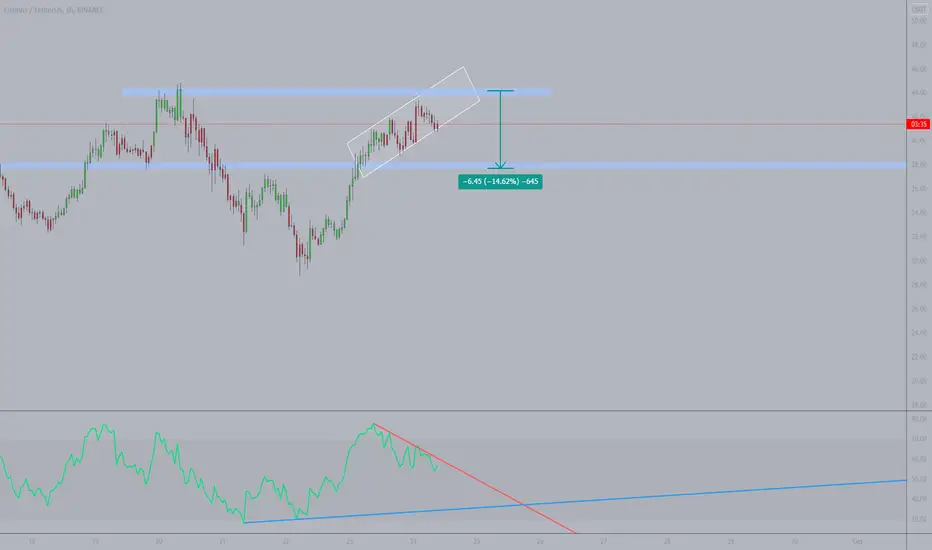
COMPUSDT Reversal EntryA break out has at the top of the descending triangle, waiting for the retest before a potential buy BINANCE:COMPUSDT

BINANCE COIN Analysis: The big triangle has been broken! In this video you can see my exact trade settings on BNB/USDT.
The triangle was broken upwards.
Now I'm waiting for the POC level to break through and enter the trade.
Please, leave a comment or like.
Thank you
@Alex_UCT

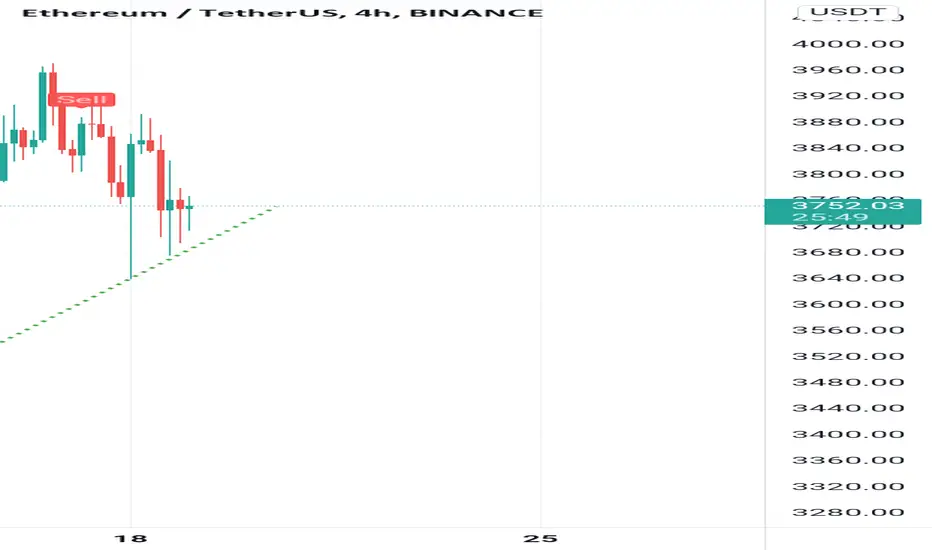
ETHEREUM CLOSE TO THE APEX FOR A BREAKOUT / BREAKDOWNETHEREUM Trading inside a symmetrical triangle,
This can of course most likely be a breakout to the upside and a continuation of the previous trend once we pull back into the area I have Highlighted on the chart .
I have marked this region because of 3 strong areas of confluence ..The POC or fixed range profile , fib pull from July Low to High , which aligns perfectly with our POC and the 50 EMA.
The pattern contains at least two lower highs and two higher lows, When these points are connected, the lines converge as they are extended and the symmetrical triangle takes shape.
The future direction of the breakout can only be determined after the break has occurred.
A break should be on a closing basis for it to be considered valid.
After the breakout (up or down), the apex can turn into future support or resistance.
The price sometimes returns to the apex or a support/resistance level around the breakout before resuming in the direction of the breakout.
Whatever trade you take ensure to use a SL and know your invalidation .
Make a plan and stick to it and always know in advance where you are wrong .
Support my work with a follow Like or a constructive comment .

BNBUSDT Trend analysis, Oct 8Hallo Leute!
This is my idea about BNB, if you want to buy it then buy it after breaking the downtrend line.

FTM / USDT -->> 4H---SHORT 🔻hey there.
guys I have described everything in the chart and made it easy as possible.
wish you all good profits.
.
.
.
support me by hitting the like button❤❤❤.


Buy XECUSDT nowbuy opportunity ready for XEC/USDT seeing the start of a new trend to the upside.. taking profit at initial resistance and fib levels BINANCE:XECUSDT

CTKUSDT Good Buy!CTKUSDT (1H CHART) Technical Analysis Update
CTK/USDT currently trading at $2.025
Buy level: Above 2.01
Stop loss: 1.935
TP 1: $2.100
TP 2: $2.17
TP 3: $2.25
TP 4 : $2.35
Always Keep Stop loss

DOGE will be the Biggest Moving Large CapOnce we break out of the resistance on the BTC Pair I expect this thing to moon in a big way.
Daily RSI is looking bullish with a breakout on the USDT Pair and Trendline Retest on the BTC Pair.
Worse case scenario would be a close below horizontal support on the BTC Pair

AVAX|USDT avax | usdt break out the trendline resistance . It's time for some small positions to buy long.
15M Chart |Buy Long, Scalping

BNB - when is the best time to buy 🤔❓❓BNB tried to break the support level and consolidate below but failed. Every drop was bought back. Pulling up to the trend line again.
This is a signal for a breakout and a rise. If price starts to squeezing to the trend line, breaks it, and tests it as support, that would be a good buying opportunity.
Write in the comments all your questions and instruments analysis of which you want to see.
Friends, push the like button, write a comment, and share with your mates - that would be the best THANK YOU.
P.S. I personally will open entry if the price will show it according to my strategy.
Always make your analysis before a trade.

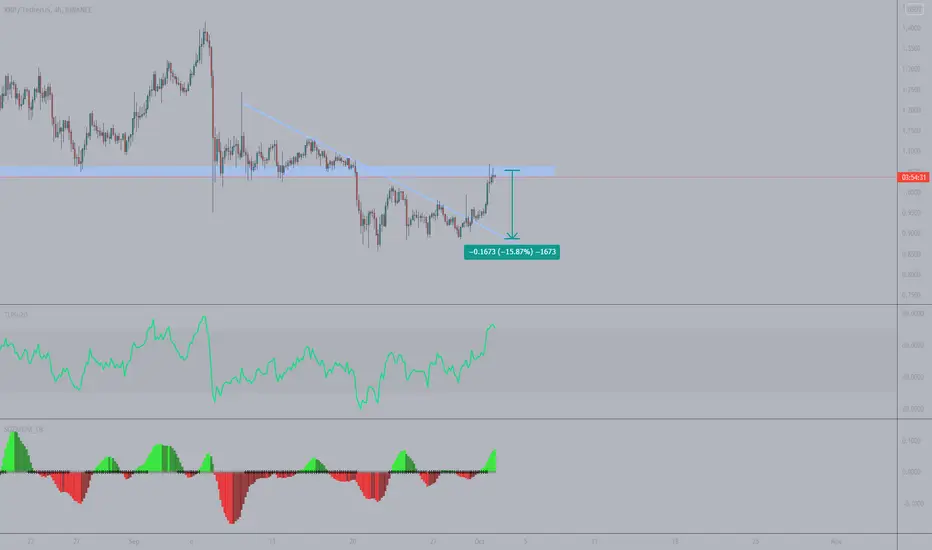
XRP Short (Hedge Trade)I'm using this as a hedge against my open longs.
XRP is clearly wicking at the top with Squeeze Momentum Slowing down.
Short: $1.04 - 1.06
Stop Loss: $1.08
#LTC, Let's keep an eye on #Litecoin!A quick look at Litecoin (#LTCUSDT, 1D, Binance):
Price is picking above the daily resistance at $179. If LTC price confirms the breakout we could open a long position with a good margin for profit.
If it does not hold, price should find support at $164 and $152.
Strategy
If the breakout holds:
TP1: $226
Alternative TP1: $199, TP2: $226
If you want to read more about Litecoin on CoinMarketCap, click here .
What do you think?
Still learning here, so any constructive feedback and positive vibes to improve my analysis are welcome.
But if you enjoy my chart, please like, comment or follow me. :)
Thank you and Happy trading!
------------------------------------------------------
Some of my charts represent actual trades, and some are just paper trading.
Needless to say, this is not financial advice!

bitcoin will rise !!!Hi traders and anvestors !
for me the bitcoin positive in the next weeks
best wishes

COTIUSDT Ready to Make New ATH!COTIUSDT (Day Chart) Technical analysis
COTI/USDT Currently trading at $0.61
New All-time High
Swing Trade Setup or medium-term investment setup
Long Entry: above $0.54 -$0.61
Stop Loss : 0.42
TP 1 : $0.75
TP 2 : $0.90
TP 3 : $1.00
TP 4: $1.25
Max leverage : 1x or buy it on spot market

ATOM's Run is About to EndShort: $44 - $45
Targeting: $38
Closing Trade on Hourly Bar Close Above $45.5
It may not get there but that's fine, let the trades come to you not the other way round