#GRT, Breaking Resistance with Potential Gains?A quick look at #TheGraph (#GRTUSDT, #Binance, D):
Price broke the 0.7592 resistance.
The 4HR timeframe shows a positive retest of that level as support.
Price may test the next resistance at 0.9547.
To read more about The Graph on CoinMarketCap, click here .
What do you think?
Still learning here, so any constructive feedback and positive vibes to improve my analysis are welcome.
Thank you and Happy trading!
------------------------------------------------------
Some of my charts represent actual trades, and some are just paper trading.
Needless to say, this is not financial advice!
Binancesignals

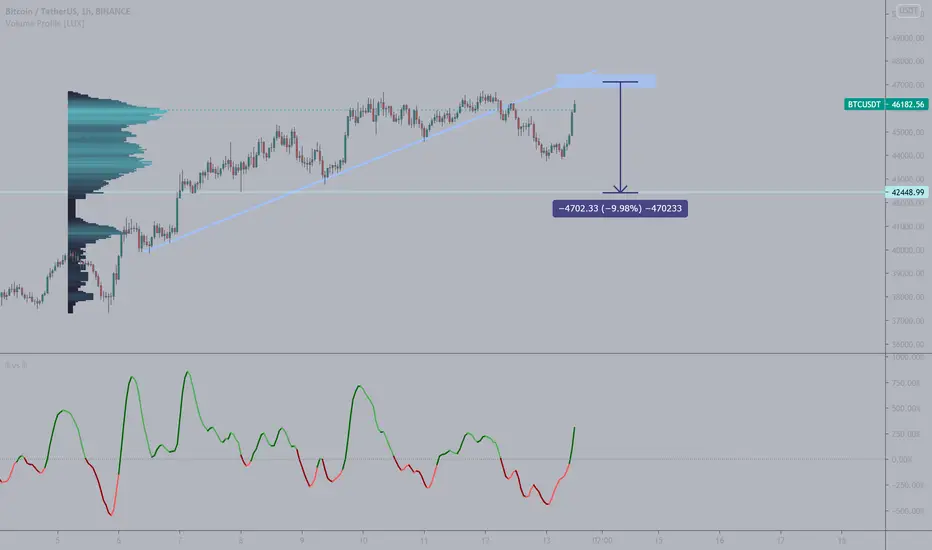
Building a Short Position on BTC (Hedge Trade)Short: $46,000 - $47,000
Target: $42,500
We are at a clear confluence point right here. IMO the move is over extended.
KEEPUSDT Channel breakout!KEEPUSDT Technical analysis Update
KEEP/USDT currently trading at $0.3745
Channel Breakout
Buy level: $0.368 - $0.376
Stop loss: $0.348
TP1: $0.3848
TP2: $0.400
TP3: $0.410
TP4: $0.430
Max Leverage 3x
Always keep Stop loss
Note: please do your own research before investing. Never invest money that you can't afford to lose.

RUNEUSDT Look Bearish!RUNEUSDT Technical analysis Update
RUNE/USDT currently trading at $7.00
Triangle Formation
Short level: Below $6.93
Stop loss: $7.38
TP1: $6.74
TP2: $6.61
TP3: $6.41
TP4: $6.10
Max Leverage 3x
Always keep Stop loss
Note: please do your own research before investing. Never invest money that you can't afford to lose.


SFPUSDT Good Buy!SFPUSDT Technical analaysis Update
SFP/USDT currently trading at $1.00
Symmetric triangle breakout
Buy level : Above $0.995 -$1.005
Stop loss: $0.9376
TP1: $1.041
TP2: $1.08
TP3: $1.12
TP$: $1.14
Max Leverage 3x
Always keep Stop loss

DENTUSDT Uptrend Continuation!DENTUSDT Technical analaysis Update
DENT/USDT currently trading at $0.00252
Bullish Flag pattern
Buy level : Above $0.00255
Stop loss: $0.00235
TP1: $0.00261
TP2: $0.00268
TP3: $0.00274
TP4: $0.00287
Max Leverage 2x
Always keep Stop loss
Note: please do your own research before investing. Never invest money that you can't afford to lose.

IOTAUSDT Perfect Bullish Flag!IOTAUSDT Technical analaysis Update
IOTA/USDT currently trading at $0.8723
Flag Pattern
Buy level: Above $0.8790
Stop loss: $0.833
TP1: $0.8969
TP2: $0.9165
TP3: $0.9523
TP4: $0.990
Max Leverage 2x
Always keep Stop loss
Note: please do your own research before investing. Never invest money that you can't afford to lose.

QTUMUSDT Symmetric TriangleQTUMUSDT Technical analysis Update
QTUM/USDT currently trading at $8.00
Symmetric triangle breakout
Buy level: $8.00 -$8.15
Stop loss: $7.80
TP1: $8.35
TP2: $8.50
TP3: $8.80
TP4: $9.40
Max Leverage 3x
Always keep Stop loss
Note: please do your own research before investing. Never invest money that you can't afford to lose.

ZENUSDT Good BUY!ZENUSDT Technical analysis Update
ZEN/USDT currently trading at $62.00
Resistance Zone Breakout
Buy level: Above $61.50 - $62.20
Stop loss: $59.00
TP1: $65.00
TP2: $68.50
TP3: $71.50
TP4: $75.00
Max Leverage 3x
Always keep Stop loss
Note: please do your own research before investing. Never invest money that you can't afford to lose.

GRTUSDT Swing Trade Setup!GRTUSDT Technical analysis Update
GRT/USDT currently trading at $0.670
Downtrend Line Breakout
Buy level: Above $0.650
Stop loss: $0.570
TP1: $0.75
TP2: $0.94
TP3: $1.11
Max Leverage 2x
Always keep Stop loss
Note: please do your own research before investing. Never invest money that you can't afford to lose.

FTMUSDT Flag Pattern!FTMUSDT Technical analaysis Update
FTM /USDT currently trading at $0.247
Flag pattern breakout
Buy level : Above $0.246
Stop loss: $0.234
TP1: $0.257
TP2: $0.265
TP3: $0.285
TP4: $0.30
Max Leverage 3x
Always keep Stop loss
Note: please do your own research before investing. Never invest money that you can't afford to lose.

Binance has broken the upward movement 😱😱For a couple of weeks, Binance has been moving in an uptrend channel.
The price broke through the important level of $326, tested as support, and rose to the level of $350. There, Binance met a very strong resistance zone and corrected towards the 320$ level.
The price has now broken down the uptrend channel and dropped below the important 326$ level. If the price comes back and tests the lower level of the channel as resistance, it could be a good selling opportunity.
Write in the comments all your questions and instruments analysis of which you want to see.
Friends, push the like button, write a comment, and share with your mates - that would be the best THANK YOU.
P.S. I personally will open entry if the price will show it according to my strategy.
Always make your analysis before a trade

#BNB Analysis#BNB Analysis🧩//
BINANCE Token looks Bearish📉 and we could see a move down to the daily support area at 261$ and we might see it bouncing over the Black resistance if the #BTC price did a small bullish retracement but either way I see a good entry at 262$ (Above the daily support) for long buyers!
-----
ISMASHPROFIT 💎

#SOLANA Analysis#SOLANA Analysis🧩//
$SOL looks Bullish either WAYS the BTC dominance is slowing it's price movement but Solana on of the best tokens out there and it's performing well in the last 11days facing our resistance level at 37.800$ after that we saw a small bearish correction and a pullback near the 32$ price level the $SOL price might face some struggles breaking the 37.800 resistance level and might close below 30$ level and go all the way down to 20$ price level which is a good entry for long term holders to get into this strong token (fundamentally).
-----
ISMASHPROFIT 💎

CardanoShare ur thoughts about this currency
When it break each line it will continue to the next one up trend

TOMOUSDT Swing Trade Setup!TOMOUSDT Technical analysis Update
TOMO /USDT currently trading at $2.73
Flag Pattern Breakout
Buy level : Above $2.71
Stop loss: $2.57
TP1: $2.83
TP2: $2.90
TP3: $2.99
TP4: $3.32
Always Keep Stop loss
Note: please do your own research before investing. Never invest money that you can't afford to lose.

NKNUSDT Resistance Zone Breakout.NKNUSDT Technical analaysis Update
NKN/USDT currently trading at $0.2550
Resistance Zone Breakout.
In the above chart, price multiple times touched resistance after continuous consolidation finally we can see the resistance zone breakout.
Buy level : Above $0.250
Stop loss: $0.209
TP1: $0.2828
TP2: $0.315
TP3: $0.345
TP4: $0.405
TP5 :$0.0.450
Note: please do your own research before investing. Never invest money that you can't afford to lose.

BNBUSDT Triangle FormationBNBUSDT Technical analysis Update
BNBUSDT currently trading at $312
Symmetric Triangle Formation
BNB 30% up from the bottom after big up move i's consolidating from four days and formatting symmetric triangle, I'm expecting BNB up trend will continue...
Buy level : Above 316.00
Stop loss: $304.00
TP1: $322.00
TP2: $332.00
TP3: $340.00
TP4: $360.00
ALWAYS KEEP STOP LOSS
Note: please do your own research before investing. Never invest money that you can't afford to lose.

UNFIUSDT Good Buy!UNFIUSDT Technical analysis Update
UNFIUSDT currently trading at $8.90
Triangle Formation
In the above chart, you can see the triangle pattern breakout from its resistance and the price two times touched below the support line. 23rd July peak (resistance) acts as a support for this triangle pattern. I'm expecting the price goes up from the support.
Buy level: Above 8.60
Stop loss: $8.010
TP1: $9.45
TP2: $9.70
TP3: $10.35
TP4: $10.95
Always Keep stop loss
Note: please do your own research before investing. Never invest money that you can't afford to lose.

Binance - a potential trade 🧨🧨A potential trade on the Binance chart. While drawing the idea, the price broke through the triangle. Before that there was a squeeze to the upper boundary of the triangle, this is a good signal before a breakout. Targets are marked above, most likely price will come there as there is a large liquidity zone.
Write in the comments all your questions and instruments analysis of which you want to see.
Friends, push the like button, write a comment, and share with your mates - that would be the best THANK YOU.
P.S. I personally will open entry if the price will show it according to my strategy.
Always make your analysis before a trade

Binance - a potential trade 🧨🧨Yesterday bitcoin was up 11%, which is quite a strong move, after which most altcoins started to rise following bitcoin.
Now on the smaller timeframes, we can see formations for a continuation of the local trend.
Just on Binance one of them appears, if bnb breaks the upper boundary of this formation and tests it, it could be a good opportunity for a local move up into the area noted above.
Write in the comments all your questions and instruments analysis of which you want to see.
Friends, push the like button, write a comment, and share with your mates - that would be the best THANK YOU.
P.S. I personally will open entry if the price will show it according to my strategy.
Always make your analysis before a trade
