BTC - Short Swing Failure Pattern I would like to see a SFP of the Given targets either the first box or the second if it happens .
We may drop from here but that is not the short i want to take .
If the SFP happens i will be taking Profits within the 55K area where i expect support to hold .
This is just a potential idea that may play out going into the weekend so its worth setting some alerts for the setup
Always know your Invalidation and follow a trading Plan
Support my Analysis with a Like and A Follow for more setups
Binancesignals

great time for buy on LINK/USDTi see nice uptrend plus up cross on MACD and as you see after price that broke up the price action it will be good oppotunity for buy, and also we have icresing in volume

BNB Break Strong Resistance!By 04/05/2021, there are three hottest cryptocurrencies, specially BNB. BNB break the resistance and make a new support yesterday for $638. The price is above moving average that is great and already hit the new support. So my target price is $713.3914, which is in harmonic price (1.618), and you have to enter now because the morning star confirmed in tf-15/tf-30. It needs 2-3 bounce to hit the target. So you decide to want to entry now or later.

BNB to $700 shortly!Binance coin has closed 4h candle today in new all time high, making first close above $600!
These are very bullish news and I can solely on this can say that BNB will move higher.
Price broke above pivot high at $613.9
RSI found support at 60 and continues to move higher meaning demand is increasing and momentum is present.
Daily MACD is about to give a buy signal today, no confirmation yet.
I don't see a reason for a change of trend.
Good luck!
PS.
Not a financial advice :)

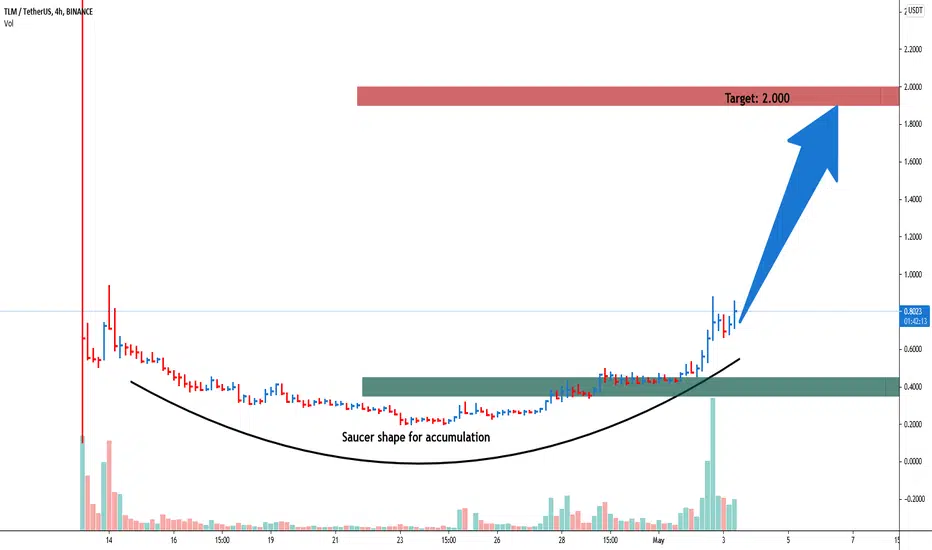
TLMUSDT is possible 2.000 ?#TLMUSD forming saucer shape to accumulate positions for bull run, take long in spot with half risk , while use remaining half if comes bit down 0.4500-0.3500 area for target 2.000
BNB, Binance Coin - I expect on growth. Look when to buy👀Price formed a nice pattern for a long position. For the last 4 days, we squeezing near to the all-time high. And I think, it will be a good entry point only after breakout and retest to the key level.
Write in the comments all your questions and instruments analysis of which you want to see.
Friends, push the like button, write a comment, and share with your mates - that would be the best THANK YOU.
P.S. I personally will open entry if the price will show it according to my strategy.
Always make your analysis before a trade

BNBUSDT Longer term bullish target 850 #bnbusdt longer term bullish. 590-565 first demand zone, 520 second demand zone. target 850.


#Alice, #MyNeighborAlice Breaking Out of the Wedge?A quick look at #MyNeighborAlice (#ALICEUSDT, #Binance, 4HR):
Price broke the upper resistance of the wedge pattern on April 28 with a solid increase in volume.
We should now wait for a confirmation.
First available support is at the $11.70 level.
If you want to read more about MyNeighborAlice on CoinMarketCap, click here .
What do you think?
Still learning here, so any constructive feedback and positive vibes to improve my analysis are welcome.
But if you enjoy my chart, please like, comment or follow me. :)
Thank you and Happy trading!
------------------------------------------------------
Some of my charts represent actual trades, and some are paper trading. Needless to say, this is not financial advice!

ENJUSDT Waiting for the breakoutENJUSDT (4H Chart) Technical Analysis Update
Waiting for the Resistance zone breakout
ENJ/USDT currently trading at $2.81
Buy-level: Above 2.90$ (only buy if 4h candle closes above 2.90$)
Stop loss: $2.47
Target 1: $3.15
Target 2: $3.27
Target 3: $3.55
Target 4: $3.85
Max Leverage: 2X
ALWAYS KEEP STOP LOSS...
Follow Our Tradingview Account for More Technical Analysis Updates, | Like, Share and Comment Your thoughts.

GRTUSDT look bullish!GRTUSDT (2H Chart) Technical Analysis Update
Resistance line breakout
GRT/USDT currently trading at $1.60
Buy-level: $1.55 - $1.60
Stop loss: $1.435
Target 1: $1.667
Target 2: $1.773
Target 3: $1.91
Target 4: $2.20
Max Leverage: 2X
ALWAYS KEEP STOP LOSS...
Follow Our Tradingview Account for More Technical Analysis Updates, | Like, Share and Comment Your thoughts.

BALUSDT Resistance Zone BreakoutBALUSDT (2H Chart) Technical Analysis Update
Symmetric Triangle Breakout
BAL/USDT currently trading at $63.80
Buy-level: $63.00 - $63.80
Stop loss: $56.20
Target 1: $66.20
Target 2: $68.80
Target 3: $72.60
Target 4: $80.00
Max Leverage: 2X
ALWAYS KEEP STOP LOSS...
Follow Our Tradingview Account for More Technical Analysis Updates, | Like, Share and Comment Your thoughts.

DENTUSDT Symmetric TriangleDENTUSDT (1H Chart) Technical Analysis Update
Symmetric Triangle Breakout
DENT/USDT currently trading at $0.01175
Buy-level: $0.01145 - $0.01175
Stop loss: $0.01080
Target 1: $0.01225
Target 2: $0.01280
Target 3: $0.01345
Target 4: $0.01485
Max Leverage: 2X
ALWAYS KEEP STOP LOSS...
Follow Our Tradingview Account for More Technical Analysis Updates, | Like, Share and Comment Your thoughts.

LONG $BNB Binance Targets are $730 to $850 Bears will get REKTAt this rate, it’s very tough to be bearish Binance.
I’m highly confident $BNB will hit the targets on this chart within a few months.
Now, as with any position or trade, practice good risk management. There’s a possibility that I’m wrong and I’m prepared to take a small loss if that’s the case.
However, bulls seem to be in control:
1. 4 hours Ichimoku Cloud is bullish. Price was supported by the cloud on three separate occasions and failed to break down below. Bullish TK cross. Bullish Lagging span. Green Cloud. Bullish.
2. we seem to be painting a semi-Adam & Eve type structure. These structures when confirmed at the top by a breakout have a 69% success rate and climb on average 43% in the target direction or at least a 1/1 move.
3. The overall market seems to be bullish alongside bitcoin. BTC dominance is dropping and ETH/BTC chart also paints new highs. Alts are in control.
4. The VPVR (Visible Range on the right) has painted MASSIVE support below current price and it’s unlikely we will break below this volume.
5. Price broke out above previous highs and new 4 hr candles have formed and supported above $596
Hard not to be bullish. however it is possible price breaks back down from here to stop-out any last longs.
I remain a Buyer from price ranges of 560 - 580.
My first targets will be $745 and $835 Respectively.
Also, it’s possible we see some large wicks in either direction at $745 range.
We may not even reach $835+ which I have denoted in different color lines. practice caution if you enter at that red line above or near my first target because the Risk to Reward is greater.
If you’re trading contracts or futures, be sure to set your stops and manage positions.
If you’re buying spot, now is a good time to add to your portfolio.

#BNB is moving according to plan#BNB Binance token has swept past the last ATH and firmly moving towards our target at $700.
I would be cautious to enter now, but with such high anticipation for May Bull run price discovery to $800+ is very likely as more and more traders will be pilling into Binance.
Hope you enjoyed the previous analysis and grabbed yourself a bag, please leave a comment or like if you agree to our $700 target.

BCH analysisif BCh manages to break 1st resistance at $950 then price may reach $1,012. but there is possibility of BCH breaking the EMA20 at $815 which then may drop to MA at $661.

DOT is dropping A break below the $26.50 support will complete a large head-and-shoulders pattern, which could signal the start of a deeper correction.

BNB Sell the downtrend.BNBUSDT - Intraday - We look to Sell at 584.8 (stop at 608.2)
The trend of lower highs is located at 585.
Early optimism is likely to lead to gains although extended attempts higher are expected to fail.
We look for a temporary move higher.
Trend line support is located at 510.
Our profit targets will be 515.7 and 485.7
Resistance: 580.0 / 600.0 / 614.0
Support: 550.0 / 530.0 / 500.0

RSRUSDT trend character and fib levels can prove the sell trendStop loss can be placed above the 78 % and can be ecpected till the tp 1 after 0 % 1:2.55 ratio good price action I am expecting
Safe trades
Good luck

#BNB is not stopping#BNB token has been a well balanced token that pushed way beyond projections in the month of April and is looking to continue gains.
BNB price action is still above its main trendline and now has broke out of a consolidation channel. Our entries will be at $570-$580 range and on target to $700 as we recover this bull run.


$BNB Bullish Wedge | Next Wave Inbound BNB has surprised many and I believe it will continue. Let's keep this one simple, enjoy the loot
DCJ
