CTSI breakout-retest of key-area // Continuation soon?$CTSI has been moving quite a lot lately and has been making strong moves in the market.
It started with a simple higher timeframe falling wedge, which we once mentioned a few weeks ago. It started breaking out and moving to the upside quickly. It is most important to state that this move led the market and not just caused by the upwards moving market. This clearly indicates a strong potential base of buyers and investors interested in this asset's low prices.
After breaking above the key-area of resistance, it went for a small consolidation period and made its final push to the next key-level above, which was the final stop for this successful swing.
Currently, CTSI has retraced back into the broken key-area of resistance and is consolidating there. Should a strong move to the upside happen soon, it will take a successful S/R flip, enabling the next higher swing for it.
Looking at technical indicators such as the MKAST Algorithm, one can clearly identify a bearish condition, which has been going on for quite a while now. It is fully understandable since there were no strong breakouts or impulsive moves to the upside after the rejection. Nevertheless, it could be switching to a bullish condition very soon again.
The MKAST Index is surprisingly low and at 0/15 points, which is marking a clearly oversold condition. Such a strong indication of the Index at a key-area, which is about to be turned into support, is absolutely the best scenario this asset could have. The downside seems very limited, and the upside practically unlimited.
A D1 close below 0.03550 would invalidate the bullish bias.
Binancesignals

Rose Coin Breakout Setupprice at resistance
price must close above 240 ( red zone ) after that add your entry around 235 - 240 stop below 200 satoshi

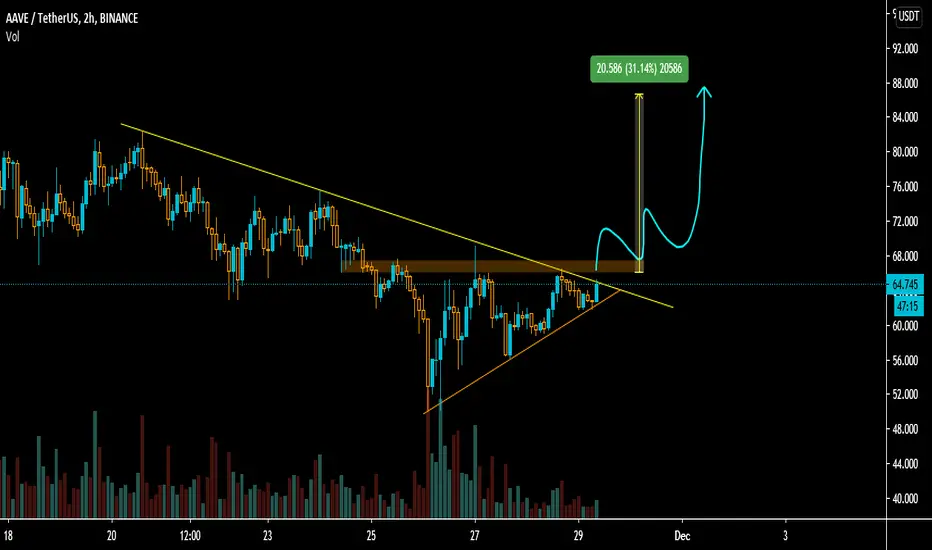
AAVE (AAVEBTC) price at resistancewe are facing resistance right now wait for price to close above resistance after that we will enter at the retest of the red zone

Bitcoin Bearish divergence on DailyRSI is printing big bearish divergence on the bitcoin chart
on daily we have really good bearish chart looks like whale need more fuel to break the all time high.
it will take some time because it's an big fomo in the market when we break the all time high
small correction can happen in bitcoin

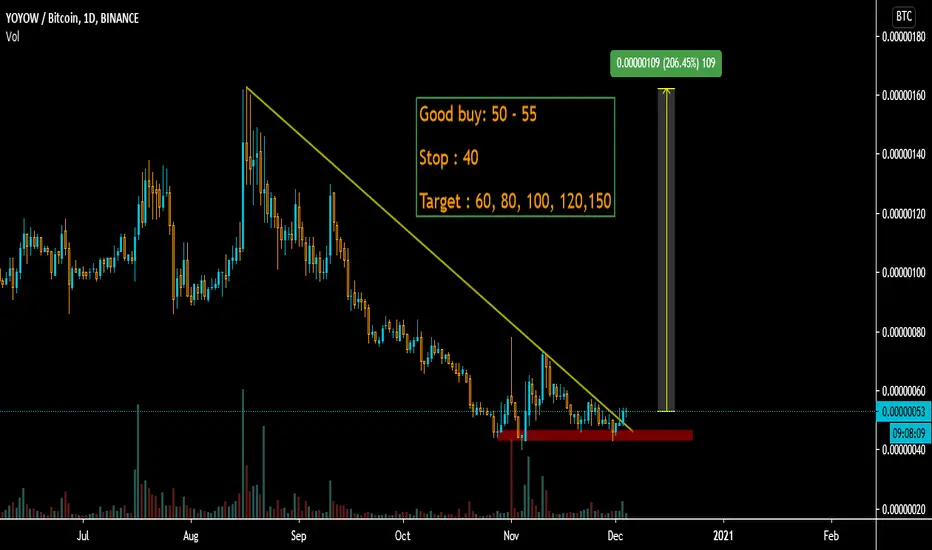
YOYO Coin Daily Breakoutprice made really good breakout on daily trend line
if you want to enter than buy 50 - 55
yoyow is old coin and we have lots of strong fundamental coin
not suggesting to new people a recent binance de-list done and yoyow saved itself so no reason to worries about de-listing of coin.
risk taker can enter here with stop below 40 sats
XLM Steller price in Triangle price in triangle breakout above will send price to
wait for price to breakout at 0.194 usd

BNBUSDT (Ascending Triangle formation)BNBUSDT (4H CHART) Technical Analysis Update
Ascending Triangle
BNB/USDT currently trading at $28.50
Long Entry: After Ascending Triangle Breakout in 4h chart( only enter long after 4-hour candle close above the resistance level at $28.75
STOP LOSS ( support): I will update once Breakout happened
Resistance level 1(Target) : $31.00
Resistance Level 2(Target): $34.00
Max Leverage: 5X
ALWAYS KEEP STOP LOSS...
Follow our Tradingview Account for more Technical Analysis Update, | Like, Share and Comment your thoughts

Zilliqa falling wedge breakout setupzilliqa really good fundamental project
once price close above the if we breakout above trend line and touch 170+ it's our breakout
after breakout add your entry around 161 - 165 and wait for entry also buy small amount around 168 saotshi

ZCoin XZC Trend line Breakout zcoin is breaking the trend line
Good buy below 2700 for swing trading

Zilliqa Falling Wedge SetupPrice break the weekly trend line and looks absolutely bullish with really good volume
will open ladder order in this coin for mid term


AMB price in Double Bottom + Falling Wedgeprice now in double bottom also tight falling wedge
we made good breakout in falling wedge need once bounce and enter the trade
Check out the Daily candle here

Algo Breakout Setupprice made really good breakout and now also at resistance
if price able to hold over this zone we can move higher from here

Ankr Bullish Setupprice is holding very well at retest
44 is very good weekly support which can hold here for long term

EOS (EOSUSDT) Breakout Setupprice break the trend line with good volume and looks really good for long setup
if we hold above this zone than eos price can move really higher

EGLD Breakout Setupbreakout above 9$ once close above
Buy : 9$ and hold we are going to 15$ and than 30$

Bluezelle ( BLZ ) Falling Wedge Breakout Setupprice break the falling wedge and ready to move higher
-
Buy : 485 - 490
Stop : 350
Target : 550 , 650 , 800 , 1000 , 1300

NWC Bouncing off falling wedge support bouncing off falling wedge support zone
really good buy here once breakout above we can go higher
Buy : below 1120 sats
Stop : 850 sats ( 20% so don't add higher amount )
Target : 1300 , 1500 , 1800 , 2000

Ankr price at Support zoneprice now at weekly support zone holding it perfectly and trying to bounce from we need breakout of trend line
after breakout add the retest of the trend line and we are ready to go with stop below support zone
here's the weekly support zone

algorand falling wedge breakuot setupprice is close to breakout if we break here above 1700 sats than we can move higher from here.

BTCUSDT - Symmetrical triangleSo far, we have seen two triangle patterns: one from an uptrend and bullish market move and one from a downtrend with a decidedly bearish look. Symmetrical triangles, on the other hand, are thought of as continuation patterns developed in markets that are, for the most part, aimless in direction. The market seems listless in its direction. The supply and demand, therefore, seem to be one and the same.
During this period of indecision, the highs and the lows seem to come together in the point of the triangle with virtually no significant volume. Investors just don't know what position to take.
However, when the investors do figure out which way to take the issue, it heads north or south with big volume in comparison to that of the indecisive days and/or weeks leading up to the breakout. Nine times out of 10, the breakout will occur in the direction of the existing trend. But, if you are looking for an entry point following a symmetrical triangle, jump into the fray at the breakout point.
Friends, push the like button, write a comment, and share with your mates - that would be the best THANK YOU.
P.S. I personally will open entry if the price will show it according to my strategy.
Always make your analysis before a trade

YFII ( YFIIBTC ) Price now at Trend Line Support YFII YFIIBTC
#YFII $YFII
#YFII trading setup
price now at trend line support can bounce off here
