BNB Price at Resistanceprice break the support trend line and now touching the resistance
for price to move higher it need clear close above the trend line support zone
if unable to close it is bearish retest
Binancesignals

Bitcoin Head and Shoulder price has formed really big head and shoulders.
if we are completing the head and shoulder than we are going down
the right shoulder is not completed yet so first target is 17820 $
if 17820 no hold than we are going down

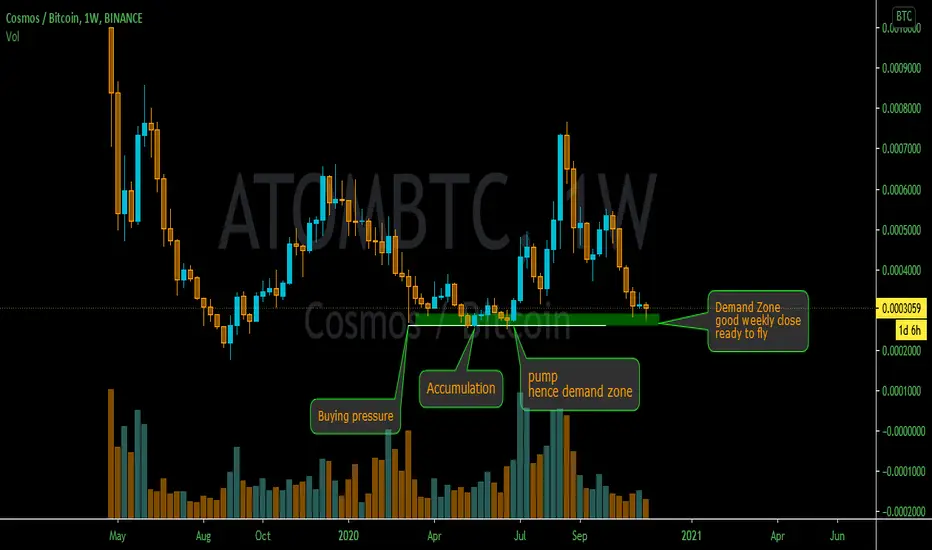
COSMOS ( ATOM ) coin Demand Zoneprice in demand zone
if we have good weekly close than we are ready to fly along ( DOT , ETH )
PolkaDot Breakout Setupone of the best project to invest right now
Buying the dip of this coin at this price is really good opportunity
Buy : 0.000305 below ( hold best fundamental)
Stop : 20% , no stop for mid term holder
Target : 0.00045 , 0.0006 , 0.00078 .. 3x to 5x min for mid term holder

BNB/ USDT TRADE SIGNALBNB / USDT
I told you guys about bnb to put in watchlist
See here :
Now it's looking hot
We are entered it more early but still looking good for entery from this point
Signal 👇
buy partially between
Current price (now) - 27$
Sell :
Target 1: 30.5$
Target 2: 31.9$
Target 3: 39.0$
Target 4: 43.5$ (mid -long term)
Target 5 : 50$ (mid - long term)
Stoploss: 26.55$
Note : please do risk management and use the stoploss

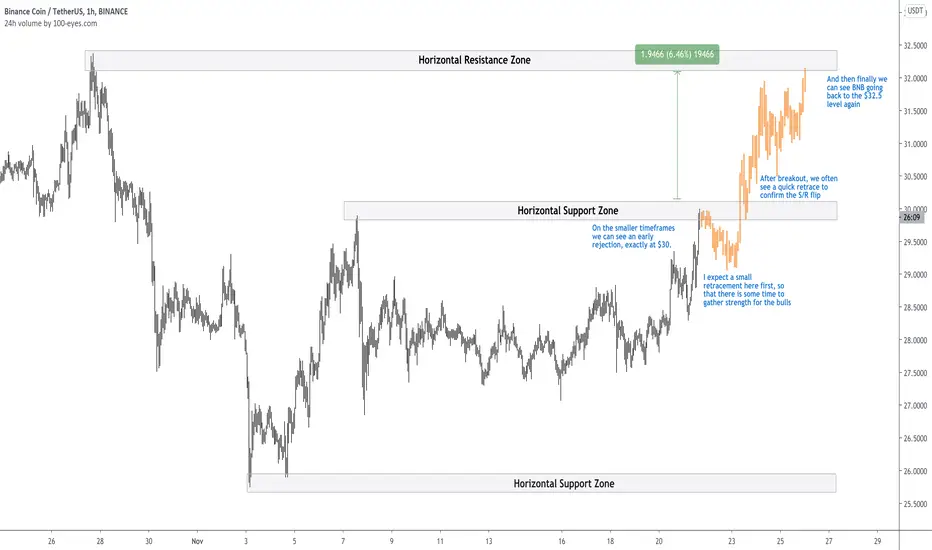
BNB/USDT What Happens After The Rejection At $30?All information can be found on the chart. I tried to make it as self-explanatory as possible. In case you still have any questions, free free to leave a comment or send me a personal message.
BNB 1D Rare reversal pattern "Adam and Eve" works!This idea is a topical continuation of the "Adam and Eve" reversal pattern work out.
We described detailed conditions for model work out in the previous idea , which has been working for almost a month.
Today we update the information by levels:
- the first fall target - $25
- the second fall target - $22.5.
Cancellation of the entire model work out, if the BNB value fixes above $30.90-31.50.
_______________
Each " like under the idea" boosts the level of our happiness by 0.05% . If we help you to be calmer and richer - help us to be happier :)

STMX (STMXUSDT) Breakout Setupprice break here with good volume
Good Buy : 0.0022 - 0.002250
Stop : 0.001900
Target : 0.00240 , 0.0026 , 0.003 , 0.0035

SANDUSDT D1: Best level to sell 10%/60% gains (SL/TP)BINANCE: SAND/USDT
SAND is being compressed in a triangular wave pattern.
If there is a break down of the lower edge of the triangle, I think the price will find the lower zones.
I am inclined to the bearish scenario for the moment.
The range of 0.0462 - 0.048 would be the price zone where I look for entry short.
The stop loss will be around 0.0513
Take profit: 0.0348 or 0.029.
Further expectations can be expected at 0.015
---------------------------------
Trading Involves High Risk
Information for reference only
Not Financial Advice
Please Exercise Risk Management.

THETA breaking down*** Stops need to be re-adjusted and R:R reassessed at point of entry. As a guide, I usually count 6-8 candles back from my entry point on the timeframe I’m trading on and place my stop just below the lowest wick within those 8 candles in the case of a short, or above the highest wick of the last 8 candles in the case of the long. If this rule means your R:R to target one is not good, don’t take the trade. ***
THETAUSDT
Probable
- Long term downtrend daily
- EMA’s bearish on 12hr & 4hr
- Looking like it will break support
- Looking for BCR of support
- 3 short targets

ADA fighting to long but does it have hope..*** Stops need to be re-adjusted and R:R reassessed at point of entry. As a guide, I usually count 6-8 candles back from my entry point on the timeframe I’m trading on and place my stop just below the lowest wick within those 8 candles in the case of a short, or above the highest wick of the last 8 candles in the case of the long. If this rule means your R:R to target one is not good, don’t take the trade. ***
ADA
Probable
- Long term rising wedge
- Daily EMA’s turning down, haven’t crossed bearish yet. 12h & 4 hr have crossed bearish
- Because of recent hammer off 0.09869, I’m not interested in shorting until we take that out with a close below and new resistance tested
- 3 short target
Possible
- Im not looking for longs on this unless we break above 0.11065 and will reassess then

ATOM looking to break out of symmetrical triangle *** Stops need to be re-adjusted and R:R reassessed at point of entry. As a guide, I usually count 6-8 candles back from my entry point on the timeframe I’m trading on and place my stop just below the lowest wick within those 8 candles in the case of a short, or above the highest wick of the last 8 candles in the case of the long. If this rule means your R:R to target one is not good, don’t take the trade. ***
ATOM
Probable
- Long term symmetrical triangle
- EMA’s bearish daily, 12hr & 4hr
- Even though all EMA’s are currently bearish, I have a feeling this is going to break out to the upside. So I’m watching closely on the 4hr for bullish signs and a bullish EMA cross
- Also watch for a break upwards of the triangle & retest of a new support
Possible
- Because of the most recent hammer circled on the chart, I’m not interested in shorted unless we break below that level and retest a new support
- There are multiple channels below the triangle so many short opportunities should this break out to the downside. Shorting this is a game of patience.
- EMA’s are already bearish so now we just need to break a key level
- 3 short targets

XTZUSDT Symmetrical triangle, prepare for break out *** Stops need to be re-adjusted and R:R reassessed at point of entry. As a guide, I usually count 6-8 candles back from my entry point on the timeframe I’m trading on and place my stop just below the lowest wick within those 8 candles in the case of a short, or above the highest wick of the last 8 candles in the case of the long. If this rule means your R:R to target one is not good, don’t take the trade. ***
XTZ
Probable
- Long term symmetrical triangle
- EMA’s bearish daily, 12hr & 4 hour
- Looking for a BCR within the yellow box zone
- 2 short targets
Possible
- Squeeze tighter into the point of the triangle
- Watch to see if we create HL within there for possible bullish trend change
- Watch EMA’s to see if they start to turn up and cross bullish
- Wait for BCR of resistance outside of the triangle
- 2 long targets

QTUM Descending Triangle *** Stops need to be re-adjusted and R:R reassessed at point of entry. As a guide, I usually count 6-8 candles back from my entry point on the timeframe I’m trading on and place my stop just below the lowest wick within those 8 candles in the case of a short, or above the highest wick of the last 8 candles in the case of the long. If this rule means your R:R to target one is not good, don’t take the trade. ***
QTUM
Probable
- Long term descending triangle on daily - bearish pattern
- EMA’s bearish on daily, 12hr & 4hr
- Looking for BCR of yellow box zone
- 2 short targets
Possible
- Look to see if we create a HL within the triangle for a heads up trend may change
- Wait for EMA’s to turn up and cross bullish
- Wait for break out of the long term down trend line
- Wait for retest of the new support
- 2 long targets

Descending triangle OMGUSDT*** Stops need to be re-adjusted and R:R reassessed at point of entry. As a guide, I usually count 6-8 candles back from my entry point on the timeframe I’m trading on and place my stop just below the lowest wick within those 8 candles in the case of a short, or above the highest wick of the last 8 candles in the case of the long. If this rule means your R:R to target one is not good, don’t take the trade. ***
OMGUSDT
Probable
- Long term descending triangle on daily - bearish pattern
- EMA’s bearish on daily, 12hr & 4hr
- Looking for BCR of yellow box zone
- 2 short targets
Possible
- Look to see if we create a HL within the triangle for a heads up trend may change
- Wait for EMA’s to turn up and cross bullish
- Wait for break out of the long term down trend line
- Wait for retest of the new support
- 2 long targets

BTCUSDT Decision point!*** Stops need to be re-adjusted and R:R reassessed at point of entry. As a guide, I usually count 6-8 candles back from my entry point on the timeframe I’m trading on and place my stop just below the lowest wick within those 8 candles in the case of a short, or above the highest wick of the last 8 candles in the case of the long. If this rule means your R:R to target one is not good, don’t take the trade. ***
BTCUSDT
- Broken above the long term bullish channel
- Last time we broke above and held here, we retraced back to the bottom of it
- Have created a new channel above this time, similar to last time (around Aug-Sept)
- RSI is sitting on 80 level - last 2 times we were here we had a pullback
- Also Divergence on lower timeframes but when BTC is this bullish, it doesn’t really care about divergence, just another thing to factor in
- I’m sitting out until we either create a new LL and LH on the 4 hour TF which will present a short opportunity OR we break above current resistance and run to the next level.

BITCOIN Long Signal Generated By AISymbol: Bitcoin ( BTCUSDT )
Side: Long
Entry Price: 13092
Take Profit: 13220
Follow us to get more signals.


LINK Long Signal Generated By AISymbol: Link ( LINKUSDT )
Side: Short
Entry Price: 10.026
Take Profit: 10.250
Follow us to get more signals.

BITCOIN Short Signal Generated By AISymbol: Bitcoin ( BTCUSDT )
Side: Short
Entry Price: 11343
Take Profit: 11200
Follow us to get more signals.

LINK Short Signal Generated By AISymbol: Link ( LINKUSDT )
Side: Short
Entry Price: 10.462
Take Profit: 10.250
Follow us to get more signals.

BITCOIN Short Signal Generated By AISymbol: Bitcoin ( BTCUSDT )
Side: Short
Entry Price: 11328
Take Profit: 11200
Follow us to get more signals.

LINK Short Signal Generated By AISymbol: Link ( LINKUSDT )
Side: Short
Entry Price: 10.598
Take Profit: 10.250
Follow us to get more signals.
