This is why The Binance Coin (BNB) Won’t Stop Bullish RallyHey friends hope you are well and welcome the new update on Binance coin.
As in my previous post on BNB, I showed that the priceline of BNB coin has formed different harmonic patterns in US Dollar market and the Bitcoin market as well. Now finally by the grace of Allah the most high the price action has moved up and surged more than 98% and both ideas are executed perfectly as per their Fibonacci sequences as below:
Previous article’s Gartley move with US Dollar pair:
Previous article’s BAT move with Bitcoin pair:
On small time period 4-hour chart, since 27 Sep the priceline was moving in a bullish pennant. Now finally it has broken out the resistance and likely to move down to retest the previous resistance of the pennant as support.
The priceline of Binance coin is moving above simple moving averages with the time period of 25, 50, 100 and 200 and using these SMAs as support very well before the next rally.
On long term weekly chart the priceline is moving in an up channel as below:
On weekly chart it can be observed after March 2020 the price line of BNB has surged more than 420% and broke out the ichimoku bearish cloud. At this time the lagging span of ichimoku cloud is moving above the price action and the cloud as well. The conversion line has crossed up the baseline and this bull cross is still in play below the candlesticks of Binance coin price chart. The Ichimoku cloud is also turned bullish.
Conclusion:
All indicators and patterns from daily to long term charts are giving bullish signals. However, we should use the support of the up channel on weekly chart as stop loss to minimize the risk facor.
Binancesignals

BTC/USDTin my analysis there will be several swings. where the swing limit is divided into several levels.
the base line strengthened to 10,436.
which strengthens my guess, BTC will go to 13K.
Support By
#JuniorOnline
#BabyScrypt

When to buy LINKPlease feel free to share your view on this pair down below in the comment section. I'm more than happy to be challenged and have an interaction on this idea.
Also make sure to leave a like as it helps me out a lot!
------------------------------------------------------------------------------------------
- MACD histogram showing weakness
- Lagging MACD crossover
- Bullish engulfing candle
Triple combo for profit making on LINK

GAS/BTC price analysis by CryptoBullSignals GAS/BTC heading towards the upside, I see the only upside.
Already in an oversold position.


Binance ImpulseHad a scroll through some noise while patiently waiting for Bitcoin to signal and saw the BNB Chart.
As an experiment on my Bitcoin long examples, I wanted to test my 3 indicators, I have chosen to assist me with my buy and sell options on Bitcoin and Ethereum.
Here we can see a perfect example (yellow being positive) of The Super Trend buy signal, The Aligator opening-up positive and the Trend line on the MACD signaling green, all at more or less the same time on the Day Chart
By Morne Olivier
#business2blockchain


BNB/BTC - ATS SCALP BACKTEST (LONG ONLY)Script settings for 6H timeframe:
· Signal calculation type - "hlc3"
-TP for Long - 8%
-SL for Long - none

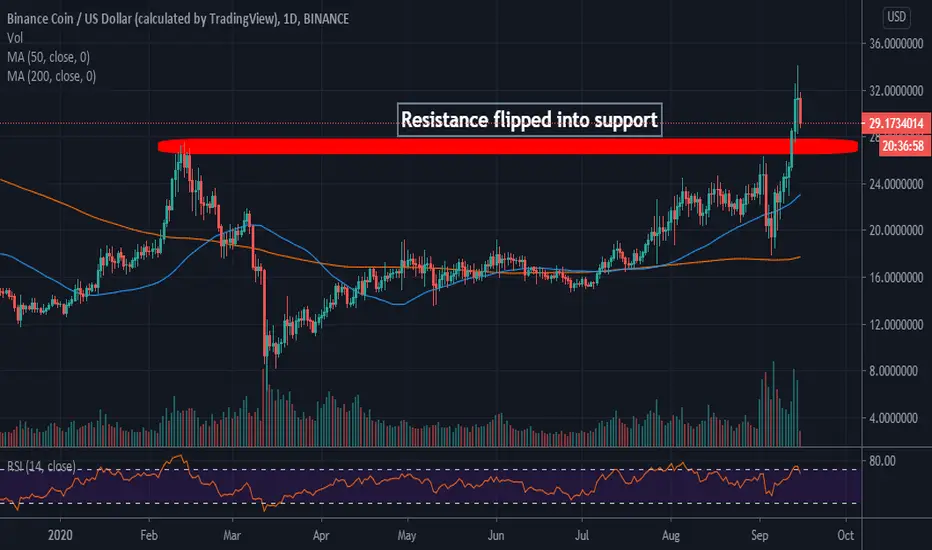
Binance Coin Analysis: BNB Drawing Closer To Yearly Highs
Binance DeFi integration causes a spike in network activity while creating interest in Binance Coin.
BNB seeks support after rejection at $34; the buyer congestion at $28 to come in handy.
Binance Coin dived to lows of $6.4 following the Black Thursday crash in March. The majority of markets around the globe were feeling the heat from the Coronavirus outbreak. A recovery started alongside other major digital assets but Binance Coin as always curved its unique path, aiming for new yearly highs. There have been barriers but bulls remained relentless in the push for higher levels. BNB enjoys the support of the largest cryptocurrency exchange by daily volume and the number of users, Binance. The exchange encourages users to pay fees using BNB thereby driving up demand for the token.
The recent integration of DeFi into the Binance Smart Chain resulted in increased transactions and activities from projects such as BakerySwap, BurgerSwap, and Cream Finance. According to data from the Binance Smart Chain, BurgerSwap attracted a staking volume of up to $400 million in just 24 hours. Daily transaction activity also surged as per the data provided by BscScan.
At the time of writing, Binance Coin is seeking support above $30 after hitting a new September high at $34. If the retreat extends below 30, the resistance flipped into support at $28 will come in handy.
However, Binance seems to be taking a breather from the mission to new yearly highs considering the wide gap created by the 50 Moving Average above the 100 MA. The RSI signals a short term retreat from the overbought region but low volatility means that the upside does not have a lot of traction.
BNB Intraday Levels
Spot rate: 30.70
Relative change: -1.82
Percentage change: -5.88%
Trend: Short term bearish bias
Volatility: Low
price heading down from herewe have entered at this range and will be riding this short
if you chose to join us, enjoy the profit
PS - the last win was moderated incorrectly by trading view, therefore did not make it out

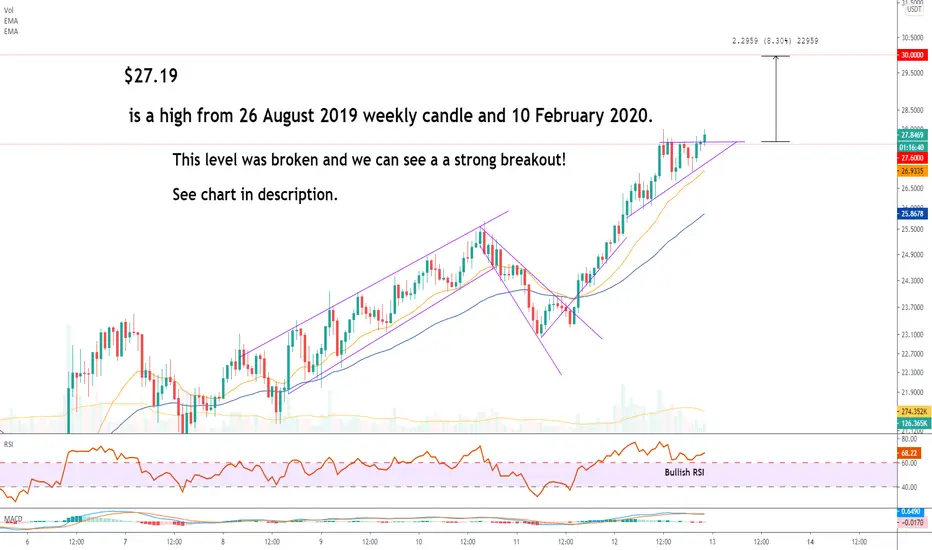
BNB is seeing a new high after more than a year!Hey!
BNB is strongly bullish on weekly, daily time frame, and currently is breaking through the roof of the resistance line of this ascending triangle!
Expect tommorow full BNB Multi time frame analysis based on Weekly.
But the one hour candle is not closed yet, we are looking for a 1H break of 27.637 by a full candle. ( very likely to happen in this current candle)
There is a new high after a year! That's a strong bullish sign.
Oh and btw, the weekly candle closes tommorow so I expect strong volume!
I am in!
Tibor
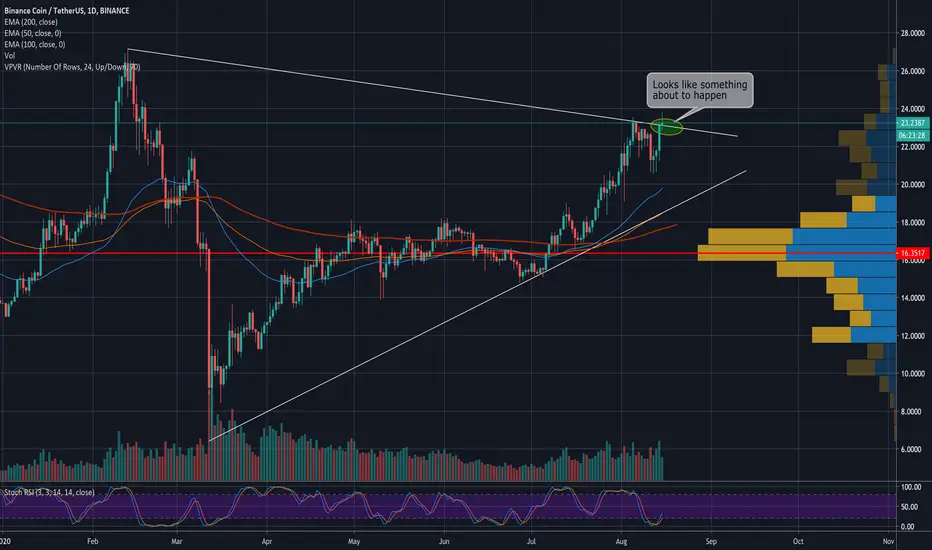
BNBUSD Second Chance: Profit=76% SL=30% Reward/Risk > 2.5:1Second Chance Trade Setup summary:
Profit targets = 76% = {TP3 = 8% + TP4 = 29% + TP5 = 39%}
Stop Loss = 30%
Reward/Risk > 2.5 : 1
New Trading suggestion:
" It is still possible to see a temporary retracement when the price falls to the uptrend line that will support and reject the price.
if so, traders can set orders based on Price Action and expect to reach short-term targets. "
New Take Profits:
TP3 @ 22.60
TP4 @ 26.58
TP5 @ 28.96 New
TP6 Free
SL= Break below 18.80
--------------------------------------------------------------------------------------------------
First Buy Current Status:
Total Profit: 92%
Closed trade(s): 50% Profit
Open trade(s): 42% Profit
Trade Setup:
We opened 5 BUY trade(s) @ 17.71000 based on 'previous Forecast' at 2020.07.21 :
Closed Profit:
TP1 @ 18.80 touched at 2020.07.23 with 6% Profit.
TP2 @ 20.80 touched at 2020.07.26 with 17% Profit.
TP3 @ 22.60 touched at 2020.07.27 with 27% Profit.
6% + 17% + 27% = 50%
Open Profit:
Open trade is 21.40000 (current price) - 17.71000 (open price) = 21%
2 trade(s) still open, therefore total profit for open trade(s) is 21% x 2 = 42%
Technical analysis:
. BNBUSD is in an uptrend and the continuation of uptrend is expected.
. The price is below the 21-Day WEMA which acts as a dynamic resistance.
. The RSI is at 44.
❤️ If you find this helpful and want more FREE forecasts in TradingView
. . . . . Please show your support back,
. . . . . . . . Hit the 👍 LIKE button,
. . . . . . . . . . . Drop some feedback below in the comment!
❤️ Your Support is very much 🙏 appreciated!❤️
💎 Want us to help you become a better Forex trader?
Now, It's your turn!
Be sure to leave a comment let us know how do you see this opportunity and forecast.
Trade well, ❤️
ForecastCity English Support Team ❤️

KNC on supportGood buy on support, Expecting a nice breakout of this triangel. Do we hold this support and breaking out We can easy see 3$


Today`s ALT!!! APPC/BTC: Making a triangle to gather powerBINANCE:APPCBTC
Exchange : Binance
Coin: APPCBTC
Buy Zone: 0.000004 ~ 0.0000036
Target Point: 0.0000041/ 0.00000435/ 0.00000458/ 0.00000478
S/L: 0.0000035
Risk: High
Term: Middle - Long
If you`re risktaker, you`ll like it
It broke up the down trending line without pumping
Now, it`s making a symmertical triangle to gather power
The chart and RSI have a same short-term up trending line
It`ll be able to go up while keeping the up trending line
The Volume is almost down, it`s time to go up !!!

WANBTC has good signals for longAs you see that our indicators are referring to buy WANBTC.
Targets are the first resistance level one by one.
stop-loss when our indicators are referring to sell signals.

NAVBTC has a good opportunityAs you see, our indicators are referring to buy NAVBTC.
Usually, NAV makes a great raise before it down again, so targets are open but if you are realistic so keep the target 1400 sat or when our indicators give sell signals.


Bitcoin crossed it's main resistance thus making new S/RHello Everyone,
As I said in my previous analysis that bitcoin either will do a correction downwards which it did but not that much which I expected so after doing some correction it crossed its major resistance which was at 11400 levels ( I plotted parallel trendline in that area ) and I also drew some small uptrend channels which bitcoin has tested before and I was sure it will test those channels again if it goes uptrend or makes new highs. I would also talk about oscillators and momentum indicators which diverged before which is mainly short signal but according to me momentum indicators can be an unreliable indication as of now you have seen MACD has diverged recently but the price did not come down a lot of people were hoping about so if any of you guys are using oscillators or momentum indicators to short/long positions, I would strongly suggest relying on stop loss because high leverage can cause capital loss, you guys are only trading on futures.
`````````````````````````````````````````````````````````````````````````````````````````````````````````````````````````````````````````````````````
Yesterday Bitcoin made a new height so I drew a parallel resistance from that point and other parallel supports and resistances as you can see in the chart. Support and resistances were good nevertheless as I mentioned in my previous idea support and resistance become opposite once they are violated. Channel line can be of huge help in the future in determining trends and making internal supports and resistances which the price has experienced before so as you people can see in the chart I drew some uptrend channel lines which are being effective now. The price currently is testing the second channel I made and it has tried to cross it several times but failed even now the price is at the resistance level of the uptrend channel and if it crosses it and closes above the channel it will move from the second channel to the first channel that I made whos resistance is uneven because it has only touched once by the previous peak and never again so it can make a new high again thus making it a persistent resistance or it can bounce back from the resistance of the second channel that I made thus giving us a short sign with a stop loss just 3% up from the resistance and first take profit which will be at the middle of the channel and another 2 take profit of 25% which will be plotted mentally.
`````````````````````````````````````````````````````````````````````````````````````````````````````````````````````````````````````````````````````
Ichimoku Components -
Kijun - REDLINE
Tenken - BLUELINE
Senkou A - Upper Border of cloud when the trend is bullish and Lower border of cloud when the trend is bearish
Senkou B - Upper Border of cloud when the trend is bearish and Lower border of cloud when the trend is bullish
Chikou - The green color shadow of price moving 26 period back
`````````````````````````````````````````````````````````````````````````````````````````````````````````````````````````````````````````````````````
According to the ICHIMOKU trading system, the price still is in a bullish trend and it has 4 supports to cross so if it crosses Kijun that means it has crossed two supports which are Tenken and Kijun (that has not happened yet) so there could be 2 scenarios there would be a dump and price would cross Kijun when Tenken is above it thus giving us a weak signal of short or it would correct itself slowly and then there would be a crossover of Tenken and Kijun in which Kijun will be above the Tenken so it will give us a short signal and stop-loss would be at 3% higher than Kijun that will be also considered as a weak short signal because the price would be above the Kumo cloud and if there is any other activity of ICHIMOKU trading system I will update the idea automatically.
`````````````````````````````````````````````````````````````````````````````````````````````````````````````````````````````````````````````````````
If you like my idea do give me a follow and if am wrong at some point in this idea, tell me comments :)

Bitcoin going to make some correction or will make new highs XOHello Everyone,
We have seen a lot of activity of Bitcoin because it was deemed as real money by DC laws so masses purchased bitcoin and are now holding because it is digital gold (named) so my analysis is Bitcoin is in my top resistance and support area. The major resistance is at 11391 area and major support is at 9600 area but there are many internal supports that bitcoin needs to cross if it is planning to go to that area. A correction is a must after this massive pump according to supply and demand we have seen a lot of demand this week so there must be a correction.
Each time when previous resistance has been tested uptrend is in a critical phase, failure to cross the previous peak or unable to bounce the near support usually means that the existing trend is changing. Now bitcoin has made a new high that is 11394 if it fails to cross that resistance then surely it will retrace the path, nearest support is at 10832 which has tried to cross 3-4 times but failed to cross it thus giving us a good support area. An individual can take a long order whenever the price retests that support if the candle on 1 hour succeeds crossing that resistance, do not go for long order if the candle is unable to cross that support and makes a wig that exactly touches or is near support wait for the next candle if next candle crosses the previous candle high I would go long there with a stop loss that will be 3% down from support. Please do examine MACD and RSI before going for long I suggest this for every order MACD and RSI plays an important role in telling us about demand and supply so that can be of great help.
---------------------------------------------------------------------------------------------------------------------------------------------------------------------------------------------------------------------
Ichimoku Components -
Kijun - REDLINE
Tenken - BLUELINE
Senkou A - Upper Border of cloud when the trend is bullish and Lower border of cloud when the trend is bearish
Senkou B - Upper Border of cloud when the trend is bearish and Lower border of cloud when the trend is bullish
Chikou - The green color shadow of price moving 26 period back
.....................................................................................................................................................................................................................
Ichimoku also gives a great idea that is the price is still bullish there are many signs of that like Kijun and Tenken crossover that happened few hours ago and still in motion, they are parallel that means the price is consolidation but major signs are still bullish. Another sign I want to talk about is the price is still above Kijun which means bullish until and unless it crosse the Kijun and closes below as well as the Kumo cloud, Price is above Kumo cloud which means the price is bullish and has 4 supports to cross which are TENKEN, KIJUN, SENKOU A and SENKOU B. Crossover of Senkou A and Senkou B is a little bit troubling me because Senkou B is above Senkou A which indicates us of a bearish sign but still bullish signs are a lot more than bearish signs so we can say that price is in the uptrend. Chikou line has also crossed the previous price line so that also means that trend is bullish.
If you have any thoughts regarding this idea or if I am wrong at any point, do tell me in comments :)
