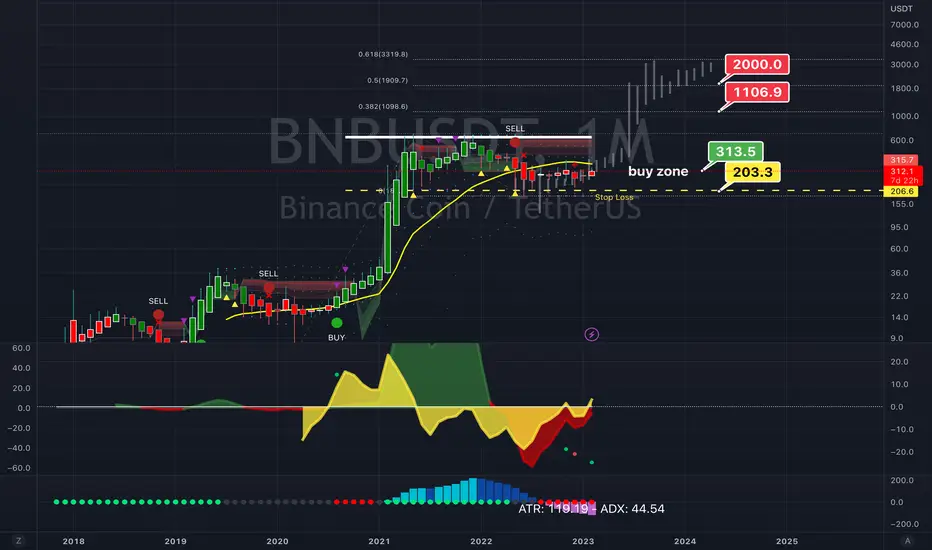
BNBUSDT DailyHi guys, Hope you well
We have two scenario for binancecoin. I agree with first that go down to daily demand .
SecondChanceCrypto
⏰27/April/23
⛔️(DYOR)
always do your research.
If you have any questions, you can write them in the comments below, and I will answer them.
And please don't forget to support this idea with your likes and comment
Binancesignals

Bitcoin next possible planBitcoin next possible plan entry and exit mentioned in chart
HAPPY TRADING 🕊️

Let's cover everything about BTC and what ALTs to trade.This kind of structure is in a lot of uncertainty but we still can find gem on this random price action.

DYDX Long SetupDYDX has a bullish chart, broke the downtrend on the daily timeframe and then started making higher highs, breaking the SMA 200 and then retesting
with rejection forming a Bullish engulfing, I didn't take this entry, so in order to have the best risk reward possible, I'll wait for the price to get closer to our ascending trendline and we'll go long with the confirmation, I'll update the idea as soon as that happens.

MANAUSDT Long SetupMANA recently broke out of the daily descending trendline and the 4h minor trendline, as you can see on the chart, finding support at 0.29, it is trading above the SMA 200 and in my opinion it is a great entry at these levels, with a great risk reward. Thecloser you can buy near support, the better.
We are in a clear Uptrend now.

GALAUSDT POSSIBLE LONG SETUPGALAUSDT is showing clear signs of a rise, for this reason im Bullish, in addition to the buying volume that has increased immensely in the last few days, we can see that it has broken out of the falling wedge and the SMA of 200 and the SMA of 20 on the daily timeframe, in addition to that it has made a bullish engulfing exactly at the bottom edge of the falling wedge.
I'll wait for confirmation and update this idea.

Binance COIN BNB Price Target after the U.S. CFTC sued BinanceBinance and its CEO, CZ, are being sued in the US by Commodity Market Regulators in a complaint that claims the defendants committed “wilful evasion of US law”.
This comes after the SEC Charged Crypto Entrepreneur Justin Sun and his Companies for Fraud and Other Securities Law Violations last week.
Binance is responsible for 61.8% of the global crypto trading. Its Market Share is Huge!
I assume we are about to witness a major selloff in the crypto industry.
My BNB Binance Coin Price Targets:
BNB/USDT short
Entry Range: $310 - 320
Price Target 1: $295
Price Target 2: $265
Price Target 3: $240
Stop Loss: $350

Bnb | Needs More Buyers Bnbusdt
Support can be retested once again, if the interest of buyers is seen on support, BnB will definitely fly.
But for now be careful and show patient.
I am expecting a correction to 290-270$.
Remember: We only give Idea's from our experience and knowledge, it does not mean that it will be 100% correct, the market is always unpredictable, anything can happen anytime.
Always trade with your own research and knowledge.If You Are Satisfied With Our Work Then Join.

BTC and BNB are entering the triangle patternBoth BTC and BNB are entering the possible triangle at the resistance zone. 2 things that can occurs right now is that either the price breaks above the upside or getting rejected and slam down pretty hard. The thing is that when we see a consolidation near strong level of support or resistance, the APEX break out will be very wild and could give a huge effect to the next movement.
Note : BTC since the break out above $25200 level, hasn't retested this region as a support so current break out isn't backed by a strong confirmation.

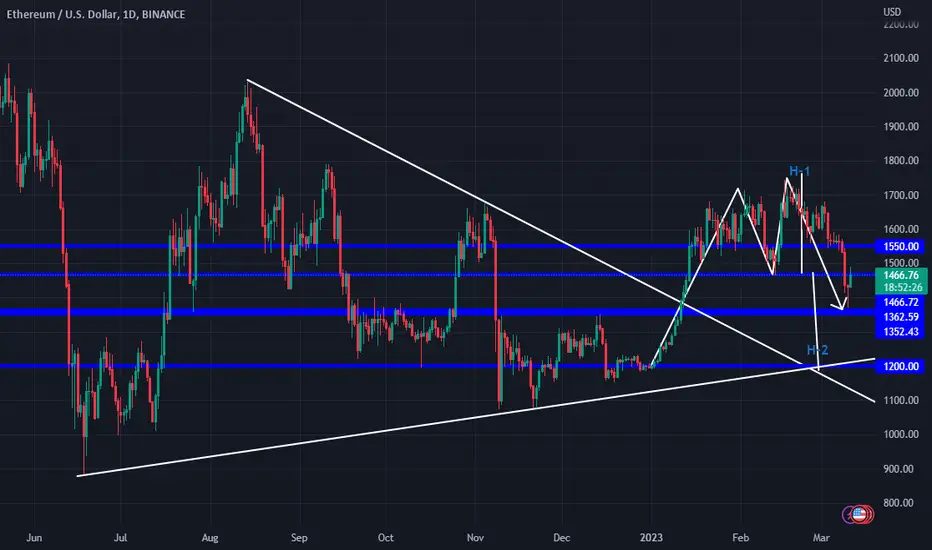
ETHEREUM IS ON THE BEARISH PATH OF BITCOINHey there crypto enthusiasts, it's been a wild ride for cryptocurrencies this week and ETHEREUM is right in the thick of it!
ETH is currently rockin' a DOUBLE-TOP PATTERN that kicked off around January 1st, 2023. The second part of the pattern has formed just below the NECKLINE, but don't despair - a bullish pinbar has popped up and pushed ETH back to that neckline. This means there's a chance we could see a reversal back up to the $1,500 zone.
Now, I may be a conservative trader, but I'm still excited to potentially short ETH at the $1,500 zone. My targets are set at $1,370-$1,350 for TP-1 and $1,200 for TP-2.
Why $1,200 for TP-2, you ask? Well, that's where the longer arm of the M-pattern (H-1) will be achieved as H-2.
Of course, there are no guarantees in trading, but that's just my opinion. So why not give this post a like, follow me, and share your own thoughts on ETH in the comments below?
Let's keep the conversation going!
BTC IS LIKELY TO GO DOWN A LITTLE WITH FIB38.2 FOCUS My thought for BTC is evident on my chart. I am working the double top pattern on the chart
I am looking at BTC losing some more dollars to fall to FIB38.2 zone which happened to be the $21,400 area...
share your thoughts and opinion on what you are expecting BTC to do
kindly, follow, like, comment and share

Binance Coin (BNBUSD): Very Bearish Outlook! Here is Why:
Have you seen that huge head & shoulders pattern that was formed
on Binance Coin on a daily.
After yesterdays' fundamentals, the price successfully violated its neckline and closed below that.
Probabilities are high now, that the market will keep falling.
Goals: 256 / 243
❤️Please, support my work with like, thank you!❤️

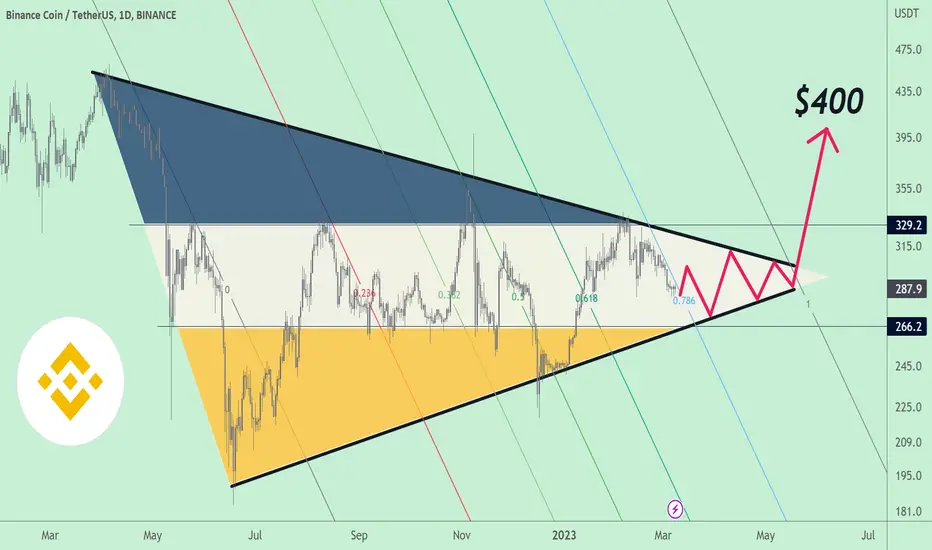
ArShevelev /// BNB Crazy Big Triangle to Breakout!Binance holding nicely during whole bear market phase, and it seems like it will make another good profits for those who entering next bull phase!
$400 is a "musthave" expectations, realisticly prices could be much, much higher in 2025.
Kind Regards
Artem Crypto
BNBUSD Bull flag targeting $390The Binance Coin (BNBUSD) is below its 1D MA50 (blue trend-line) trading inside what seems like the early stages of a Channel Down ever since the rejection on the 336 Symmetrical Resistance (which has formed 3 tops since May 23 2022).
The last such rejection though formed a similar Channel Down (red) that ended up being nothing more than a Bull Flag that later made a Higher High. The Higher High bias emerged as the pattern since June is a Channel Up. This time BNB has the 1D MA200 (orange trend-line) as a Support and not as a Resistance and is coming off a 1D Golden Cross.
We are bullish and our first target is Resistance 1 (398.0) and if we get a 1D candle closing above, then extension to Resistance 2 (460.0).
P.S. We have been medium-term bullish on BNB since December:
-------------------------------------------------------------------------------
** Please LIKE 👍, FOLLOW ✅, SHARE 🙌 and COMMENT ✍ if you enjoy this idea! Also share your ideas and charts in the comments section below! **
-------------------------------------------------------------------------------
💸💸💸💸💸💸
👇 👇 👇 👇 👇 👇

BNB to $1000 by Jan 2024BNB has multi time frame squeezes. And the most powerful of all has been set up in the monthly chart. This is monthly price action so each bar represents one month. If the monthly squeeze fires to the upside we will see BNB to move past $1000 by the end of year. There is a confluence in money flow indicators as well. I will place a position trade on this for a long term play with a stop at 250 level.
1inch carving for a single digit soon Trade idea ->
CMP - $0.57
MCAP - $458M ( Competitor $UNI Mcap $5.3B )
Key Support Levels - $0.51-53 ( DCA Entries )
Resistance Levels - 200D MA around $0.629 ( flip and hold will be a easy peasy )
Price is above crucial support above $0.49
Yearly open @ $0.378
Trade idea invalidated if daily closes below $0.46 also depends on #BTC haha, if it nukes to $20k #IYKYK :
Tokenomics -
274,286 1INCH Tokens unlocks on 22/02/2023 ( Approx $158K )
Next major unlocks are in June 2023.

The major trend line since 14 months has finally broken !!Ray looks so bullish in daily time frame.
A trend line since more than 14 months has been successfull broken
We expect 250% bullish raise in next days
Don't forget to support us with ur like, comment and subscribe for more ideas🎯
Good luck💙

Doge/usdt long tradeWait for the price to retest then buy at limits given below.
Entry = 0.08520
Sl = 0.8157
Tp = 0.9300
RR = 2.15

Btc/usdt long trade setupBtc looking good for a long setup. At 15 min time frame we have to wait for the retest to golden zone levels. The. Take entry at limit or market order according to your preference.
Entry = 22820
Sl =22520
Tp =23420
Risk to reward= 2

Short Term Bitcoin longThe chart for $BTC is showing me many bull flags.
From the chart shown above, you can see a local breakout, Moving Average support is holding $BTC, and that RSI has lowered.
I have done much more analysis to back my long belief, special indicators of mine indicating it will go up among other fundamental and technical analysis.
Keep in mind $BTC is volatile these days so I advise being very careful and vigilant!
STOP LOSS: $22,180
TP1: $23,400
TP2: $23,600
TP3: $23,800
TP3: :$24,000
You may wonder, "Why have you not shared all your TA and other analysis?"
Well simply because the Fundamental side of it is quite long, and honestly I do not like showing all my TA tricks publicly on TradingView.
I also unfortunately cannot tell you where to go to see all my tips and tricks because TradingView will label it as self advertising lol.

BNB analysis On the 4hr Tf or next orderblock is right at 290 although you cannot see that on the other TF I believe Tp num1 would be 288
I have a tight SL just under the most recent resistance line shown in white on the chart giving me a 5 to 1 risk ratio

BNB 4hr Analysis | Potential SetupBNB is expected to pump to 278.5 in the coming week and reject from there.
Follow your risk management.

BTC MAY HIT $17,401 BEFORE MOVING DOWNBTC was seen on a trendline from $15,472 to $18,440 region where a %50 retracement seen at $16,956 region which was broken down and touches $16,250 region and moved up to retest $16,956. But the %50 movement from $18,440 down to $16,250 is at $17,401 which price may need to hit in other to gain enough momentum to push down 👇 if not broken. Please your our contributions is are welcome, comment your view to this analysis.
Thanks
