Why and how to use Binary Option Strategy Tester?I want to start with a disclaimer that binary option trading is banned in India and I don’t trade binary options on any platform.
I learned about this particular derivative product class from my friend, who insists that I trade binary with martingale (no loss options!). He showed me some strategies and trades on a demo account and profited every time applying martingale. I felt curious to know more about this product, where I just have to predict the next candle.
A small note on Martingale, if you don’t know:
This is a way to increase the size of the bet after a losing bet, so that you can recoup your losses if you eventually win. For example, If the payout is 70% (If you bet $1 and you win, you will get $0.7) and you bet $1 and lose, your next bet would be $2. This way you can recover your early loss and make some profit.
To extend further, I started to gather all available strategies and found lots of lucrative claims. Due to its different nature, the general backtester is not compatible with binary options. I love to see stats behind any claim, but am not able to test any strategy due to absence of any formal strategy tester for binary options.
I started to code to test those strategies and build the strategy tester with Martingale. Soon, I realized that all the quick gain claims are not true. I am not saying that binary options are not profitable, there are some smart traders who are making good profit. But you need to test the claim before putting your money.
Let me elaborate this with a strategy.
I found the following strategy somewhere on the web, but I don't have the link to give credentials to them.
Strategy:-
Interval: 2 minutes
Indicator: Bollinger Band with 7 SMA and 3 STDV
Entry Rules:
Wait for the price to cross the Bollinger band middle point.
If price crosses the Bollinger band middle point (cross up or down does not matter), wait for a candle that does not touch upper or lower band and middle band.
If we able to find the candle, we will enter our trade as per the candle color
If the color of the candle is green we’ll take Higher or Buy or Call. If color of candle is red we’ll take a Lower or sale or Put
We have to take the trade within last 2 seconds of present candle for next two minutes duration
If we lose we’ll go to level II martingale and follow the losing candle color
To minimize the number of trade, we’ll restrict ourselves to one trade per cross.
Following chart elaborates the strategy in detail.
Let's code the strategy:
length = input.int(7, minval=1)
src = input(close, title="Source")
mult = input.float(3.0, minval=0.001, maxval=50, title="StdDev")
basis = ta.sma(src, length)
dev = mult * ta.stdev(src, length)
upper = basis + dev
lower = basis - dev
fab_candle_upcross=(high< upper and low>basis)
fab_candle_downcross= (high< basis and low>lower)
up_cross=ta.barssince(ta.crossover(close,basis))
down_cross=ta.barssince(ta.crossunder(close,basis))
is_first_up=false
is_first_down=false
if fab_candle_upcross
for a=1 to up_cross
if fab_candle_upcross
is_first_up:=false
break
else
is_first_up:=true
if fab_candle_downcross
for a=1 to down_cross
if fab_candle_downcross
is_first_down:=false
break
else
is_first_down:=true
//strategy for buying call
is_call=(is_first_up or is_first_down ) and close>open
//strategy for selling call
is_put=(is_first_up or is_first_down ) and close<open
Put this line of code in strategy tester and get all historical trades.
The default setup result:
You can play with other available test options but the strategy is not able to produce any positive result in back test.
What can be done further to make the strategy tester better?
My Wishlist for advance development.
More Martingale: Present strategy tester can be improved by adding more martingale levels (Up to 15?).
Strategy Martingale: We are using the martingale per trade basis but can use strategy wise. Like if we make a loss in the first signal, instead of starting martingale immediately we may wait for the next signal to put the martingale amount.
Number of candles to hold: The present strategy holds one interval, but holding multiple candles can be a good option.
Select Period to test the strategy: The strategy should adopt specific period(within a date range) testing.
Martingale optimization: Given a strategy, can we optimize martingale level, i.e at what martingale level strategy may produces 100% profit. And what is the distribution of martingales?
Investment risk: Maximum investment amount reached historically applying martingale
Last trade stat: Getting recent trade stat is helpful to evaluate the strategy, Last 3,5,10,15,20 and 30 trade stats can add more analytical power.
Day wise stat: Profitability stat as per day (Mon, Tue etc.)
Month Wise stat: Performance per month (Performance in January, February etc.)
Buy Sell Flip: If we apply the buy rule for sale and sale rules for buy.
Trade Restriction: Quit trading after a certain number of consecutive losses or wins.
The above 10 points can improve the strategy tester significantly. If you have any idea that can improve the strategy tester please share with me.
Binaryoption-signals-trading
Binary Options. trade for 01.06 looking for the entry point.Hi Friends ! Today I decided to tell in detail about my trading, namely to tell about how my strategy "Scalping Pro" works ( see my scripts and ideas )
Consider for example two pairs 1. USD-CHF 2. CAD-JPY .
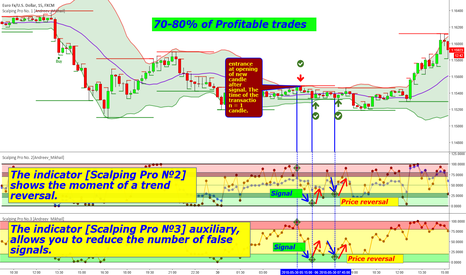
USD-CHF today at the time of my trade, this currency pair behaved calmly and was in the same price corridor . indicatory pro 2 and pro3 perfectly showed the signals of price reversal.
as a result, 7 transactions in plus for 4 hours of trading.
in the example of the CAD-JPY pair, I will show how to act when the price is in a downtrend or an uptrend .
Indicators Pro 2 and Pro 3, which help to see the moment of price reversal, the main thing-to learn how to read them correctly and then the number of positive transactions will grow .
If you want to try the strategy contact me in private messages, I will give you access and explain the basic principles of action.
I conduct personal consultations and trainings on the basics of Binary options trading.(Tips, recommendations )
Strategy for Binary options 70-80% of positive tradesScalping strategy working timeframe not lower 5M (15M,30M) gives 10-15 signals per working day on average.
is in currency pairs EUR-USD , GBP-USD , USD-JPY, EUR-NZD , BTC-USD . and other currency pairs
Expiration time 5 min (1 candle) in more detail in the description of the script.
Wishing to test strategy write in personal messages.
below is an example for 5m Statistics for the week 50+ 19- =31+ profit. with a yield of 80%, the net profit was 26+ (I work as a fixed amount of the transaction without martingale ) .
09.04.18
10.04.18
11.04.18
12.04.18
13.04.18
Strategy for Binary options 70-80% of positive tradesScalping strategy working timeframe not lower 5M (15M,30M) gives 20-25 signals per working day on average.
is in currency pairs EUR-USD , GBP-USD , USD-JPY , EUR-NZD , BTC-USD . and other currency pairs
Expiration time 5 min (1 candle) in more detail in the description of the script.
Wishing to test strategy write in personal messages.
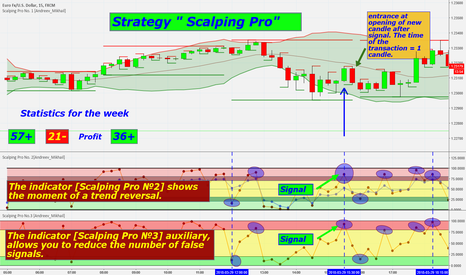
below is an example for 5m Statistics for the week 57+ 21- =36+ profit.
02.04.18
03.04.18
04.04.18
05.04.18
06.04.18
Strategy [Scalping] for B.O. EUR-USD 5M Statistics for the week.I decided to post statistics on the work on the Scalping strategy over the past week.
I work with a fixed amount of the transaction, not what "martingale" from here is the minimum risk of deposit drawdown.
Statistics for the week (76+) - (23-) = 53 Plus see screenshots.
A detailed description of the principle of the strategy can be seen in the description of my scripts.
12.03.2018
13.03.2018
14.03.2018
15.03.2018
16.03.2018
Trading Strategy Sniper Pro For Binary Options in Action.This strategy consists of three scripts each complementing each other and allowing for a maximum to cut off false signals perfectly shows itself on M-5, M-15 (the less T.F the more signals but not lower than M-5) actually under these periods and were sharpened all the settings. At the moment, the results are encouraging, not when, the main thing is to have patience and stick to all the rules proper from here and the name "Sniper"
1. The arrow appears and shows the direction of the trend for the nearest time interval, and also shows the breakdown of the price after which the next candle closes in the opposite direction (here and in the step two lower indicators go to work thereby helping to filter the signal) see in the photo.
2. The indicator is painted on three zones which in turn are the levels of PS, respectively, in which zone the signal line with the points is moving can be understood as the trend. The price swings most often occur when the signal line leaves the border of the colored area.
3. The indicator helps to filter the signal and shows the strength of the price breakdown, for example, if the line with red dots is in the gray area and the line with green dots went far abroad, then the huge probability that the next candle will be the opposite of the previous one.
P.S It is important to understand! What works great in one hand, can be completely useless in others! Therefore, practice, patience and experience solve everything.


