OPKO Health | OPK | Long at $1.12OPKO Health finally closed the price gap on the daily chart between $1.11 and $1.12. There are no more price gaps below the current price (bullish). In the past year, insiders (primarily the CEO), have purchased over $4.7 million of shares at an average price of $1.55. Historically, this stock is very cyclical, and I believe we are near the bottom before the next cycle up. I have no idea when this will occur (may trade sideways for a while or dip below $1 in the near-term), but the insider purchases tell me they are preparing for a move. Average analyst price targets are between $2.75 and $3.99 right now, depending on the source. Book value = $1.66. As with any biopharmaceutical and diagnostics company, NASDAQ:OPK is purely speculative at this stage - yet raking in over $600 million in annual revenue.
My personal buy for NASDAQ:OPK was triggered at $1.12 and I hope to see more insider buying at this level.
Targets into 2028:
$1.40 (+22.8%)
$1.66 (+45.6%)
Squeeze for any reason = $5.00 (+338.6%)
Biotechstocks

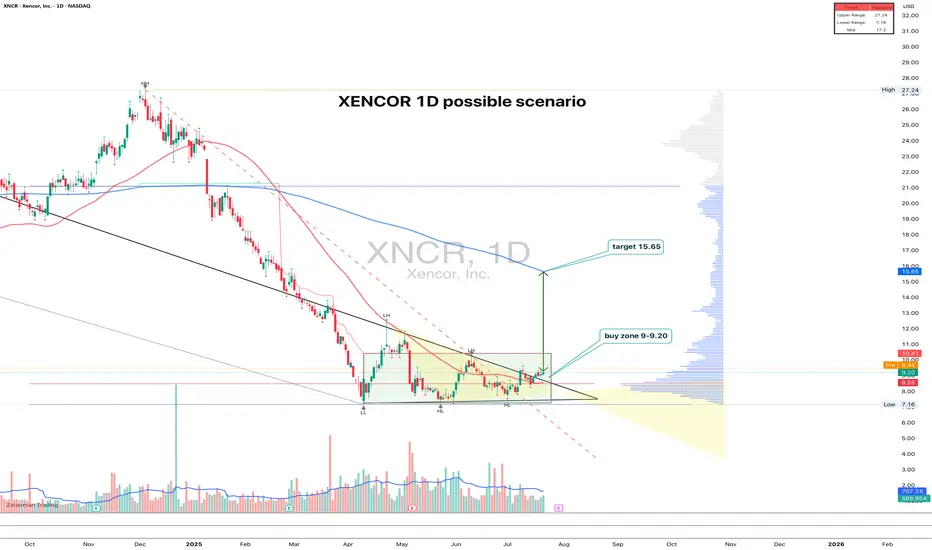
XNCR 1D time to growth?XNCR: the uptrend hasn't started yet - but someone's quietly accumulating
XNCR spent nearly 4 months building a base and finally broke out of consolidation with a clear upward move. The pattern looks like a range with a narrowing triangle at the bottom — the breakout came with rising volume. Entry makes sense in the 9.00–9.20 zone on a retest. Volume profile and Fib levels confirm the importance of this area, plus there’s a clean support shelf at 9.00. The target is 15.65, which aligns with the height of the structure. The 200-day MA is still above price, but a push beyond 11.00 could open the door to acceleration.
Fundamentally, Xencor is a biotech company focused on monoclonal antibodies. After a tough 2023–2024 and cost reductions, the market is beginning to price in signs of recovery. Key partnerships remain intact, the pipeline is alive, and recent data for XmAb7195 was well received at industry events. Valuation remains low, and biotech ETF flows are slowly picking up.
Still a relatively low-volume name, but the structure is clean, the setup is readable, and fundamentals are turning. With a tight stop below 8.50, the risk-reward looks solid.
ABCL — Bullish Breakout with Upside PotentialAbCellera Biologics Inc. (ABCL) has recently confirmed a breakout above a long-term descending trendline, followed by a successful retest of both the trendline and previous local highs. This technical development increases the probability of a sustained upward move.
The first target stands around $5.70, with a potential medium-term extension toward $13.20, offering attractive risk-to-reward parameters.
The company operates in the biotechnology and healthcare innovation sector — one of the most promising and rapidly advancing industries. While such stocks often face increased volatility due to news-driven events, the potential for high returns makes them compelling for both swing traders and long-term investors.

Kiniksa (KNSA) – Rare Disease Revenue & Pipeline Momentum Company Overview:
Kiniksa NASDAQ:KNSA is establishing itself as a high-growth biopharma player, with a sharp focus on autoimmune and inflammatory diseases. The company’s strategy is paying off through commercial execution and a robust, de-risked pipeline.
Key Catalysts:
🏆 Arcalyst Commercial Success
Core driver in recurrent pericarditis treatment
Delivering double-digit YoY revenue growth
Expanding potential in broader inflammatory indications
🧬 Deep Clinical Pipeline
KPL-404 (anti-CD40): Targets autoimmune diseases like lupus and rheumatoid arthritis
Mavrilimumab: Late-stage potential in rare inflammatory conditions
Orphan Drug & Breakthrough Therapy designations → accelerated approvals + exclusivity
📊 Strong Earnings Momentum
Recent beat on both revenue and EPS
Reinforces credibility in commercial & clinical execution
May attract institutional investors and technical breakout traders
Investment Outlook:
✅ Bullish Above: $23.00–$24.00
🎯 Target Price: $38.00–$40.00
📈 Thesis Drivers: Proven revenue engine (Arcalyst), high-potential pipeline, regulatory tailwinds, and institutional attention
🔬 Kiniksa is not just a clinical-stage story—it's a commercial growth engine with rare disease upside. #KNSA #BiotechStocks #RareDisease

Is Gene Editing's Investment Promise Within Reach?CRISPR Therapeutics stands at the vanguard of the gene editing revolution, transitioning into a commercial-stage biopharmaceutical entity following the landmark approval of CASGEVY. This first-of-its-kind gene editing treatment targets sickle cell disease and beta-thalassemia, validating the transformative potential of CRISPR-Cas9 technology and signaling the dawn of a new medical era. CASGEVY's market entry provides critical proof of concept, paving the way for broader gene editing applications in treating genetic disorders.
Despite this scientific triumph, CASGEVY's commercial launch faces immediate hurdles, primarily its high cost and complex administration, contributing to slow initial sales. While development partner Vertex Pharmaceuticals reports the revenue, CRISPR receives a profit share. The company currently operates at a loss, with operating expenses significantly exceeding revenue, primarily from grants. However, a robust cash reserve provides financial stability as CRISPR pursues an ambitious pipeline targeting widespread diseases like cancer, diabetes, and cardiovascular conditions, alongside its commercial efforts with CASGEVY.
The intellectual property landscape remains dynamic, marked by ongoing patent disputes over the foundational CRISPR-Cas9 technology, which could influence future licensing and competition. Simultaneously, CRISPR Therapeutics contributes to advancements in personalized medicine and delivery systems. A notable achievement includes the rapid development and delivery of a personalized mRNA-based CRISPR therapy for a rare metabolic disorder using lipid nanoparticles, demonstrating a potential model for swift, patient-specific treatments and highlighting the crucial role of advanced delivery technologies in expanding gene editing's therapeutic reach.
For investors, CRISPR Therapeutics presents a high-risk, high-reward opportunity. The stock has experienced volatility, reflecting current unprofitability and market conditions. Yet, strong institutional ownership and optimistic analyst ratings underscore confidence in the long-term potential. The company's deep pipeline and foundational technology position it for significant future growth if clinical programs succeed and commercial adoption of its therapies expands, suggesting that for those with a long-term perspective, the promise of gene editing may indeed be within reach.

Post-Report Sell-Off Seen as UnwarrantedSupporting Arguments
The market's reaction to the Q1 report was excessively negative
The stock possesses fundamental upside potential driven by a high revenue growth rate
The technical analysis indicates a probable rebound
Investment Thesis
GeneDx (WGS) specializes in delivering precise medical diagnostic results, leveraging exome and genomic testing to accurately diagnose genetic disorders. The company exclusively generates its revenue within the United States.
The recent GeneDx report significantly exceeded market expectations, yet the market's reaction was starkly negative. In our assessment, this presents a promising acquisition opportunity for WGS. Revenue for the first quarter of 2025 surpassed consensus estimates by 9.6%, also resulting in a substantial positive EPS surprise. The company has revised its full-year 2025 revenue guidance upwards by a median of $12.5 million, now projecting between $360 million and $375 million. This adjustment accounts for an anticipated $3 million to $5 million in revenue from the prospective acquisition of Fabric Genomics. The net increase in the guidance aligns closely with the value realized from the first-quarter surprise.
The only potentially contentious aspect of the report is the recorded 0.5% q/q decline in testing volumes within the largest revenue-generating segment, exome and genome sequencing. This trend has not been observed in this segment before. However, a seasonal dip in Q1 testing volumes is typical within the laboratory industry. This decline is primarily driven by a reduced number of working days in the first quarter and heightened diagnostic demand in Q4, as patients seek to maximize their insurance benefits before year-end. Historically, the low base effect coupled with GeneDx's robust sequential growth has counterbalanced unfavorable seasonal trends in Q1. Additionally, in the latest quarter, management cited the California wildfires as a possible negative influence on testing volumes. Consequently, we believe this testing dynamic does not warrant the marked downtrend seen in the price of WGS, especially given the upgraded guidance and the expansion of the product portfolio, both of which are poised to drive revenue growth over the next three years.
WGS stock is fundamentally undervalued. The GeneDx peer group has maintained a trading average of a 6.8 EV/Sales multiple over the past three years. We regard this figure as an appropriate target for GeneDx. Presently, the 2026 EV/Sales multiple stands at 5.6. We believe that sustained robust revenue growth over the next three years provides ample opportunity for valuation appreciation from the existing levels. Utilizing comparative valuation metrics, we project a target price for WGS shares at $87 over the next two months, accompanied by a "Buy" recommendation.
To mitigate risks, we advise establishing a stop-loss at $58. From a technical standpoint, a robust short-term support zone is identified within the range extending from $60 to the 200-day moving average.

ADMA Biologics, Inc. (ADMA) – Plasma Power with Policy TailwindsCompany Snapshot:
ADMA Biologics NASDAQ:ADMA is carving out a dominant position in plasma-derived immunotherapies, with a 100% U.S.-based supply chain that delivers both regulatory resilience and logistical strength in a vital healthcare segment.
Key Catalysts:
Strategic Domestic Advantage 🇺🇸
Fully U.S.-based manufacturing and supply chain
Aligns with national healthcare policy and reduces global exposure risk
Elite Healthcare Partnerships 🏥
Works with Mayo Clinic & Cleveland Clinic
Validates product quality and ensures recurring revenue streams
Strong Insider Conviction 📈
CEO Adam Grossman purchased $1.2M in stock
Insiders own 12%, showing long-term commitment
Plasma Therapy Demand on the Rise 🚨
Growing market for immune deficiency and infectious disease treatments
Reliable production scale + strategic partnerships = compounding value
Investment Outlook:
✅ Bullish Above: $19.00–$20.00
🚀 Target Range: $29.00–$30.00
🔑 Thesis: Fully domestic moat + institutional partnerships + insider alignment = high-conviction growth biotech
📢 ADMA: A rare mid-cap with stability, growth, and a policy-aligned advantage.
#BiotechStocks #PlasmaTherapy #Immunology #ADMA #InsiderBuying #HealthcareMoat

Breaking: Vision Marine Technologies (VMAR) Set For 1700% SurgeVision Marine Technologies Inc. (NASDAQ: VMAR) is set poised to capitalied on a patterned from on the 12 hour price chart pattern called the U-shaped cup shape which is a bullish pattern depending on the trend and shape of the cup.
With the Relative Strength Index (RSI) at 29, NASDAQ:VMAR is looking poised to capitalized on this dip that is forming a U-shaped cup pattern looking forward to delivering a 1700% surge.
As of the time of writing, the stock closed Monday's session up by 9.07% showing an increased in the influx of buyers.
About VMAR
Vision Marine Technologies Inc. designs, develops, manufactures, rents, and sells electric boats in Canada, the United States, and internationally. The company offers e-motion electric powertrain technology; e-motion electric outboard powertrain system; electric boats; and maintenance, repair, and customer support services, as well as manufactures customized boats.
Financial Performance
In 2024, VMAR's revenue was 3.79 million, a decrease of -32.86% compared to the previous year's 5.65 million. Losses were -14.06 million, -32.65% less than in 2023.
Analyst Forecast
According to Lucas Ward from Ascendiant Capital, the rating for VMAR stock is "Strong Buy" and the 12-month stock price forecast is $270.0 with a whopping +5,057.10% returns

OKYO Pharma Limited (NASDAQ: OKYO) Set for 70% SurgeNASDAQ:OKYO could be on the cusp of a significant breakout. We believe NASDAQ: NASDAQ:OKYO could be a boomer trade with a potential 70% surge in sight, offering a compelling short-term opportunity while also holding long-term promise as a transformative player in the biotech and ophthalmology space.
Technical Overview
OKYO Pharma Limited (NASDAQ: OKYO) shares are down 7.33% in Monday's market trading. The stock’s Relative Strength Index (RSI) stands at 47, which, despite the recent decline, suggests that bullish momentum is building. The RSI is neither overbought nor oversold, indicating a healthy consolidation phase before a potential upward move.
For OKYO Pharma Limited (NASDAQ: OKYO) shares, the immediate support lies in the $0.926 pivot level not so far from the current price will serve as a springboard towards greater highs with eyes set on 70% gain as confirmed by the chart pattern.
Similarly, a breakout above the $1.55 resistant level could pave the way for the anticipated 70% surge on the horizon without testing the support point aforementioned above.
About OKYO Pharma Limited (NASDAQ: OKYO)
OKYO Pharma Limited (NASDAQ: NASDAQ:OKYO ) is a United Kingdom-based clinical-stage biopharmaceutical company, founded in 2007, that focuses on developing innovative therapeutics for inflammatory eye diseases and ocular pain. The company went public on May 17, 2022, and operates within the healthcare sector, specializing in ocular health advancements. OKYO is led by CEO Gary S. Jacob and a dedicated team, working to address unmet needs in ophthalmology.

Hoth Therapeutics (NASDAQ: HOTH) Could Be the Next 100% RunnerHoth Therapeutics, Inc. (NASDAQ: HOTH) shares are down slightly by 1.83% in Thursday’s trading session, but the technical outlook suggests a major breakout could be on the horizon. A fully formed falling wedge pattern has developed on the chart, and liquidity has been swept to the downside. The stock attempted to break out of this wedge in early March 2025, but the move was faded due to broader market consolidation, influenced by recent uncertainties surrounding Trump’s tax policy. However, the current setup indicates that a breakout remains imminent, with a potential 100% surge in sight.
The 12-hour chart shows that the Relative Strength Index (RSI) currently sits at 50.66, positioning the stock in a neutral zone. This is a strong indicator that NASDAQ: HOTH could gain traction as buyers begin to accumulate, capitalizing on its stability. The stock’s ability to maintain strength at this level suggests that momentum could shift rapidly if bullish pressure increases.
Key Fibonacci retracement levels are also aligning with this bullish setup. The 65% and 61.8% Fibonacci zones are acting as the primary breakout points, which correspond to the $1.40–$1.50 price range. If NASDAQ: HOTH successfully breaks through these levels, a strong upward move could follow, validating the 100% surge potential. This setup is further reinforced by increasing trading volume and early signs of buyer interest, which could trigger the anticipated breakout.
With volume ticking up and key resistance levels within reach, Hoth Therapeutics, Inc. (NASDAQ: HOTH) shares are shaping up for a move that could catch many off guard. Historically, setups like this don’t stay quiet for long—once momentum kicks in, those on the sidelines may find themselves chasing the action.
About Hoth Therapeutics, Inc. (NASDAQ: HOTH)
Founded in 2017, Hoth Therapeutics, Inc. (NASDAQ: HOTH). is a clinical-stage biopharmaceutical company dedicated to developing innovative therapies for unmet medical needs. Headquartered in New York, the company focuses on advancing treatments across multiple therapeutic areas, including dermatology, oncology, neurology, and immunology.
Important Dates
The next estimated earnings date is Thursday, March 27, 2025, after market close.
Analysts Ratings
Hoth Therapeutics (NASDAQ: HOTH) has garnered strong support from analysts, with a 12-month average price target of $4.75, representing a potential upside of 339.81% from the current price of $1.08. Analysts have given HOTH a "Strong Buy" rating, signaling confidence in the stock's growth potential.
With institutional interest rising and Hoth targeting multi-billion-dollar healthcare markets, this stock offers an opportunity for both immediate momentum and long-term growth.
Don’t overlook Hoth Therapeutics (NASDAQ: HOTH)—a major breakout could be on the horizon.

$TGTX Stock Set For Breakout Amidst Symmetrical Triangle PatternTG Therapeutics, Inc. (NASDAQ: NASDAQ:TGTX ) a biopharmaceutical company, that focuses on the acquisition, development, and commercialization of novel treatments for B-cell mediated diseases in the United States and internationally is set for a breakout amidst a bullish symmetrical triangle pattern.
Analyst Forecast
According to 6 analysts, the average rating for TGTX stock is "Strong Buy." The 12-month stock price forecast is $40.67, which is an increase of 35.16% from the latest price.
Important Dates
The next confirmed earnings date is Monday, March 3, 2025, before market open.
On How the bullish symmetrical plays out is largely incumbent on the earnings report slated for today Monday March 3, 2025 before the bell.

$CRSP: A BioTech to add to the watchlist! 95% UpsideNASDAQ:CRSP
Not a High Five Setup...yet
-H5 Indicator is GREEN
-Filling Volume Profile GAP and setting up at a new Volume Profile Shelf
-Need Wr% to push up above -20 and form Williams Consolidation Box
-Need to breakout of Symmetrical Triangle at $56ish
If we get that it will be a H5 Trade and look for targets:
🎯$73 🎯$91 📏$110 ⏳Before mid-2026
NFA

This BioTech is about to EXPLODE! 165%+ Move InboundChart #4/ 40: NASDAQ:ALGS ⚕️
-Falling Wedge Breakout
-H5 Indicator is Green
-Volume Shelf Launch
-Williams Consolidation Box Thriving
🎯 $60📏 $68 ⏳ Before 2027
NFA

$VKTX is about to FEAST! Don't miss out on this BioTech trade. 🚀 Here it is: Your Free Saturday Setup! 🚀
Just as promised, here is a detailed video analysis on NASDAQ:VKTX Viking Therapeutics! 🧬 This trade meets all the criteria of my "High Five Setup" trading strategy, backed by solid technical analysis. Also, it has the potential to return over 100% on your capital deployed.
With more probabilities on our side, the likelihood of success is through the roof! 📈💥
Check it out, and let’s ride this wave together! 🌊
Stay tuned for more insights! 🔔
NFA
#Trading #StockMarket #Biotech #Investing #HighFiveSetup

Gilead Sciences (GILD): Will Support Hold or Will We See a Drop?We've neglected Gilead Sciences for a while, but it's time for an update. Unfortunately, our entry looking back wasn't ideal, as the stock has fallen below the 61.8% retracement level. It found support just below the 78.6% level, which marks the bottom of our range. This level was precisely touched, and we saw a relatively good movement upward from there.
However, the outlook remains uncertain. We hope that the stock does not fall below this range bottom, as it would prompt us to consider cutting it. Our first take-profit target is at the range high around $86.5, but reaching this level will take time as Gilead Sciences is currently underperforming.
Unlike most other stocks, Gilead Sciences operates in the research sector, not the tech sector. This means it follows a different cycle and is influenced by different capital flows. It tends to perform well when tech stocks do poorly. If tech stocks remain bullish, Gilead Science might continue to struggle. However, if there's a shift, Gilead Science could reverse and potentially reach up to $123, though this is quite far off.
We are holding our position for now, hoping not to cut if the stock falls out of the range. If it does, we will take necessary action.

MGNX a biotechnology penny stock LONGMacrogenenics sold-off 75% from a moderately bad earnings miss 2 weeks ago. It will be a slow
and gradual recovery in the 10 -12 weeks until the next earnings unless a favorable catalyst
appears. 5 patients died in a clinical study about the same time as earnings were due. This was
a news catalyst amplifying the earnings miss. What is unclear is the total number of patients
being studied, how many who died got the developmental drug and how many got the placebo.
Two deaths were deemed to be unrelated to that drug possibly because they did not receive
it. No matter, the investigation continues. I suspect the clinical trial is at least suspended
and could get terminated. MGNX has six other drugs in development. None are past Phase 3
and so none are revenue producing. MGRX could fail financially or clinical but then again it
could recover. If fialing it could sell-off its intellectual property and clinical trials data or
look for a rich uncle looking to get in to the cancer drug market. Only time will tell.
I see this as a very risky long trade targeting fib levels. I will devote a small capital position
here anticipating anything from a 200-250% return to hitting a 25% stop loss and calling it
finished. IF MGNX can move up I will make sure the stop loss is raised and diminshed a bit.
Those without risk appetite and a pinch of greed should take a pass on this one. Another piece
of bad news could be catastrophic while on the other hand clearance of liability by the FDA and
resumption of the clinical trial would be quite uplifting. It could be a coin flip.

JAN on watch for bullish continuation LONGJAN had earnings but I cannot find the report. It is trading with heavy volume and it shows in
the price action. Price has pulled back in the after-market in a standard Fibonacci retracement.
A pullback is appropriate here as price has gained 250% in a month. I see the pullback
as healthy and JAN is now well positioned for another bullish continuation. Volatility
and volume supports the conclusion. I will set a stop loss at 10% and targets at 50%, 75% and
100% to take partial profits on an anticipated trend up. Alerts will be set onto a set of
moving averages on the 30 minute time frame to detect death cross unders. Once profit is
hits 10% I will change the stop loss to a trailing 10% stop loss and once above 75% make the
trailing loss 5% and once over 100% change it to 3% so I can let the trade run itself from
those orders.

IBB Biotech is due for a runAt some point there will be a boom biotechnology stocks. They haven't done much in the past ten years. I believe IBB will pass 250 within the decade. However, if the market remains stable, without any 20%+ corrections, I think IBB hits 250 to 300 in the next year

SRZN a Penny biotech LONGSRZN has had good momentum. It has no revenues. Clinical trials but a lot of cash. SRZN has
advanced trials underway for a product to treat alcoholic hepatitis presumably settling it down
before it becomes irreversible cirrhosis (only for patients who are alcohol-free) and also useful
for liver metabolic disorders from a genetic basis.
SRZN has been trending up for a week with a bit of a pause in the middle of it. It picked up
60% of its price while breaking out through the anchored VWAP lines and the volume profile.
The far greater market is the former.
It is priced at 90 or more off it's all-time high of about $160. IF it picks up hype from the
last clinical trial getting a report and a calendared review by the, SRZN could reach for that
all time high. This is speculative and risky as are most biotechnology penny stocks. They are
trading news and potential not current net revenues. A small position with room in the stop
loss for the average range and volatility is best. This is a typical high risk higher potential
reward type of trade.

HRTX a biotech penny stock with 70% in two months LONGHRTX has been suggested by various trading websites as a potentially explosive penny biotech
stock for 2024. It has experienced excellent price actions since an earnings beat in November.
It beat the estimates; that is to say it burned about half as much cash as the analysts estimated
the it would. Today it pumped 11%. Relevant articles can be found compiled on the Yahoo
Finance page linked here.
The chart is 120 minutes. A alpha trend indicator is shown and the supertrend since the
November earnings is upward. An AI Lorentzian indicator is added with a 2000 candle lookback
to generate buy and sell signals. It calculated a 59% win on 83 trades over those 2000 candles
two hours each; this amounts to about 2000 x 2 / 6 hrs per session or more than 600 trading
days = 2 1/2 years.
Also supporting an entry at this time is the faster (45 min) RSI line rising over the 50 level
while the slower ( 240 minutes in red) RSI line has been over the 50 level since those earnings.
The ADX indicator had a DI- and DI + flip with a mini pullback to close out last week's trading
( profit taking).
The volatility indicator also showed that dip with selling volatility greater than buying which
has now flipped.
Given that price has went 5X in 2 months , there is a possibility HRTX is overbought.
Analysts seem to think otherwise.
I will take a stock position here and anticipate holding the position into the next earnings.
For trade management I will take partials of 5 % each at the high of day for ten days going
into earnings and hold the remaining 50% through the earnings. In the meanwhile I will review
the trade if the machine-learning alo indicator generates either a buy or sell signal.
For those lacking the risk tolerance for money-losing biotechnology penny stocks with high
potential but are aware that biotechnology is expected to be "outperforming" in 2024,
XBI and LABU are ETFs with risk-mitigation in the form of a diverse portfolio from the sector.

Moderna Break of Major Support, Short PotentialThis is a Technical Analysis on Moderna (MRNA) on the 1 Week Timeframe.
Current price action shows that we are currently in the process of breaking a MAJOR SUPPORT Zone.
We held critical SUPPORT multiple times ABOVE the $115.00 level, for a span of about 26 months. Expressed by the GREEN circles. But notice we havent been able to successfully rally and stay above the "MAJOR RESISTANCE" line.
Though the CURRENT candle has not yet closed, which it will end of trading session Monday, the 7th of August.
This in my opinion is a critical development. If we CONFIRM below this $115 ish area, the lower range of about $82.00 of the ORANGE zone becomes more likely.
The ORANGE zone, or price range between $115 and $82 has barely any market structure or in other words barely any candles. It would be easy for price to fall stright down, in my opinion.
This can be an area to take a SHORT position.
Another thing to notice since the BLOW of top, we have been forming a DESCENDING TRIANGLE. Its been forming since August 2021, this is NO JOKE. Measuring the target of the end point of descending triangle we get about a 75% drop target. Just remember it doesnt have to play out exactly but its something to consider and keep in the back of the mind.
So just to mention:
1st Target = $82 ish area
2nd Target = $57- $47 range
Last Target = Descending triangle measured target of $29 ( *Less likely for the time being)
RSI has been:
1. printing Lower Highs
2. is currently below the Black Moving average, which i use as an indication of price moving down
3.Is currently in process of ALL TIME RSI LOW, provided we close this weeks candle at current RSI lvl.
STOCH RSI -> Setting up for a BEARish cross. This if it occurs and we are below the MAJOR SUPPORT, bearish momentum can push price down.
Lastly ADX & DI -> We have RED line cross above Green and pointing up. We need to observe this, this indicates also the BEARISH momentum is coming in. If the BLACK moving average curves up and starts moving towards the RED/GREEN line with RED being on top, this will indicate bearish momentum.
CONCLUSION:
We are at major cross roads for MRNA. If we don't have any buying occur during Mondays trading session, and we close below MAJOR SUPPORT, it may be time to SHORT MRNA. We have not had any luck trying to break and stay above the "MAJOR RESISTANCE" line. This, along with multiple touches on MAJOR SUPPORT, has made this WEAK (in my opinion). Short targets include the primary, secondary and descending triangle target levels. Indicators are also shaping up to support the current price action. At times like this, it is important to observe further clues of bearish activity, to be patient and take it one step at a time.
Thank you for taking the time to read my analysis. Hope it helped keep you informed. Please do support my ideas by boosting, following me and commenting. Thanks again.
If you have any questions, do reach out. Thank you again.
DISCLAIMER: This is not financial advice, i am not a financial advisor. The thoughts expressed in the posts are my opinion and for educational purposes. When trading always spend majority of your time on risk management strategy.

FULC Biotech Fib Level BouncdFULC on the 15 minute chart had a good response to favorable earnings and then retraced.
It is now bounding off the Fib 0.5 level and also confluent with the POC line of the volume
profile and the mean of the anchored VWAP. Buying volume appropriately overtook selling
volume on the reversal Luxalgo's Echo indicator, an AI predictive tool, suggests a 10% price
rise in the after-hours which is typically a busy trading period for biotechnology penny stocks.
I will take a long trade on FULC in after hours and take off a part of the position in the next
trading day and hold the rest through the weekend.

APLT Biotech NASDAQ Penny LONGApplied Therapeutics is an uptrending biotechnology company that has earnings
in prior quarters and is heading into another earnings report about may 11th.
The run up in price cction is largely on the proposition of future growth much
like TSLA back in the day.
On the chart besides the obvious uptrend, the volume indicator shows a dramatic
volume surge compared with the running 50 day average while the MACD shows
the lines above the histogram and running upward and parallel.
The ideal entry would be a pullback as the price is now quite extended however
I do not believe that will occur until at least after earnings. I believe
this strong runner will continue until earnings unabated.
As a penny stock many shares can be taken and then the position can be closed
in partials along the way thus taking profits and decreasing the risk in steps.
The same applies to the call options.
